EUR USD H4 SELLA bearish medium-term structure has been confirmed to complete the correction, which will fall again
EUR (Euro)
Heading into 61.8% Fibonacci resistance?EUR/NOK is rising towards the pivot and could drop to the pullback support.
Pivot: 11.73260
1st Support: 11.66314
1st Resistance: 11.78139
Risk Warning:
Trading Forex and CFDs carries a high level of risk to your capital and you should only trade with money you can afford to lose. Trading Forex and CFDs may not be suitable for all investors, so please ensure that you fully understand the risks involved and seek independent advice if necessary.
Disclaimer:
The above opinions given constitute general market commentary, and do not constitute the opinion or advice of IC Markets or any form of personal or investment advice.
Any opinions, news, research, analyses, prices, other information, or links to third-party sites contained on this website are provided on an "as-is" basis, are intended only to be informative, is not an advice nor a recommendation, nor research, or a record of our trading prices, or an offer of, or solicitation for a transaction in any financial instrument and thus should not be treated as such. The information provided does not involve any specific investment objectives, financial situation and needs of any specific person who may receive it. Please be aware, that past performance is not a reliable indicator of future performance and/or results. Past Performance or Forward-looking scenarios based upon the reasonable beliefs of the third-party provider are not a guarantee of future performance. Actual results may differ materially from those anticipated in forward-looking or past performance statements. IC Markets makes no representation or warranty and assumes no liability as to the accuracy or completeness of the information provided, nor any loss arising from any investment based on a recommendation, forecast or any information supplied by any third-party.

Bearish drop?The Fiber (EUR/USD) is rising towards the pivot and could drop to the 1st support which has been identified as a pullback support.
Pivot: 1.0350
1st Support: 1.0264
1st Resistance: 1.0423
Risk Warning:
Trading Forex and CFDs carries a high level of risk to your capital and you should only trade with money you can afford to lose. Trading Forex and CFDs may not be suitable for all investors, so please ensure that you fully understand the risks involved and seek independent advice if necessary.
Disclaimer:
The above opinions given constitute general market commentary, and do not constitute the opinion or advice of IC Markets or any form of personal or investment advice.
Any opinions, news, research, analyses, prices, other information, or links to third-party sites contained on this website are provided on an "as-is" basis, are intended only to be informative, is not an advice nor a recommendation, nor research, or a record of our trading prices, or an offer of, or solicitation for a transaction in any financial instrument and thus should not be treated as such. The information provided does not involve any specific investment objectives, financial situation and needs of any specific person who may receive it. Please be aware, that past performance is not a reliable indicator of future performance and/or results. Past Performance or Forward-looking scenarios based upon the reasonable beliefs of the third-party provider are not a guarantee of future performance. Actual results may differ materially from those anticipated in forward-looking or past performance statements. IC Markets makes no representation or warranty and assumes no liability as to the accuracy or completeness of the information provided, nor any loss arising from any investment based on a recommendation, forecast or any information supplied by any third-party.

EUR-CHF Potential Long! Buy!
Hello,Traders!
EUR-CHF is making a local
Bearish correction but the
Pair will soon hit a rising
Support line from where
We will be expecting a
Local bullish rebound
Buy!
Comment and subscribe to help us grow!
Check out other forecasts below too!

Potential bullish rise?EUR/USD has reacted off the support level which is a pullback support that aligns with the 50% Fibonacci retracement and could rise from this level to our take profit.
Entry: 1.0263
Why we like it:
There is a pullback support level that aligns with the 50% Fibonacci retracement.
Stop loss: 1.0192
Why we like it:
There is a pullback support level.
Take profit: 1.0348
Why we like it:
There is a pullback resistance level.
Enjoying your TradingView experience? Review us!
Please be advised that the information presented on TradingView is provided to Vantage (‘Vantage Global Limited’, ‘we’) by a third-party provider (‘Everest Fortune Group’). Please be reminded that you are solely responsible for the trading decisions on your account. There is a very high degree of risk involved in trading. Any information and/or content is intended entirely for research, educational and informational purposes only and does not constitute investment or consultation advice or investment strategy. The information is not tailored to the investment needs of any specific person and therefore does not involve a consideration of any of the investment objectives, financial situation or needs of any viewer that may receive it. Kindly also note that past performance is not a reliable indicator of future results. Actual results may differ materially from those anticipated in forward-looking or past performance statements. We assume no liability as to the accuracy or completeness of any of the information and/or content provided herein and the Company cannot be held responsible for any omission, mistake nor for any loss or damage including without limitation to any loss of profit which may arise from reliance on any information supplied by Everest Fortune Group.

EUR/NZD AnalysisEUR/NZD in my perspective is looking bearish here you guys can short here
OANDA:EURNZD

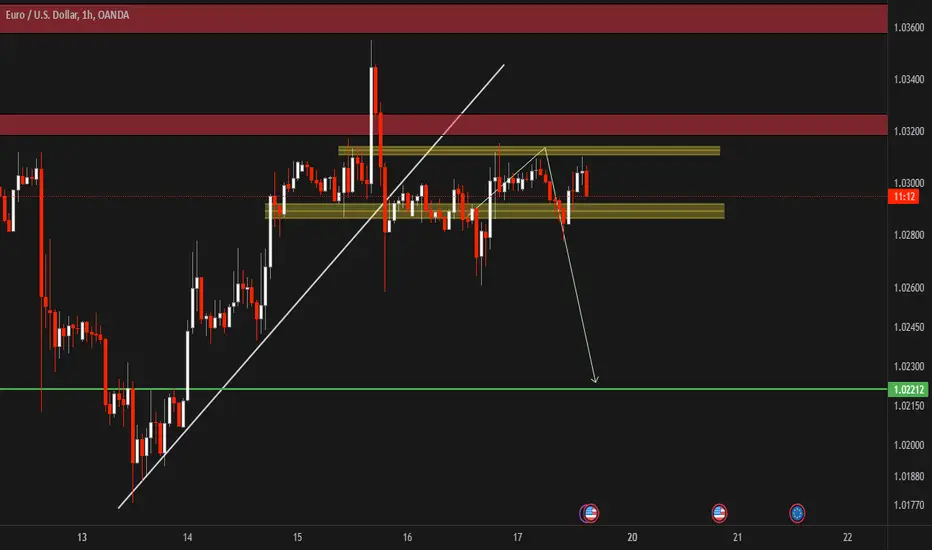
EURUSD GOING UPLow RSI + two consecutive accumulation areas means EURUSD going up ;
however the question is after this small rally, what s happening ?
That s the 1000$ question, the two yellow lines you see on the chart show that none of these schemes is more likely than the other one, we simply have no idea for now.
We'll have to wait for new elements and KL to determine that.

CHFJPY STILL NOT SUREOn one hand, it has de go back up to reach the high of the blue rectangle ;
on the other hand, it is well gone for a big descent, and it would not be crazy to think the hard blue KL is the actual low.
We'll have to be careful over the next few days because they'll be decisive regarding the pattern the curb is taking.
No matter what happens, it is to go up, the question is where s the entry ?

EUR/NZD SENDS CLEAR BEARISH SIGNALS|SHORT
Hello, Friends!
We are targeting the 1.827 level area with our short trade on EUR/NZD which is based on the fact that the pair is overbought on the BB band scale and is also approaching a resistance line above thus going us a good entry option.
✅LIKE AND COMMENT MY IDEAS✅

EURAUD possible ideaFrom our previous idea, price moved as anticipated but failed to close below our weak low. It only wicked with an asia session low, thus forming more liquidity around the weak low price failed to break. Within the range, on lower timeframe, price moved aggressively, leaving behind a clean 1 hour supply zone before it preceded to break structure. Price has currently formed asia session liquidity below this POI that it could use to fuel its move to run the weak low as well as the liquidity below asia low.

EURUSD (Liquidity Pools: A short Explainer)Liquidity Pools: A Short Explainer
A liquidity pool is an area where retail traders have pending buy/sell orders.
MM always needs to pair their buys with someone's sells, and vice versa - they 'engineer' liquidity.
If they want to go long, they create conditions whereby retail traders think the price is going lower.
If they want to go short, they create conditions whereby retail traders think the price is going higher
Price dips into liquidity pool (see the wick)
Reverses
Driving price below the swing low floods the market with liquidity for longs
How?
1. People who are long and have stops --> stops triggered --> stops become market orders to buy
2. Retail traders see 'support breaking' -> open shorts > MM sell their longs to them
Liquidity pool below the swing low
Swing lows & equal lows are high probability long liquidity pools
Market makers will target these price levels knowing
1. Retail traders already long have their stop-losses at/around swing lows
2. Swing lows seen as 'support' by retail traders

EURAUD updated ideaFrom our previous idea, we expected price to first sweep bearish trendline liquidity before we get a shift of market structure. Instead, it was vice versa, but the idea still remains the same with just a new entry point. We have currently shifted to a bearish market on lower timeframe after mitigating our previously established supply zone. Now we have an opportunity to short the market on a 15 min confirmation entry.

EUR-NZD Local Long! Buy!
Hello,Traders!
EUR-NZD has hit a horizontal
Support level of 1.8253 and
We are already seeing a
Bullish rebound so we
Will be expecting a
Further local move up
Buy!
Comment and subscribe to help us grow!
Check out other forecasts below too!

Bullish bounce?The Fiber (EUR/USD) has reacted off the pivot which is a pullback support and could bounce to the 1st resistance.
Pivot: 1.0260
1st Support: 1.0194
1st Resistance: 1.0341
Risk Warning:
Trading Forex and CFDs carries a high level of risk to your capital and you should only trade with money you can afford to lose. Trading Forex and CFDs may not be suitable for all investors, so please ensure that you fully understand the risks involved and seek independent advice if necessary.
Disclaimer:
The above opinions given constitute general market commentary, and do not constitute the opinion or advice of IC Markets or any form of personal or investment advice.
Any opinions, news, research, analyses, prices, other information, or links to third-party sites contained on this website are provided on an "as-is" basis, are intended only to be informative, is not an advice nor a recommendation, nor research, or a record of our trading prices, or an offer of, or solicitation for a transaction in any financial instrument and thus should not be treated as such. The information provided does not involve any specific investment objectives, financial situation and needs of any specific person who may receive it. Please be aware, that past performance is not a reliable indicator of future performance and/or results. Past Performance or Forward-looking scenarios based upon the reasonable beliefs of the third-party provider are not a guarantee of future performance. Actual results may differ materially from those anticipated in forward-looking or past performance statements. IC Markets makes no representation or warranty and assumes no liability as to the accuracy or completeness of the information provided, nor any loss arising from any investment based on a recommendation, forecast or any information supplied by any third-party.

EURUSD: short term buy on the 1H MA50 in order.EURUSD is neutral on its 1H technical outlook (RSI = 48.015, MACD = 0.001, ADX = 25.709) as it pulled back to its 1H MA50 today but managed to find enough support to bounce even though it crossed it. The pattern is a Channel Down, so the overall trend is bearish but this is its bullish wave and as long as the 1H MA50 holds, we can technically make one last High. Every rebound since the Channel Down bottomed on January 13th, has been of +1.00%. We are expecting another one, so place your targets accordingly (TP = 1.03500).
## If you like our free content follow our profile to get more daily ideas. ##
## Comments and likes are greatly appreciated. ##

EURNZD Bullish rally soonPrice restested broken H4 trendline and now forming a possible inverted H&S. 1.8300, 61.8 also additional confluences.
