Potential bearish drop?EUR/USD has rejected off the resistance level which is a pullback resistance that aligns with the 38.2% Fibonacci retracement and could drop from this level to our take profit.
Entry: 1.1524
Why we like it:
There is a pullback resistance level that align with the 38.2% Fibonacci retracement.
Stop loss: 1.1572
Why we like it:
There is a pullback resistance level that is slightly above the 61.8% Fibonacci retracement.
Take profit: 1.1452
Why we like it:
There is a pullback support level that lines up with the 127.2% Fibonacci extension.
Enjoying your TradingView experience? Review us!
Please be advised that the information presented on TradingView is provided to Vantage (‘Vantage Global Limited’, ‘we’) by a third-party provider (‘Everest Fortune Group’). Please be reminded that you are solely responsible for the trading decisions on your account. There is a very high degree of risk involved in trading. Any information and/or content is intended entirely for research, educational and informational purposes only and does not constitute investment or consultation advice or investment strategy. The information is not tailored to the investment needs of any specific person and therefore does not involve a consideration of any of the investment objectives, financial situation or needs of any viewer that may receive it. Kindly also note that past performance is not a reliable indicator of future results. Actual results may differ materially from those anticipated in forward-looking or past performance statements. We assume no liability as to the accuracy or completeness of any of the information and/or content provided herein and the Company cannot be held responsible for any omission, mistake nor for any loss or damage including without limitation to any loss of profit which may arise from reliance on any information supplied by Everest Fortune Group.
EUR (Euro)

EURUSD: 4H MA50 may start aggressive rally to 1.17900.EURUSD is bullish on its 1D technical outlook (RSI = 58.513, MACD = 0.005, ADX = 36.044), trading inside a Channel Up for the past 5 weeks. Yesterday it made contact with its 4H MA50, which is the most common level of support inside this pattern. Based on that, we find highly probable for the pair to start the new bullish wave. A HH on the 2.0 Fibonacci extension has been a common feature of this Channel Up, hence we are turning bullish here with TP = 1.17900.
## If you like our free content follow our profile to get more daily ideas. ##
## Comments and likes are greatly appreciated. ##

EUR/USD Potential Reversal from Resistance Zone –Bearish OutlookThe EUR/USD pair has been trading within a well-defined ascending channel for several weeks. Price recently tested a strong resistance zone near 1.15850 – 1.16000, which aligns with the upper boundary of the channel and a previously marked supply area.
Key observations:
The price action shows signs of rejection from the resistance zone with a potential double-top or fakeout pattern forming.
A projected bearish trajectory is marked, suggesting a possible break below the channel support.
Immediate bearish targets are set at key demand zones around 1.14500, 1.12500, and further down to 1.10500.
A large red arrow indicates the strong downside bias if the price confirms the breakdown.
Conclusion:
If EUR/USD fails to sustain above the 1.15850 resistance zone and breaks below the ascending channel, a strong bearish correction is anticipated. Traders should watch for confirmation of the breakdown before entering short positions.

EUR/USD Bearish Reversal AnalysisEUR/USD Bearish Reversal Analysis 📉🧭
🔍 Technical Breakdown:
Trend Structure:
EUR/USD was trading inside an ascending channel, respecting both support and resistance trendlines.
🔴 Double Rejection at Resistance:
Price action faced strong rejection near the upper boundary of the channel and resistance zone (~1.16500), forming a lower high, suggesting bearish exhaustion.
🟠 Key Breakdown Zone:
A critical horizontal support around 1.13560 has been identified as a short-term target zone. This level previously acted as a demand zone and now may be retested.
🔽 Forecast Path:
A projected bearish wave is anticipated:
A potential pullback or consolidation may occur before resuming the downtrend.
Once 1.13560 is broken, price could drop further toward the major support zone around 1.12000, marked by the previous accumulation area.
🟦 Support Zone:
This final target aligns with a major structural support from late May, strengthening the bearish outlook if the breakdown continues.
📌 Conclusion:
EUR/USD is showing signs of a bearish reversal after failing to sustain above resistance. As long as it remains below the mid-channel region, further downside toward 1.12000 is likely, with 1.13560 as the key short-term level to watch.

EURCHF SHORT FORECAST Q2 W25 D18 Y25EURCHF SHORT FORECAST Q2 W25 D18 Y25
Professional Risk Managers👋
Welcome back to another FRGNT chart update📈
Diving into some Forex setups using predominantly higher time frame order blocks alongside confirmation breaks of structure.
Let’s see what price action is telling us today! 👀
💡Here are some trade confluences📝
✅Weekly 50EMA Rejection
✅15' Order block
✅1H Order Block
✅Intra day bearish BOS
🔑 Remember, to participate in trading comes always with a degree of risk, therefore as professional risk managers it remains vital that we stick to our risk management plan as well as our trading strategies.
📈The rest, we leave to the balance of probabilities.
💡Fail to plan. Plan to fail.
🏆It has always been that simple.
❤️Good luck with your trading journey, I shall see you at the very top.
🎯Trade consistent, FRGNT X

Bullish bounce?The Fiber (EUR/USD) is falling towards the pivot and could bounce to the 1st resistance.
Pivot: 1.1451
1st Support: 1.1342
1st Resistance: 1.1614
Risk Warning:
Trading Forex and CFDs carries a high level of risk to your capital and you should only trade with money you can afford to lose. Trading Forex and CFDs may not be suitable for all investors, so please ensure that you fully understand the risks involved and seek independent advice if necessary.
Disclaimer:
The above opinions given constitute general market commentary, and do not constitute the opinion or advice of IC Markets or any form of personal or investment advice.
Any opinions, news, research, analyses, prices, other information, or links to third-party sites contained on this website are provided on an "as-is" basis, are intended only to be informative, is not an advice nor a recommendation, nor research, or a record of our trading prices, or an offer of, or solicitation for a transaction in any financial instrument and thus should not be treated as such. The information provided does not involve any specific investment objectives, financial situation and needs of any specific person who may receive it. Please be aware, that past performance is not a reliable indicator of future performance and/or results. Past Performance or Forward-looking scenarios based upon the reasonable beliefs of the third-party provider are not a guarantee of future performance. Actual results may differ materially from those anticipated in forward-looking or past performance statements. IC Markets makes no representation or warranty and assumes no liability as to the accuracy or completeness of the information provided, nor any loss arising from any investment based on a recommendation, forecast or any information supplied by any third-party.

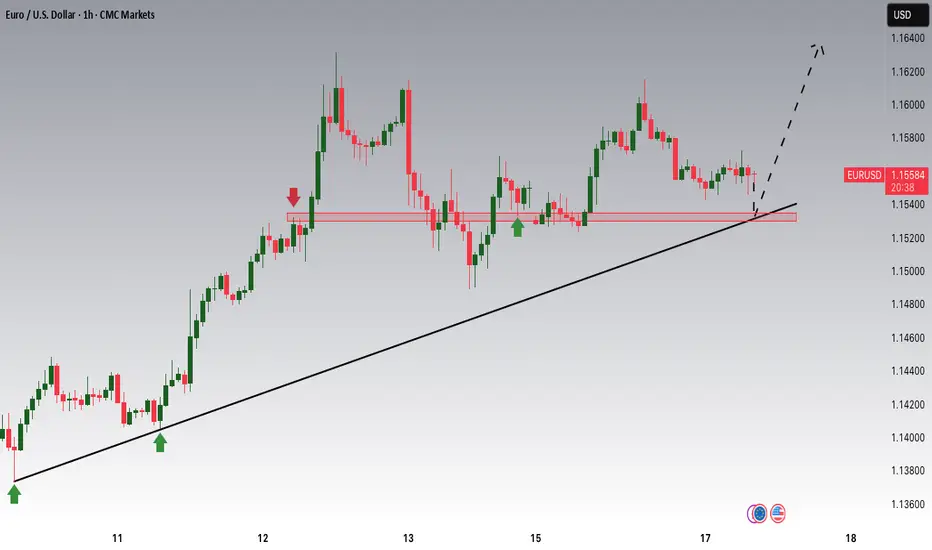
Goldman and BofA agree: The dollar is losing its edgeGoldman Sachs now expects the EUR/USD to hit 1.20 by the end of the year. While this prediction draws comparisons to the 2017 rally in the pair, Goldman notes a key difference. This time, the pricing reflects pessimism in the US dollar, rather than optimism in the euro.
Bank of America seemingly agrees and warns that even a “hawkish” dot plot at this week’s FOMC meeting, where Fed officials signal fewer rate cuts, may only cause a brief bout of euro weakness against the dollar.
EUR/USD has recently broken out of a long-term descending triangle pattern, which capped price action from mid-April through early June, aligning with Goldman Sachs’ and BofA’s view of a broad EUR strength/ USD weakness.
This recent pullback to the 1.1480 area is a retest of former resistance turned support, suggesting a potential continuation pattern if buyers defend this level.

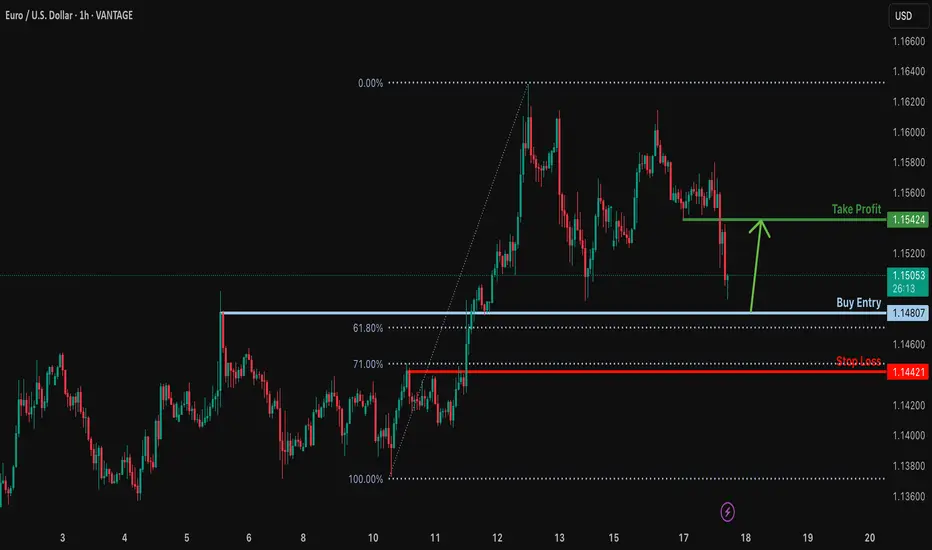
Bullish bounce?EUR/USD is falling towards the support level which is an overlap support that is slightly above the 61.8% Fibonacci retracement and could bounce from this level to our take profit.
Entry: 1.1480
Why we like it:
There is an overlap support that is slightly above the 61.8% Fibonacci retracement.
Stop loss: 1.1438
Why we like it:
There is a pullback support level that lines up with the 71% Fibonacci retracement.
Take profit: 1.1542
Why we like it:
There is a pullback resistance.
njoying your TradingView experience? Review us!
Please be advised that the information presented on TradingView is provided to Vantage (‘Vantage Global Limited’, ‘we’) by a third-party provider (‘Everest Fortune Group’). Please be reminded that you are solely responsible for the trading decisions on your account. There is a very high degree of risk involved in trading. Any information and/or content is intended entirely for research, educational and informational purposes only and does not constitute investment or consultation advice or investment strategy. The information is not tailored to the investment needs of any specific person and therefore does not involve a consideration of any of the investment objectives, financial situation or needs of any viewer that may receive it. Kindly also note that past performance is not a reliable indicator of future results. Actual results may differ materially from those anticipated in forward-looking or past performance statements. We assume no liability as to the accuracy or completeness of any of the information and/or content provided herein and the Company cannot be held responsible for any omission, mistake nor for any loss or damage including without limitation to any loss of profit which may arise from reliance on any information supplied by Everest Fortune Group.
EURCHF: Bearish Continuation & Short Signal
EURCHF
- Classic bearish setup
- Our team expects bearish continuation
SUGGESTED TRADE:
Swing Trade
Short EURCHF
Entry Point - 0.9403
Stop Loss - 0.9417
Take Profit - 0.9380
Our Risk - 1%
Start protection of your profits from lower levels
Disclosure: I am part of Trade Nation's Influencer program and receive a monthly fee for using their TradingView charts in my analysis.
❤️ Please, support our work with like & comment! ❤️

eurnzd buy signal. Don't forget about stop-loss.
Write in the comments all your questions and instruments analysis of which you want to see.
Friends, push the like button, write a comment, and share with your mates - that would be the best THANK YOU.
P.S. I personally will open entry if the price will show it according to my strategy.
Always make your analysis before a trade
Euro can turn around and start to fall to support areaHello traders, I want share with you my opinion about Euro. Observing this chart, we can see how the price earlier dropped toward the 1.1360 support level and successfully broke it. Then we saw a short recovery move, but the price once again returned to the downside and retested the support line from below. After that, the market created a strong upward impulse, broke back above the 1.1360 level, and entered a phase of consolidation inside a range. This range held for some time, with price respecting both its upper and lower boundaries. Eventually, we saw a breakout from this consolidation, followed by another strong bullish impulse and a steady climb above the 1.1530 zone, where price is currently trading. However, the price has now approached a critical structure and is showing signs of weakening momentum. In my mind, the Euro may attempt one more small move up but then turn around and start declining toward the 1.1530 support level, breaking the ascending support line as well. That's why my TP is this support level, which coincides with the support area. Please share this idea with your friends and click Boost 🚀
Disclaimer: As part of ThinkMarkets’ Influencer Program, I am sponsored to share and publish their charts in my analysis.

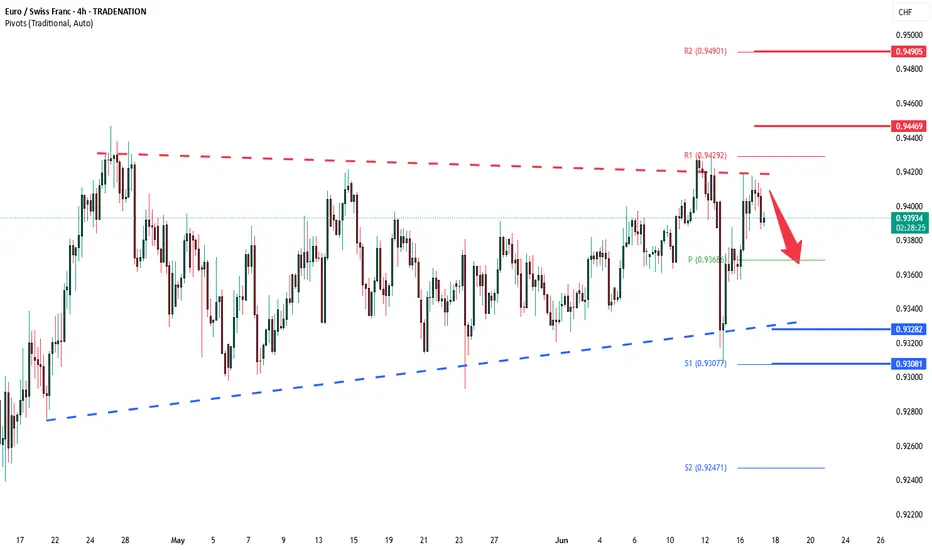
EURCHF sideways consolidation capped at 0.9430Trend Overview:
EUR/CHF continues to display a bearish trend, with current price action forming a corrective pullback against the broader downward momentum.
Key Resistance Level:
0.9430 – This is a significant previous intraday consolidation zone and currently acts as a pivotal resistance level.
Bearish Scenario (Primary Bias):
A short-term oversold rally into the 0.9430 level followed by a bearish rejection would reinforce the dominant downtrend.
Downside price targets include:
0.9370 – Initial support zone.
0.9330 – Mid-term support level.
0.9300 – Long-term structural support.
Bullish Scenario (Invalidation):
A confirmed breakout and daily close above 0.9430 would invalidate the current bearish bias.
This would open the path for a continuation toward:
0.9446 – Immediate resistance.
0.9490 – Key upper resistance and possible trend reversal confirmation level.
Conclusion:
EUR/CHF remains in a bearish structure, with the corrective pullback offering potential short entries if price is rejected at 0.9430. A failure to break this level would likely drive the pair lower toward 0.9300. However, a sustained move above 0.9430 would shift sentiment to bullish in the short term and open space for further upside toward 0.9490.
This communication is for informational purposes only and should not be viewed as any form of recommendation as to a particular course of action or as investment advice. It is not intended as an offer or solicitation for the purchase or sale of any financial instrument or as an official confirmation of any transaction. Opinions, estimates and assumptions expressed herein are made as of the date of this communication and are subject to change without notice. This communication has been prepared based upon information, including market prices, data and other information, believed to be reliable; however, Trade Nation does not warrant its completeness or accuracy. All market prices and market data contained in or attached to this communication are indicative and subject to change without notice.
EURUSD Potential UpsidesHey Traders, in today's trading session we are monitoring EURUSD for a buying opportunity around 1.15300 zone, EURUSD is trading in an uptrend and currently is in a correction phase in which it is approaching the trend at 1.15300 support and resistance area.
Trade safe, Joe.
EURCHF SHORT FORECAST Q2 W25 D17 Y25EURCHF SHORT FORECAST Q2 W25 D17 Y25
Professional Risk Managers👋
Welcome back to another FRGNT chart update📈
Diving into some Forex setups using predominantly higher time frame order blocks alongside confirmation breaks of structure.
Let’s see what price action is telling us today! 👀
💡Here are some trade confluences📝
✅Weekly 50EMA Rejection
✅15' Order block
🔑 Remember, to participate in trading comes always with a degree of risk, therefore as professional risk managers it remains vital that we stick to our risk management plan as well as our trading strategies.
📈The rest, we leave to the balance of probabilities.
💡Fail to plan. Plan to fail.
🏆It has always been that simple.
❤️Good luck with your trading journey, I shall see you at the very top.
🎯Trade consistent, FRGNT X

EUR-CHF Resistance Ahead! Sell!
Hello,Traders!
EUR-CHF keeps growing
But a strong horizontal
Resistance of 0.9445
Is ahead so after the
Retest we will be expecting
A local bearish move down
Sell!
Comment and subscribe to help us grow!
Check out other forecasts below too!
Disclosure: I am part of Trade Nation's Influencer program and receive a monthly fee for using their TradingView charts in my analysis.

Bearish drop?The Fiber (EUR/USD) has rejected off the pivot and could drop to the 1st support.
Pivot: 1.1611
1st Support: 1.1495
1st Resistance: 1.1649
Risk Warning:
Trading Forex and CFDs carries a high level of risk to your capital and you should only trade with money you can afford to lose. Trading Forex and CFDs may not be suitable for all investors, so please ensure that you fully understand the risks involved and seek independent advice if necessary.
Disclaimer:
The above opinions given constitute general market commentary, and do not constitute the opinion or advice of IC Markets or any form of personal or investment advice.
Any opinions, news, research, analyses, prices, other information, or links to third-party sites contained on this website are provided on an "as-is" basis, are intended only to be informative, is not an advice nor a recommendation, nor research, or a record of our trading prices, or an offer of, or solicitation for a transaction in any financial instrument and thus should not be treated as such. The information provided does not involve any specific investment objectives, financial situation and needs of any specific person who may receive it. Please be aware, that past performance is not a reliable indicator of future performance and/or results. Past Performance or Forward-looking scenarios based upon the reasonable beliefs of the third-party provider are not a guarantee of future performance. Actual results may differ materially from those anticipated in forward-looking or past performance statements. IC Markets makes no representation or warranty and assumes no liability as to the accuracy or completeness of the information provided, nor any loss arising from any investment based on a recommendation, forecast or any information supplied by any third-party.

Bullish bounce?EUR/USD is falling towards the support level which is a pullback support that is slightly above the 61.8% Fibonacci retracement and could bounce from this level to our take profit.
Entry: 1.1546
Why we like it:
There is a pullback support level that is slightly above the 61.8% Fibonacci retracement.
Stop loss: 1.1497
Why we like it:
There is an overlap support level.
Take profit: 1.1611
Why we like it:
There is a pullback resistance.
Enjoying your TradingView experience? Review us!
Please be advised that the information presented on TradingView is provided to Vantage (‘Vantage Global Limited’, ‘we’) by a third-party provider (‘Everest Fortune Group’). Please be reminded that you are solely responsible for the trading decisions on your account. There is a very high degree of risk involved in trading. Any information and/or content is intended entirely for research, educational and informational purposes only and does not constitute investment or consultation advice or investment strategy. The information is not tailored to the investment needs of any specific person and therefore does not involve a consideration of any of the investment objectives, financial situation or needs of any viewer that may receive it. Kindly also note that past performance is not a reliable indicator of future results. Actual results may differ materially from those anticipated in forward-looking or past performance statements. We assume no liability as to the accuracy or completeness of any of the information and/or content provided herein and the Company cannot be held responsible for any omission, mistake nor for any loss or damage including without limitation to any loss of profit which may arise from reliance on any information supplied by Everest Fortune Group.

EURUSD Last push before correction.The EURUSD pair made a new High by breaking above the 1.15725 Resistance and is extending the rally since the January 13 2025 Low. That Low was the Higher Low of the multi-year Channel Up, so the current uptrend is technically its latest Bullish Leg.
The first Bullish Leg of that pattern peaked after a +15.75% rise. We expect a similar peak for the current rally, thus targeting 1.17750, before a new pull-back below the 1D MA50 (blue trend-line).
-------------------------------------------------------------------------------
** Please LIKE 👍, FOLLOW ✅, SHARE 🙌 and COMMENT ✍ if you enjoy this idea! Also share your ideas and charts in the comments section below! This is best way to keep it relevant, support us, keep the content here free and allow the idea to reach as many people as possible. **
-------------------------------------------------------------------------------
Disclosure: I am part of Trade Nation's Influencer program and receive a monthly fee for using their TradingView charts in my analysis.
💸💸💸💸💸💸
👇 👇 👇 👇 👇 👇

EURNZD Massive Short! SELL!
My dear subscribers,
EURNZD looks like it will make a good move, and here are the details:
The market is trading on 1.9194 pivot level.
Bias - Bearish
My Stop Loss - 1.9246
Technical Indicators: Both Super Trend & Pivot HL indicate a highly probable Bearish continuation.
Target - 1.9095
About Used Indicators:
The average true range (ATR) plays an important role in 'Supertrend' as the indicator uses ATR to calculate its value. The ATR indicator signals the degree of price volatility.
Disclosure: I am part of Trade Nation's Influencer program and receive a monthly fee for using their TradingView charts in my analysis.
———————————
WISH YOU ALL LUCK

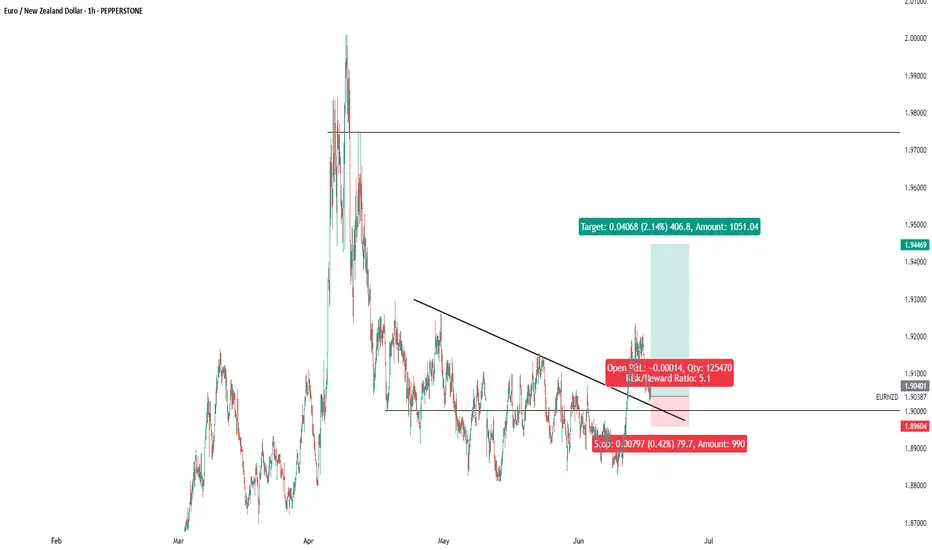
EURNZD: Short Trading Opportunity
EURNZD
- Classic bearish setup
- Our team expects bearish continuation
SUGGESTED TRADE:
Swing Trade
Short EURNZD
Entry Point - 1.9088
Stop Loss - 1.9138
Take Profit - 1.8982
Our Risk - 1%
Start protection of your profits from lower levels
Disclosure: I am part of Trade Nation's Influencer program and receive a monthly fee for using their TradingView charts in my analysis.
❤️ Please, support our work with like & comment! ❤️

EURUSD 16 June – Technical Rebound or Liquidity Trap? EURUSD 16 June – Technical Rebound or Liquidity Trap?
The EURUSD pair has shown sharp movements after testing key resistance near 1.1607. While the price action may appear bullish at first glance, deeper analysis suggests we might be facing either a continuation of the uptrend or a strategic liquidity hunt.
🌍 Macro & Fundamental Overview
The ECB remains hawkish with rates still high, but recent commentary hints at a more dovish tone possibly leading to rate cuts in late Q3 2025.
Meanwhile, the Federal Reserve maintains its cautious stance, holding off on rate cuts due to sticky core inflation.
This divergence in policy expectations creates a neutral to slightly USD-favorable bias, depending on upcoming economic data.
⏳ Bottom line: EURUSD remains in a choppy environment with compression–expansion cycles, and no confirmed macro-driven trend yet.
📉 Technical Outlook (H1 Chart)
Price Structure: The pair is moving within a short-term ascending channel, but current price is testing the upper boundary.
EMA Analysis (13/34/89/200): Still supports an uptrend, but flattening out — potential bearish crossover if price fails to hold.
Key Resistance:
1.1607: Major resistance and local top (double rejection zone).
Critical Support Zones:
1.15540: Minor structural support — a decisive level for intraday direction.
1.15261 & 1.14807: Unfilled FVG zones and liquidity pools that may get targeted if the price breaks lower.
🎯 Trade Setup Ideas
📘 Scenario A – BUY from 1.15540 support (bullish continuation)
Entry: 1.15540 (upon bullish candle confirmation or strong bounce)
Stop Loss: 1.15200
Take Profits: 1.15850 → 1.16070 → 1.16300+
✅ Ideal if European sentiment remains positive or if USD weakens across the board.
📕 Scenario B – SELL if price breaks and retests 1.15540
Entry: 1.15540 (after a breakdown + rejection retest)
Stop Loss: 1.15720
Take Profits: 1.15261 → 1.14807 → possibly 1.1450
✅ Best used if USD gains strength or EUR shows weakness after economic releases.
🧠 Market Psychology
The market is currently reactive to any shift in tone from ECB and Fed, causing price whipsaws near key zones.
Smart traders will avoid chasing breakouts and instead focus on reaction zones like 1.15540 for confirmation-based trades.
Watch for fakeouts, as institutional players may be hunting liquidity before choosing direction.
📌 Final Thoughts
EURUSD is in a sensitive zone, and 1.15540 is the intraday pivot. Holding above could trigger a push toward 1.1607 and higher. But failure to hold would likely attract sellers toward the 1.1480–1.1450 liquidity range.
🎯 Discipline is key. Avoid emotional entries. Let the market come to your level — and execute only with confirmation.

EurUsd Daily Profile and expectation for New YorkMy Monday Protocol normally is to sit on my hands and see how Monday prints and trade from Tuesday onwards. With FOMC coming Wednesday, I'm allowed to deviate from this because Monday can be trending to "get somewhere in a hurry", trap Traders and go the other way during FOMC.
When I now look at the Market I see that London kept Asia Lows in tact and expanded higher leaving Failure Swings. Now consolidating which is normally a continuation signature... But then it should first sweep the consolidation Low and make a Reversal Signature. When we sweep or run the Consolidation High first, then the Long idea is not valid anymore.
Im watching the FVG below and see how we trade there and then decide if a Long is in play... I don't want to lose the Equilibruim Level of London Session otherwise the Failure Swings below the Market are the target.
Bottom Line, no hard Bias because its Monday. Favoring the Bullish side with FOMC on the Agenda this week, but not in a hurry to trade.
Hope you appreciate my content 👍
Happy Hunting, Stay Safe!
Warm Regards,
Mariinus

Bullish continuation?The Fiber (EUR/USD) is falling towards the pivot which acts as a pullback support and could bounce to the 1st resistance that lines up with the 127.2% Fibonacci resistance.
Pivot: 1.1447
1st Support: 1.1210
1st Resistance: 1.1712
Risk Warning:
Trading Forex and CFDs carries a high level of risk to your capital and you should only trade with money you can afford to lose. Trading Forex and CFDs may not be suitable for all investors, so please ensure that you fully understand the risks involved and seek independent advice if necessary.
Disclaimer:
The above opinions given constitute general market commentary, and do not constitute the opinion or advice of IC Markets or any form of personal or investment advice.
Any opinions, news, research, analyses, prices, other information, or links to third-party sites contained on this website are provided on an "as-is" basis, are intended only to be informative, is not an advice nor a recommendation, nor research, or a record of our trading prices, or an offer of, or solicitation for a transaction in any financial instrument and thus should not be treated as such. The information provided does not involve any specific investment objectives, financial situation and needs of any specific person who may receive it. Please be aware, that past performance is not a reliable indicator of future performance and/or results. Past Performance or Forward-looking scenarios based upon the reasonable beliefs of the third-party provider are not a guarantee of future performance. Actual results may differ materially from those anticipated in forward-looking or past performance statements. IC Markets makes no representation or warranty and assumes no liability as to the accuracy or completeness of the information provided, nor any loss arising from any investment based on a recommendation, forecast or any information supplied by any third-party.
