EURGBP: Bearish Wave is Coming 🇪🇺🇬🇧
After the yesterday's pullback, EURGBP reached a wide horizontal zone of supply.
0.873 - 0.8765 is the area from where the next bearish move will most likely initiate.
The next goal for the sellers will be 0.866
Because the underlined area is quite wide, look for an intraday confirmation before you sell.
❤️Please, support my work with like, thank you!❤️
Eur-gbp

EUR GBP - FUNDAMENTAL ANALYSISMonetary Policy: A Hawkish Stance?
The BoE's impending monetary policy decision is a critical factor underpinning Sterling's performance.
The analysts' consensus is that the BoE will adopt a hawkish stance, with a 25 basis point hike in the bank rate. This move would bring the bank rate to 4.50%, in line with market expectations.
"We expect the BoE to hike the Bank Rate by 25bp bringing it to 4.50%, which is fully priced by markets," says Kirstine Kundby-Nielsen, Analyst, FX Strategy at Danskebank.
She adds, "In our base case of a 25bp hike, we expect the reaction in EUR/GBP to be rather muted on the release but move slightly higher during the press conference."
Similarly, Valentin Marinov, Head of G10 FX Strategy at Credit Agricole, also foresees a rate hike.
However, he points out that the Monetary Policy Committee (MPC) may remain divided over the need for further aggressive hikes.
"We expect that the MPC will deliver a 25bp rate hike today to lift the bank rate to 4.50% but think it will remain divided on the need for further aggressive hikes," says Marinov.
Rate Hike Cycle: Nearing its Peak?
Another hotly debated topic among analysts is the trajectory of the BoE's rate hike cycle. While some believe that the current cycle is nearing its peak, others argue for its continuation, contingent on the data.
ING Economics' FX Strategist, Francesco Pesole, suggests that the BoE might be close to hitting the peak in its rate hike cycle.
He cites the primary drivers of inflation, namely food prices and core goods inflation, as temporary phenomena and expects a rapid deceleration in CPI later this year.
"Today’s 25bp hike may well be the last one in this cycle," says Pesole.
"The drivers of higher-than-projected inflation have primarily been food prices and some surprising stickiness in core goods inflation: neither of those trends look likely to be long-lasting," he adds.
On the other hand, Danskebank's Kundby-Nielsen anticipates that the BoE will communicate a 'pause' in its hiking cycle to fully assess the impact of previous rate increases.
However, she highlights that this decision will be heavily data-dependent.
"In its statement we expect the BoE to prime markets for a pause in the hiking cycle as the central bank wants to fully evaluate the effect from previous Bank Rate increases before deciding on next steps," says Kundby-Nielsen.
"However, as always, all future decisions will be data-dependent," she adds.
Outlook for the Pound Sterling: Where Next?
The impending BoE decision is also expected to have significant ramifications for the sterling.
While the overall outlook appears cautiously optimistic, the currency's fate is contingent on multiple factors, including the BoE's future monetary policy stance and the pace of economic recovery.
MUFG's Senior Currency Analyst, Lee Hardman, observes the sterling trading close to its year-to-date highs ahead of the BoE meeting.
The strengthening of the sterling, particularly against the euro, reflects the fading investor pessimism about the UK's economic outlook.
Hardman also notes the resilience of the UK economy and the persistent inflation and wage growth, which puts pressure on the BoE to maintain its rate hike cycle.
"The pound is continuing to trade close to year-to-date highs ahead of today’s BoE policy meeting," says Hardman.
"The resilience of the UK economy at the start of this year alongside still uncomfortably strong inflation and wage growth keeps pressure on the BoE to keep raising rates," he adds.
Francesco Pesole of ING Economics also discusses the sterling's recent strength, attributing it in part to aggressive market expectations of BoE tightening. However, he believes that these hawkish expectations may be excessive and could be scaled back.
"We acknowledge that part of GBP’s recent strength has been due to the market’s aggressive expectations about BoE tightening, and therefore recognise there are downside risks as those (excessive, in our view) hawkish expectations are scaled back," says Pesole.
BoE's Forward Guidance and Sterling's Reaction
Much of the sterling's reaction post-BoE decision would depend on the central bank's forward guidance. Tullia Bucco, Economist at UniCredit Bank, anticipates that the BoE will likely maintain a data-dependent approach without offering explicit rate guidance, leaving the sterling's performance hanging in the balance.
"A 25bp rate hike to 4.50% is expected, and sterling’s reaction will therefore likely mostly depend on the message that BoE Governor Bailey conveys in his press conference," says Bucco.
"The risk is that no rate guidance will be delivered today, with the BoE stressing that further rate decisions remain data dependent, which might not offer sterling much support either," she adds.
Nikesh Sawjani, Economist at Lloyds Bank, highlights that the 25bps rise would make it the twelfth consecutive hike in the current cycle which began in December 2021.
The cumulative tightening since then would total 440bp. Sawjani draws attention to the fact that current CPI inflation is much stronger than the BoE had anticipated, with March's headline CPI at a substantial 10.1%, notably above the BoE staff forecast of 9.2%.
Sawjani also anticipates an upward revision of GDP forecasts, backed by possible GDP growth in Q1 and survey evidence of improved economic confidence and activity at the start of Q2. Additionally, he expects that fiscal measures from the March Budget and lower-than-assumed energy prices will likely support real incomes, further bolstering GDP.
"New BoE economic forecasts will provide an update on the medium-term growth and inflation outlook," says Sawjani. "Overall, it seems likely that GDP forecasts will be revised higher. All else being equal, that would lead to a higher medium-term inflation profile although not sufficiently to prevent an undershoot of the 2% target in 2024 and 2025," he adds.

EURGBP Potential DownsidesHey Traders, in today's trading session we are monitoring EURGBP for a selling opportunity around 0.87100 zone, EURGBP is trading in a downtrend and currently seems to be in a correction phase in which it is approaching the major trend at 0.871 support and resistance zone.
Trade safe, Joe.

EURGBP - Trend-Following Buy Setup! ↗️Hello TradingView Family / Fellow Traders. This is Richard, also known as theSignalyst.
EURGBP is still overall bullish trading inside the rising broadening wedge in brown.
Moreover, the zone 0.87 is a support zone .
🏹 So the highlighted purple circle is a strong area to look for buy setups as it is the intersection of the green support and lower brown trendline.
As per my trading style:
As EURGBP is sitting around the purple circle zone, I will be looking for bullish reversal setups (like a double bottom pattern, trendline break , and so on...)
📚 Always follow your trading plan regarding entry, risk management, and trade management.
Good luck!
All Strategies Are Good; If Managed Properly!
~Rich

EURGBP Potential DownsidesHey Traders, in today's trading session we are monitoring EURGBP for a selling opportunity around 0.87700 zone, EURGBP was trading in an uptrend and managed to break it out. in the current moment we'll be monitoring a potential retrace of the trend from 0.877 support and resistance zone towards more lows.
Trade safe, Joe.

EURGBPPotential ABC zig zag spotted. Looking for 20% min (fibonacci tool). Looking for entry on candle close if color stays same. Not advice.

EURGBP - Swing TargetsEUR/GBP Swing Targets
Based on the analysis conducted my internal algorithm, there is a primarily bearish trend detected in the EUR/GBP pair.
Swing targets have been identified and are indicated on the chart.

EURGBP Potential UpsidesHey Traders, in today's trading session we are monitoring EURGBP for a buying opportunity around 0.882 zone, EURGBP is trading in an uptrend and currently seems to be in a correction phase in which it is approaching the major trend at 0.882 support and resistance zone.
Trade safe, Joe.

EURGBP Potential UpsidesHey Traders, in today's trading session we are monitoring EURGBP for a buying opportunity around 0.88200 zone, EURGBP is trading in an uptrend and now seems to be in a correction phase in which it is approaching the major trend at 0.882 Support and resistance zone so we will be how the price action there will be for a potential reversal.
Trade safe, Joe.

EURGBP Potential UpsidesHey Traders, in the coming week we are monitoring EURGBP for a buying opportunity around 0.88000 zone, EURGBP is trading in an uptrend and now seems to be in a correction phase in which it is approaching the major trend at 0.88000 support and resistance zone.
Trade safe, Joe.

EURGBP Near a buy break-out signalThe EURGBP pair is testing the top (Lower Highs trend-line) of a short-term Channel Down inside a 1 year Channel Up pattern. The previous two such patterns gave a buy signal when a 1D candle close above them. If that happens, we will buy and target Resistance 1 (0.89800). Our trading plan involves selling at the top of the Channel Up (Higher Highs trend-line) if a 1D candle closes below it and target 0.88000 (the 1D MA200) and buy if a 1D candle closes above it (target Resistance 2 at 0.92800).
-------------------------------------------------------------------------------
** Please LIKE 👍, FOLLOW ✅, SHARE 🙌 and COMMENT ✍ if you enjoy this idea! Also share your ideas and charts in the comments section below! **
-------------------------------------------------------------------------------
💸💸💸💸💸💸
👇 👇 👇 👇 👇 👇

EURGBP Outlook 21 April 2023The EURGBP trades within an ascending triangle toward the 0.8824 resistance level.
This upward move follows the rejection of the 50% Fibonacci retracement level from the longer-term upward move.
Look for a breakout to the upside with the price needing to trade beyond the 0.8830 price level which coincides with the 50% Fibonacci retracement level from the recent downward move.
A breakout to the upside could be driven by further weakness in the GBPUSD, which could see the EURGBP retest the key resistance level of 0.8860.

EURGBP: Preparing a strong rebound.The EURGBP pair is currently on the 1D MA50, trading inside a long term Channel Up for more than 1 year. The 1D technicals are neutral (RSi = 51.179, MACD = 0.000, ADX = 27.770) meaning that this level is gradually turning into a buy opportunity inside the Channel Up. Every rally made at least a 5.00% rise, so we are targeting the top of the Channel (TP = 0.91250).
Prior idea:
## If you like our free content follow our profile to get more daily ideas. ##
## Comments and likes are greatly appreciated. ##

EURGBP Potential UpsidesHey Traders, in today's trading session we are monitoring EURGBP for a buying opportunity around 0.87500 zone, EURGBP is trading in an uptrend and now seems to be in an uptrend in which it is approaching the major trend at 0.87500 support zone, once bulls are confirmed i would consider 0.88500 as a target as it's considered the next major resistance zone EURGBP will be facing.
Trade safe, Joe.

EurGbp SmC Setupfollo the levels EUR/GBP bears are back in the race during early Monday as the quote drops to 0.8845 amid the initial hours of the European session, after being absent in the last four days.
In doing so, the cross-currency pair retreats from a three-week high while snapping a four-day winning streak.
That said, a downward-sloping resistance line from early February, around 0.8860 by the press time, triggers the latest pullback in the EUR/GBP prices. However, the pair’s downside appears limited as the 50-DMA level of 0.8823 puts a short-term floor under the price.
Following that, a fortnight-long ascending support line near 0.8790 can check the EUR/GBP bears before directing them to the key trend line support stretched from December 19, 2022, around 0.8730 at the latest.

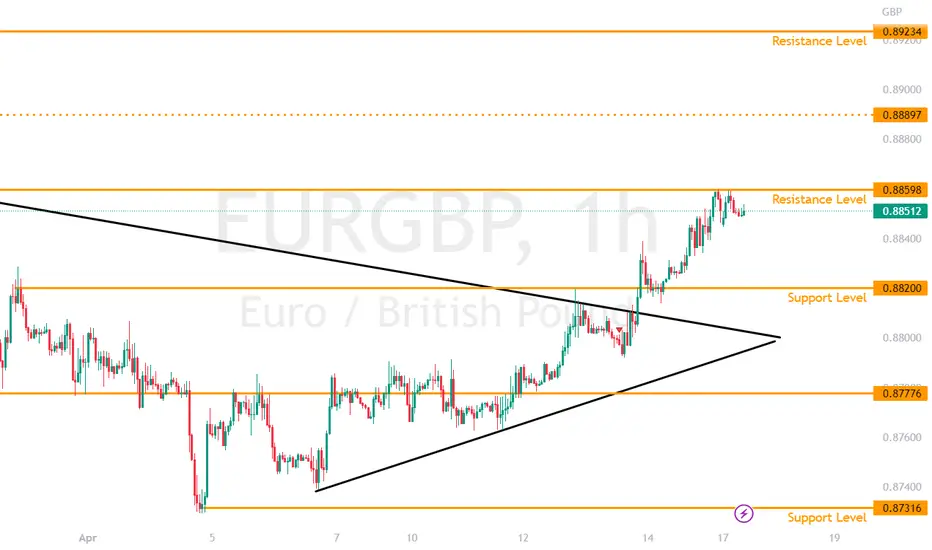
EURGBP Outlook 17 April 2023The EURGBP broke out of the triangle and beyond the 0.8820 price level to trade significantly higher as the price was driven by a weakening of the GBPUSD.
Currently, the EURGBP consolidates just under the immediate resistance level of 0.8860, with a confirmation of further upside potential if the price breaks above the resistance level.
Beyond 0.8860, the next key resistance level is at 0.8925, with interim resistance at 0.8890.
EURGBP Potential downsidesHey Traders, in tomorrow's trading session we are monitoring EURGBP for a selling opportunity around 0.88600 zone, EURGBP is trading in a downtrend and now seems to be in a correction phase in which it is approaching the major trend at 0.886 resistance zone. once bears are confirmed i would consider 0.875 zone as a target as it's considered the next major support area EURGBP will be facing.
Trade safe, Joe.

EURGBP on a confluence test 🦐EURGBP on the 4h chart after the test of the daily support at the 0.87400 area has created an impulse that broke the previous lower highs of the downtrend.
The price moved again at the weekly structure below a daily descending trendline and retest it a few times.
I will wait for a potential break of the structure and IF the price will break above i will set a nice long order according to the Plancton's strategy rules.

EURGBP | Bullish Signal!Based on the current market analysis, it appears that EURGBP is showing a potential bullish signal. The Average True Range (ATR) is currently positive, indicating that the market is experiencing volatility, which can provide opportunities for traders to profit.
In addition, the Moving Average (MA) and other Technical Analysis (TA) tools suggest that the pair has a potential upward momentum. These technical indicators can be used as supporting evidence to confirm the bullish sentiment for EURGBP.
Overall, the positive ATR, along with the bullish signals from MA and TA, indicate that there may be an opportunity to profit from a long position in EURGBP. However, it is important to always be aware of the risks involved in trading and to use appropriate risk management strategies.

EURGBP Breakout and Potential retraceHey Traders, in today's trading session we are monitoring EURGBP for a buying opportunity around 0.87900 zone, EURGBP was trading in a downtrend and successfully managed to break it out. We will wait for a correction and then monitor the price action for a potential retrace of the trend at 0.87900.
Trade safe, Joe.

EURGBP Bullish signalEURGBP is trading inside a Triangle with its bottom being Support (1).
This Support held on April 4th and the pair is rebounding.
Today's pullback gives another buy opportunity.
Trading Plan:
1. Buy for as long as the price is closing over Support (1).
Targets:
1. 0.88225 (under the MA50 (1d) and within a +1.10% rise and Fibonacci 0.382). Each of the Triangle's previous Highs broke over a Fibonacci level.
Tips:
1. The RSI (1d) is under a 2 month Falling Support. Keep an eye for the long term. A crossing over it, may signal a long term bullish breakout over the Triangle.
Please like, follow and comment!!

EURGBP feels a need of a correction before potential upsidesHey Traders, in the coming week we are monitoring EURGBP for a buying opportunity around 0.874 zone, EURGBP is trading in an uptrend and now seems to be in a correction phase in which it is approaching the major trend at 0.874 support zone. once bulls are confirmed the first target would be 0.88 before hitting more highs.
Trade safe, Joe.

EURGBP Weekly forecast to compare GbpUsd hello traders EurGbp is in a nice clear downtrend comparing it with it inverse pair Gbpusd is one way to trade this pairs together adding with dxy is one way of trading this pairs .
