Eur-gbp
EURGBP about to lift offAfter price broke structure with momentum, it left behind a huge imbalance and a clean POI. Price used supply to retrace back to mitigate the POI and is looking to take out trendline liquidity at the same time. Our overall orderflow is currently bullish, so area is a good place to join in on the ride to the upside.

EURGBP bounce on zone?
Hi viewers, EURGBP bounce from zone expected
TP1: 0.87500 (60)
TP2: 0.87200 (90)

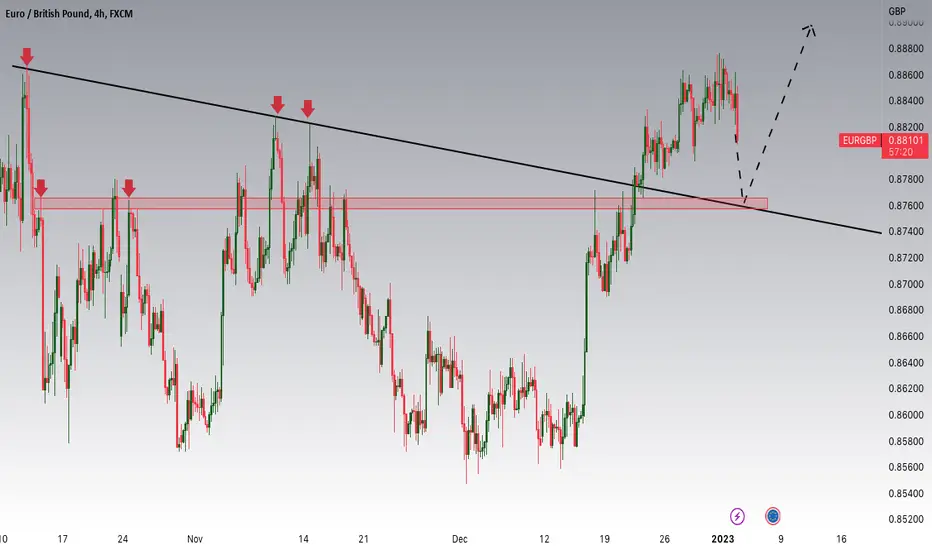
EURGBP can retest the high? 🦐EURGBP on the 4h chart after the recent high retraced perfectly at the 0.786 Fibonacci level over a daily support.
The price is now testing the resistance below the 0.88 level and a possible break above can be seen.
How can i approach this scenario?
I will wait for the EU market open and IF the market will move above the structure i will consider a nice long order according to the Plancton's strategy rules.
–––––
Follow the Shrimp 🦐
Keep in mind.
🟣 Purple structure -> Monthly structure.
🔴 Red structure -> Weekly structure.
🔵 Blue structure -> Daily structure.
🟡 Yellow structure -> 4h structure.
⚫️ Black structure -> <4h structure.
Here is the Plancton0618 technical analysis , please comment below if you have any question.
The ENTRY in the market will be taken only if the condition of the Plancton0618 strategy will trigger.

EURGBP Potential for Bullish Continuation towards recent swing hLooking at the H4 chart, my overall bias for EURGBP is bullish due to the current price crossing above the Ichimoku cloud, indicating a bullish market structure. Looking for a pullback buy entry at 0.87952, where the overlap support and 38.2% Fibonacci line s. Stop loss will be at 0.87219, where the recent swing low is. Take profit will be at 0.88970, where the previous swing high was.
Please be advised that the information presented on TradingView is provided to Vantage (‘Vantage Global Limited’, ‘we’) by a third-party provider (‘Everest Fortune Group’). Please be reminded that you are solely responsible for the trading decisions on your account. There is a very high degree of risk involved in trading. Any information and/or content is intended entirely for research, educational and informational purposes only and does not constitute investment or consultation advice or investment strategy. The information is not tailored to the investment needs of any specific person and therefore does not involve a consideration of any of the investment objectives, financial situation or needs of any viewer that may receive it. Kindly also note that past performance is not a reliable indicator of future results. Actual results may differ materially from those anticipated in forward-looking or past performance statements. We assume no liability as to the accuracy or completeness of any of the information and/or content provided herein and the Company cannot be held responsible for any omission, mistake nor for any loss or damage including without limitation to any loss of profit which may arise from reliance on any information supplied by Everest Fortune Group.

EURGBP Potential for Bullish ContinuationLooking at the H4 chart, my overall bias for EURGBP is bullish due to the current price crossing above the Ichimoku cloud, indicating a bullish market structure. Looking for a pullback buy entry at 0.87952, where the overlap support and 38.2% Fibonacci line s. Stop loss will be at 0.87219, where the recent swing low is. Take profit will be at 0.88974, where the previous swing high was.
Please be advised that the information presented on TradingView is provided to Vantage (‘Vantage Global Limited’, ‘we’) by a third-party provider (‘Everest Fortune Group’). Please be reminded that you are solely responsible for the trading decisions on your account. There is a very high degree of risk involved in trading. Any information and/or content is intended entirely for research, educational and informational purposes only and does not constitute investment or consultation advice or investment strategy. The information is not tailored to the investment needs of any specific person and therefore does not involve a consideration of any of the investment objectives, financial situation or needs of any viewer that may receive it. Kindly also note that past performance is not a reliable indicator of future results. Actual results may differ materially from those anticipated in forward-looking or past performance statements. We assume no liability as to the accuracy or completeness of any of the information and/or content provided herein and the Company cannot be held responsible for any omission, mistake nor for any loss or damage including without limitation to any loss of profit which may arise from reliance on any information supplied by Everest Fortune Group.

EURGBP for a possible lift offAfter price tapped into higher timeframe POI, it broke structure and gave us a change of character in lower timeframe. The break in structure was of high momentum such that it left behind an imbalance with a clean POI. Price was consolidating before the expansion that broke structure, and has now retraced back to that area for one more mitigation before continuing up to fill higher timeframe imbalance and to take out equal long term highs.

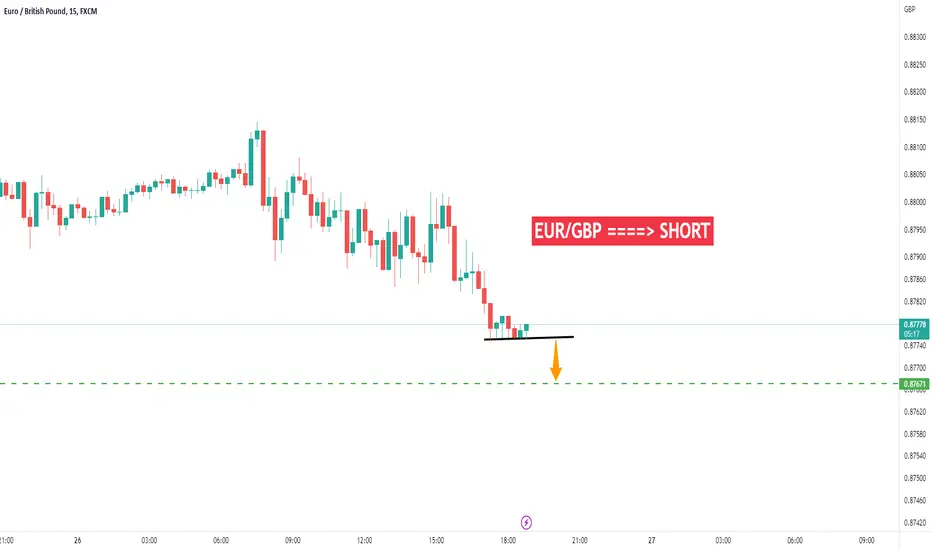
EurgbpEurGbp formed rising Wedge Rsi Printed Massive bearish Divergence Too
Incase Of Breakout Expecting 150 to 180 Pips Bearish Move


EURGBP still bullish expctations
Hi viewers, EURGBP we are bullish from December, still bullish expectations technically look.
TP1: 0.89730 (100)
TP2: 0.90130 (140)
TP2: 0.90530 (180)

ERUGBP 16 Jan Pair : EURGBP ( Euro / British Pound )
Description :
Rising Wedge in Short Time Frame and Completed the Breakout of the Lower Trend Line and Completed the Retracement
Completed the Corrective " ABC " Wave and " 12 " Impulsive Wave
Selling Divergence
Head and Shoulder if Reject from this Resistance then Long Term Sell
Fibonacci Level - 61.80%

EURGBP looking up 🦐EURGBP on the 4h chart after the uptrend impulse reached the 0.88600 area.
The market started a distribution phase where it tested the upper resistance and lower support a few times without breaking it.
The price then moved to the lower demand where it took the liquidity to create the impulse to the upside with a break of the previous range followed by a retest of the previous resistance now turn support.
How can i approach this scenario?
If the price will break the minor resistance i will consider a nice long order according to the Plancton's strategy rules.
–––––
Follow the Shrimp 🦐
Keep in mind.
🟣 Purple structure -> Monthly structure.
🔴 Red structure -> Weekly structure.
🔵 Blue structure -> Daily structure.
🟡 Yellow structure -> 4h structure.
⚫️ Black structure -> <4h structure.
Here is the Plancton0618 technical analysis , please comment below if you have any question.
The ENTRY in the market will be taken only if the condition of the Plancton0618 strategy will trigger.

EURGBP - Long- Rejection at support (previous resistance, 0.8850 level)
- Overall bullish trend
- Could see price return to highs of 0.8980

EURGBPPrice has Brocken above the descending channel and retested the bearish trendline, we expect price to continue bullish

EURGBP Targeting 0.9?Hey traders, in tomorrow's trading session we are monitoring EURGBP for a buying opportunity around 0.884 zone, once we will receive any bullish confirmation the trade will be executed.
Trade safe, Joe.

EURGBP - Interesting! EURGBP - Interesting!
Break above there's nice target areas of .98300 - .90000 areas
Stops below .87500 areas
Best,
TJ

EUR/GBP- Range set up Hi,
I will be entering the EUR/GBP breakout trade. The price has been trapped in a. range for over two weeks and we have finally seen a break to the upside.
GL if you join

EURGBP:Breakout and potential retrace along with a weak GBP Hey Traders, in today's trading session we are monitoring EURGBP for a buying opportunity around 0.886 zone, once we will receive any bullish confirmation the trade will be executed.
Trade safe, Joe.

EURGBP can move lower? 🦐EURGBP on the 4h chart after the uptrend impulse reached the 0.88600 area.
The market started a distribution phase where it tested the upper resistance and lower support a few times without breaking it.
Being at the top of an impulse I would expect some retracement to the fair value.
The main trend remains anyway bullish so we will need a clear break of the support + the trigger of Plancton's strategy in order to consider a short position to the next support area.
–––––
Follow the Shrimp 🦐
Keep in mind.
🟣 Purple structure -> Monthly structure.
🔴 Red structure -> Weekly structure.
🔵 Blue structure -> Daily structure.
🟡 Yellow structure -> 4h structure.
⚫️ Black structure -> <4h structure.
Here is the Plancton0618 technical analysis , please comment below if you have any question.
The ENTRY in the market will be taken only if the condition of the Plancton0618 strategy will trigger.

eurgbpeurgbp
strong sell from 2 zone
It is located in the expensive area, and after the last failure, I imagine that there is a possibility of a big fall for it from two areas of Order Block.

💶💷 EUR/GBP Attention We Are Falling 💶💷💶💷 EUR/GBP Attention We Are Falling
💶💷 Nearest strong support zone: around fibo 0.5 level (0.8740).
💶💷 Nearest strong resistance zone: Surrounding fibo level 0.382 (0.8870).
💶💷 Technical environment:
- Moving averages: Uptrend
- MACD: Downtrend
- RSI: Uptrend
- Supertrend: Uptrend
💶💷 Price action: EUR/GBP in Friday's session scored a strong price slide, the candle turned into a shooting star, and the upward correction established its peak near the 0.382 level of the entire upward wave, the technical environment looking at the indicators of technical analysis are still undecided to the direction, but looking at the formations there is a good chance to score a new downward wave. We still have some space to the nearest support zone so I recommend watching the behavior of the price.
💶💷 The scenario I play out is to observe how the price will behave and whether it will continue to fall from current levels. I don't exclude the possibility of changing the scenario if the market situation changes abruptly. I'm aware of the possibility of a correction at any time, this should be taken into account, If the outlook changes I will publish a post with an update, so I encourage you to actively follow the profile and read the description carefully.
🚀 If you appreciate my work and effort put into this post then I encourage you to leave a like and give a follow on my profile. 🚀

EURGBP:Breakout and potential retrace along with a weak GBP Hey traders, in today's trading session we are monitoring EURGBP for a buying opportunity around 0.875 zone, once we will receive any bullish confirmation the trade will be executed.
Trade safe, Joe.

EURGBP LongHey traders, in this week we are monitoring EURGBP for a buying opportunity around 0.876 zone, once we will receive any bullish confirmation the trade will be executed.
Trade safe, Joe.