New York Watchlist: EURNOK Sell EURNOK SELL
ENTRY 10.1580 /// MODERATE 10%
SL 10.17915 ( pips 221 )
TP 10.08605 ( pips 709 / RR 3.2 )
On 4H we have a solid contraction and we are pretty much at the top of it. RSI is at its highs too.
On 1H we have a minor contraction supportin the sell idea with a decent rejection level.
On the minute charts I see a reversal coming within this hour (in the next 50mins)
EUR-NOK

USDCAD WEEKLY Quick analysis of the USDCAD Weekly shows we are in a neutral state attempting and respecting the ascending triangle. Let me know what you think

EURNOK: Buy opportunity on 1D MACD.The pair is trading within a long term 1M Channel Up (RSI = 53.878, MACD = 0.135, ADX = 43.274, Highs/Lows = 0.0000) since Q4 of 2017. At the moment the price seems to have found Support around the 1D MA200 (orange line) and withi the 1D MACD making a bullish cross over, is expected to rise.
According to a similar fractal in January 2018, the High of that spike could be around the 0.618 Fibonacci retracement level. We place our Target at 10.0700.
** If you like our free content follow our profile (www.tradingview.com) to get more daily ideas. **
Comments and likes are greatly appreciated.

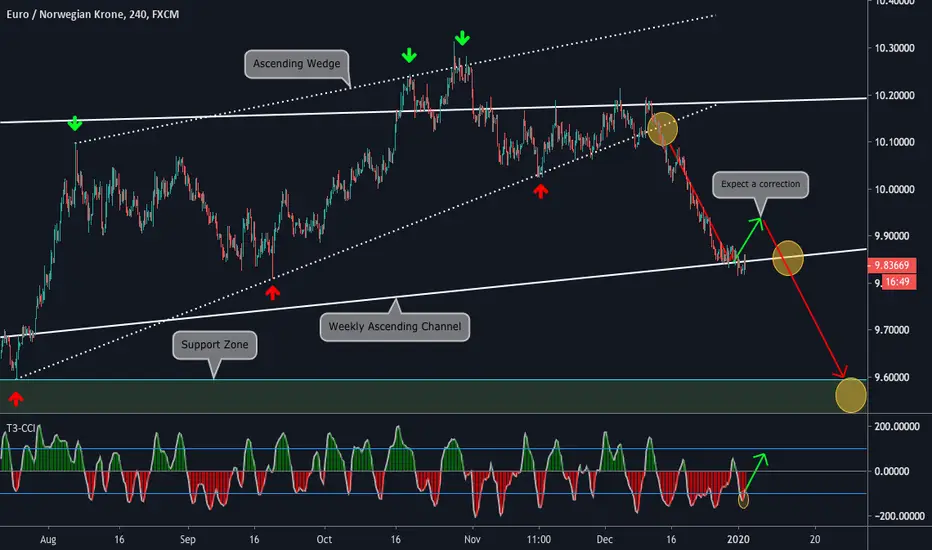
"EURNOK: first target reached" by ThinkingAntsOk4H Chart Explanation:
- Price was on a Ascending Wedge.
- It moved down towards the Weekly Ascending Channel after the wedge was broken.
- Bullish CCI could be indicating a correction.
- If price breaks the Ascending Channel, it has potential to move down towards the Support Zone.
Daily Vision:
Weekly Vision:
EURNOK Neutral TakeWill be using both Key Resistance and Support to enter the market, if price fails to enter any region and include a confident reason to enter, then we will not enter.


EURNOK Short IdeaLast week finally closed out with a breakout of Price is Major Uptrend Channel. Will be waiting for an exhaustion after price plummets bearish, Fibonacci retracement and Extension will be key in this trading idea with the 38% lining up with our retest of breakout trendline and showing a major continuation in bearish trend.

EURNOK Buy SignalPattern: 1W Rising Wedge.
Signal: Bullish as the price made a Higher Low and bounced on the 1D MA50.
Target: 10.300 and 10.400 in extension (greater risk though as the 1D RSI is on a bearish divergence).

EURNOK: Buy opportunity on the Rising Wedge.The pair is trading within a 1W Rising Wedge (RSI = 59.298, MACD = 0.080, Highs/Lows = 0.0000). Yesterday not only it made contact with the Higher Low trend line, but also touched the 1D MA50 (blue line). This indicates that the price has more probabilities to rebound towards a new Higher High. Our Target Zone is 10.400 - 10.500.
** If you like our free content follow our profile (www.tradingview.com) to get more daily ideas. **
Comments and likes are greatly appreciated.

EURNOK HEAD AND SHOULDERS - BEARISHWaiting for price to break both the Head and Shoulders Pattern and more Importantly the Ascending Channel, this Advanced pattern is invalid if price doesn't continue to break below this Parallel Channel. There's a chance price can Respect its channel and the market will Reverse Bullish, that is why it is so important we let price work its course and we will enter when price is showing us a continuation (Candle Sticks).

EURNOK Closing triangle maintained for past 13 years can build a very good short position for the coming years but if it fails to break the resistance line it will go long for the coming years again. brace yourselves.

EUR/NOK long term shortThe pair is at historical highs with RSI showing bearish divergence.
EUR/NOK is also forming a bearish triangle which will initiate the long term downtrend.
EUR area is looking to cut interest rates or prolong the QE program. NOK has (the biggest?) sovereign wealthfund which will prove useful if Norway needs fiscal stimulus.
short EUR/NOK also provides a carry. Therefor this is a small carry trade, not like EUR/TRY.

SHORT VISION ON EUR/NOK FULLY EXPLAINED4H CHART EXPLANATION:
In the short term, we observe a Descending Wedge Pattern being formed by the last downtrend. Now we are waiting for a pullback towards the Confluence Zone between the Top of the Wedge Pattern and the Broken Ascending Trendline, and after that a bounce to continue the downside move. This is the short term vision, the mid and long term are explained below on the Daily and Weekly Timeframes.
MULTI TIMEFRAME VISION:
-Daily:
-Weekly:

EURNOK: Possible bearish move.The pair is consolidating on 4H (RSI = 49.952) awaiting for a break out. 1D has followed a perfect symmetry so far on 1D (Inverse Head and Shoulders) and if the 1D MA50 breaks, we expect the price to test the 9.6450 Support.
** If you like our free content follow our profile (www.tradingview.com) to get more daily ideas. **
Comments and likes are greatly appreciated.

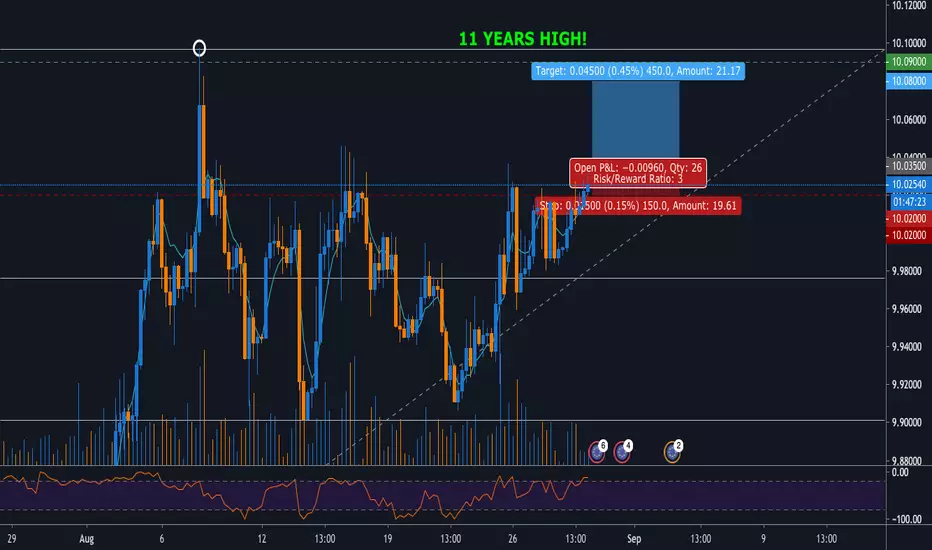
forexTrdr EURNOK- NOK THAT PAIR BACK DOWN FROM EXTREME LEVELSMorning traders,
This morning we have had the Swedish central bank come out and delay interest rate rises with market now pricing no rise until early 2020 (from mid 2019). This has had a secondary effect on the Norwegian Krona leading to a 700 pips drop versus the Euro. We are looking to capitalise on this move into extreme overbought territory and looking for a pull back into the previous trading range of 9.55 to 9.60.
The spike bounced off of resistance levels dating back to early 2019 and forming a descending trendline from previous high levels in April and early February as shown in our Trading View charts.
Simple clean trade on event driven news.
As always this is not a trade recommendation and simply technical observation.
Good luck trading
from the Team at forexTrdr
find us on instagram, twitter and Alexa flash briefings

Eur/Nok Swing Sell Hi All ,
Opening My 6th Swing Trade on this pair .
Price broke down major support level on M1 . Wait for the retest of previous Resistance turned support and enter your swing sell position .
For more information , Please contact me .
Many Thanks.


EUR/NOK 1H Chart: Bullish momentum prevailsThe Euro has been appreciating against the Norwegian Krone since the the middle of October. This movement has been bounded in an ascending channel.
Given that the currency pair is supported by the 55-, 100– and 200-hour SMAs, it is likely that the rate continues to go up within the following trading sessions. Technical indicators for the 4H and 1D time frames also support bullish scenario. A potential target is the resistance cluster formed by a combination of the weekly R2, the monthly R1 and the Fibonacci 50.00% retracement located circa 9.6000.
It is the unlikely case that some bearish pressure still prevails in the market, the Euro should not exceed the weekly S2 at 9.4719.

EUR/NOK 1H Chart: Downside potentialThe Norwegian Krone has been appreciating against the Euro in a short-term descending channel. This movement began on September 7 when the pair reversed from the upper boundary of a long-term descending channel.
As apparent on the chart, the currency pair is pressured by the 55– and 100-hour SMAs. Most likely that the pair will continue to go down and will aim for the support level formed by a combination of the weekly S1 and the Fibonacci 100.00% retracement located circa 9.4100.
If given support level does not hold, it is likely that the exchange rate will continue to go downside to the weekly S2 at 3.3377.


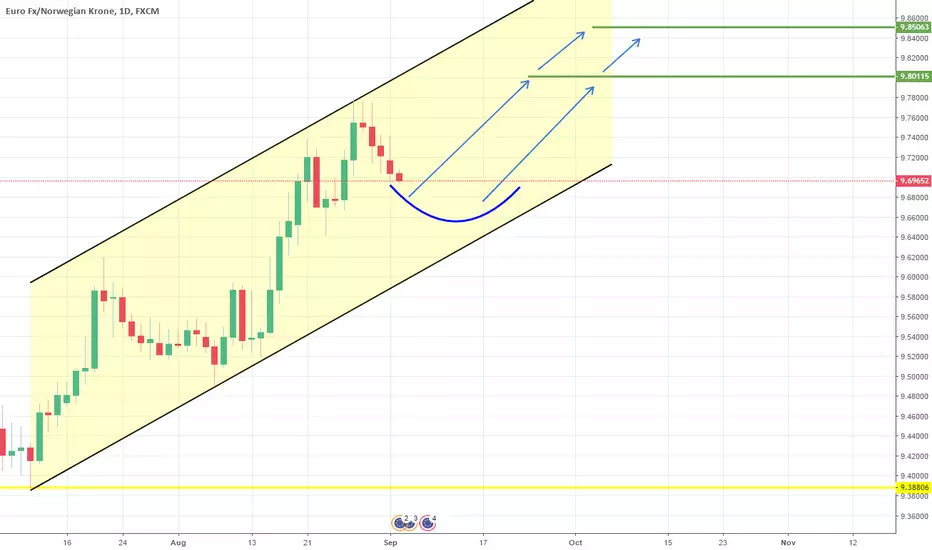
Pull back on 1D Channel Up. Long on Higher Low.EURNOK is trading on a 1D Channel Up (RSI = 57.905, MACD = 0.040, B/BP = 0.0035) that is pulling back to issue a new Higher Low. Given the neutral Highs/Lows = 0, this is close, so we will be going long with TP1 = 9.800 and TP2 = 9.8500 in extension.