Bullish bounce?The Fiber (EUR/USD) has bounced off the pivot and could rise to the 1st resistance.
Pivot: 1.1236
1st Support: 1.1147
1st Resistance: 1.1422
Risk Warning:
Trading Forex and CFDs carries a high level of risk to your capital and you should only trade with money you can afford to lose. Trading Forex and CFDs may not be suitable for all investors, so please ensure that you fully understand the risks involved and seek independent advice if necessary.
Disclaimer:
The above opinions given constitute general market commentary, and do not constitute the opinion or advice of IC Markets or any form of personal or investment advice.
Any opinions, news, research, analyses, prices, other information, or links to third-party sites contained on this website are provided on an "as-is" basis, are intended only to be informative, is not an advice nor a recommendation, nor research, or a record of our trading prices, or an offer of, or solicitation for a transaction in any financial instrument and thus should not be treated as such. The information provided does not involve any specific investment objectives, financial situation and needs of any specific person who may receive it. Please be aware, that past performance is not a reliable indicator of future performance and/or results. Past Performance or Forward-looking scenarios based upon the reasonable beliefs of the third-party provider are not a guarantee of future performance. Actual results may differ materially from those anticipated in forward-looking or past performance statements. IC Markets makes no representation or warranty and assumes no liability as to the accuracy or completeness of the information provided, nor any loss arising from any investment based on a recommendation, forecast or any information supplied by any third-party.
Eur-usd

EURUSD: 4H Death Cross to push Channel Down much lower.EURUSD has turned neutral on its 1D technical outlook (RSI = 54.499, MACD = 0.002, ADX = 31.600) as the price approaches the top of the 1 month Channel Down. A rejection and LH is expected soon that will initiate the new bearish wave. The last one was -4.45%, so that gives a TP = 1.0900, which falls right on the S1 level and the HL trendline from the February 3rd low. Keep in mind also that the market formed the first 4H Death Cross since February 10th.
## If you like our free content follow our profile to get more daily ideas. ##
## Comments and likes are greatly appreciated. ##

Bearish drop?The Fiber (EUR/USD) is rejecting off the pivot and could drop to the 1st support.
Pivot: 1.1273
1st Support: 1.1084
1st Resistance: 1.1371
Risk Warning:
Trading Forex and CFDs carries a high level of risk to your capital and you should only trade with money you can afford to lose. Trading Forex and CFDs may not be suitable for all investors, so please ensure that you fully understand the risks involved and seek independent advice if necessary.
Disclaimer:
The above opinions given constitute general market commentary, and do not constitute the opinion or advice of IC Markets or any form of personal or investment advice.
Any opinions, news, research, analyses, prices, other information, or links to third-party sites contained on this website are provided on an "as-is" basis, are intended only to be informative, is not an advice nor a recommendation, nor research, or a record of our trading prices, or an offer of, or solicitation for a transaction in any financial instrument and thus should not be treated as such. The information provided does not involve any specific investment objectives, financial situation and needs of any specific person who may receive it. Please be aware, that past performance is not a reliable indicator of future performance and/or results. Past Performance or Forward-looking scenarios based upon the reasonable beliefs of the third-party provider are not a guarantee of future performance. Actual results may differ materially from those anticipated in forward-looking or past performance statements. IC Markets makes no representation or warranty and assumes no liability as to the accuracy or completeness of the information provided, nor any loss arising from any investment based on a recommendation, forecast or any information supplied by any third-party.

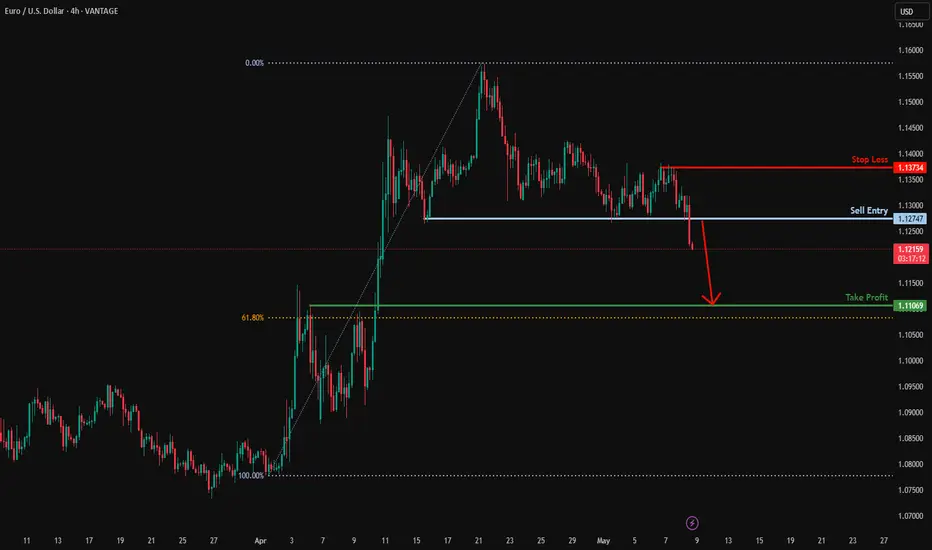
Potential bearish drop?EUR/USD is reacting off the resistance level which is an overlap resistance and could drop from this level to our take profit.
Entry: 1.1270
Why we like it:
There is an overlap resistance level.
Stop loss: 1.1374
Why we like it:
There is a pullback resistance level that lines up with the 61.8% Fibonacci retracement.
Take profit: 1.1139
Why we like it:
There is a pullback support level.
Enjoying your TradingView experience? Review us!
Please be advised that the information presented on TradingView is provided to Vantage (‘Vantage Global Limited’, ‘we’) by a third-party provider (‘Everest Fortune Group’). Please be reminded that you are solely responsible for the trading decisions on your account. There is a very high degree of risk involved in trading. Any information and/or content is intended entirely for research, educational and informational purposes only and does not constitute investment or consultation advice or investment strategy. The information is not tailored to the investment needs of any specific person and therefore does not involve a consideration of any of the investment objectives, financial situation or needs of any viewer that may receive it. Kindly also note that past performance is not a reliable indicator of future results. Actual results may differ materially from those anticipated in forward-looking or past performance statements. We assume no liability as to the accuracy or completeness of any of the information and/or content provided herein and the Company cannot be held responsible for any omission, mistake nor for any loss or damage including without limitation to any loss of profit which may arise from reliance on any information supplied by Everest Fortune Group.

EURUSD 1st 4H Death Cross after 7 months. Is it enough to short?The EURUSD pair just formed its first Death Cross on the 4H time-frame since October 04 2024. The last such formation signaled the bearish extension of the trend by breaking below its Higher Lows trend-line.
That was a similar Higher Lows trend-line the price rebounded on on May 12, exactly on the 1D MA50 (red trend-line). With the 1D RSI on levels similar with that previous Death Cross, we will wait for confirmation before shorting again and the price to break is the Higher Low/ 1D MA50 Cluster.
If broken, our Target will be just above the 0.618 Fibonacci from the bottom at 1.07350.
-------------------------------------------------------------------------------
** Please LIKE 👍, FOLLOW ✅, SHARE 🙌 and COMMENT ✍ if you enjoy this idea! Also share your ideas and charts in the comments section below! This is best way to keep it relevant, support us, keep the content here free and allow the idea to reach as many people as possible. **
-------------------------------------------------------------------------------
Disclosure: I am part of Trade Nation's Influencer program and receive a monthly fee for using their TradingView charts in my analysis.
💸💸💸💸💸💸
👇 👇 👇 👇 👇 👇

EUR/USD DAILY PLAN – BREAKOUT CONFIRMATION OR FAKEOUT TRAP?EUR/USD DAILY PLAN – BREAKOUT CONFIRMATION OR FAKEOUT TRAP?
🧠 Macro Overview
This week’s trading landscape is influenced by both European and U.S. developments:
EU Side: There are no major macroeconomic releases ahead, but expectations are growing that the ECB may adopt a more dovish tone in upcoming meetings. If inflation continues to cool, the euro may face downside pressure.
U.S. Side: Last week’s CPI and PPI data showed signs of cooling inflation, yet not enough for the Fed to shift gears. The U.S. dollar remains supported by the prospect of “higher for longer” interest rates.
Global Sentiment: Ongoing U.S.–China tensions and trade policy updates in Europe are keeping risk appetite cautious. The EUR/USD pair is testing a key zone and may break out of the descending channel soon — or reject hard if buyers fail to hold.
📊 Technical Analysis (H1 Chart)
EUR/USD bounced strongly from the 1.1160 – 1.1180 demand zone and is now testing the key resistance at 1.1237 — a confluence of descending trendline and the 200 EMA on the 1H chart.
A clean breakout above and sustained hold of 1.1237 could pave the way toward higher resistance levels at 1.1270 and 1.1325.
However, if the pair gets rejected at 1.1237, it may fall back to test the lower support at 1.1160 – 1.1180, possibly forming a range before a larger move.
📌 Key Levels to Watch
🔺 Resistance Levels:
1.1237 → Key confluence zone (EMA200 + trendline)
1.1270 → Previous swing high
1.1302 – 1.1325 → Upper resistance zone with Fibo confluence
🔻 Support Levels:
1.1180 → Immediate demand area
1.1160 → Critical trendline support
A break below 1.1160 could trigger stronger bearish momentum
🎯 Trading Scenarios
1. Bullish Breakout Above 1.1237
🔹 Entry: 1.1240 – 1.1250
🔹 SL: 1.1210
🔹 TP: 1.1270 → 1.1302 → 1.1325
2. Bearish Rejection at 1.1237
🔻 Entry: 1.1230 – 1.1225
🔻 SL: 1.1255
🔻 TP: 1.1180 → 1.1160
3. Buy-the-Dip at Key Support
🔹 Entry: 1.1165 – 1.1170
🔹 SL: 1.1135
🔹 TP: 1.1200 → 1.1230
⚠️ Key Notes:
Avoid entering trades during chop between 1.1215 – 1.1237 unless breakout confirmation appears.
Be cautious of liquidity grabs during London and NY session opens.
Stick to tight risk management as market remains uncertain and range-bound.
📌 Conclusion:
EUR/USD is at a decision point. Whether bulls take control or sellers defend key resistance will determine short-term trend direction. Trade the breakout or the reaction — not the prediction.

Bearish drop?The Fiber (EUR/USD) is rising towards the pivot and could drop to the 1st support.
Pivot: 1.1281
1st Support: 1.1051
1st Resistance: 1.1424
Risk Warning:
Trading Forex and CFDs carries a high level of risk to your capital and you should only trade with money you can afford to lose. Trading Forex and CFDs may not be suitable for all investors, so please ensure that you fully understand the risks involved and seek independent advice if necessary.
Disclaimer:
The above opinions given constitute general market commentary, and do not constitute the opinion or advice of IC Markets or any form of personal or investment advice.
Any opinions, news, research, analyses, prices, other information, or links to third-party sites contained on this website are provided on an "as-is" basis, are intended only to be informative, is not an advice nor a recommendation, nor research, or a record of our trading prices, or an offer of, or solicitation for a transaction in any financial instrument and thus should not be treated as such. The information provided does not involve any specific investment objectives, financial situation and needs of any specific person who may receive it. Please be aware, that past performance is not a reliable indicator of future performance and/or results. Past Performance or Forward-looking scenarios based upon the reasonable beliefs of the third-party provider are not a guarantee of future performance. Actual results may differ materially from those anticipated in forward-looking or past performance statements. IC Markets makes no representation or warranty and assumes no liability as to the accuracy or completeness of the information provided, nor any loss arising from any investment based on a recommendation, forecast or any information supplied by any third-party.

Bullish bounce?EUR/USD is falling towards the support level which is an overlap support that aligns with the 61.8% Fibonacci projection and could bouce from this level to our take profit.
Entry: 1.1083
Why we like it:
There is an overlap support level that lines up with the 61.8% Fibonacci projection.
Stop loss: 1.1098
Why we like it:
There is a pullback support level that lines up with the 138.2% Fibonacci extension.
Take profit: 1.1265
Why we like it:
There is an overlap resistance level.
Enjoying your TradingView experience? Review us!
Please be advised that the information presented on TradingView is provided to Vantage (‘Vantage Global Limited’, ‘we’) by a third-party provider (‘Everest Fortune Group’). Please be reminded that you are solely responsible for the trading decisions on your account. There is a very high degree of risk involved in trading. Any information and/or content is intended entirely for research, educational and informational purposes only and does not constitute investment or consultation advice or investment strategy. The information is not tailored to the investment needs of any specific person and therefore does not involve a consideration of any of the investment objectives, financial situation or needs of any viewer that may receive it. Kindly also note that past performance is not a reliable indicator of future results. Actual results may differ materially from those anticipated in forward-looking or past performance statements. We assume no liability as to the accuracy or completeness of any of the information and/or content provided herein and the Company cannot be held responsible for any omission, mistake nor for any loss or damage including without limitation to any loss of profit which may arise from reliance on any information supplied by Everest Fortune Group.

EURUSD - Shift In Momentum Confirmed!Hello TradingView Family / Fellow Traders. This is Richard, also known as theSignalyst.
📈After breaking below the structure marked in orange, EURUSD's momentum has been shifted from bullish to bearish.
EURUSD is currently rejecting the upper bound of its falling channel marked in red.
Moreover, it is retesting the orange structure.
🏹 Thus, the highlighted red circle is a strong area to look for sell setups as it is the intersection of structure and upper red trendline acting as a non-horizontal resistance.
📚 As per my trading style:
As #EURUSD is around the red circle zone, I will be looking for bearish reversal setups (like a double top pattern, trendline break , and so on...)
📚 Always follow your trading plan regarding entry, risk management, and trade management.
Good luck!
All Strategies Are Good; If Managed Properly!
~Rich
Disclosure: I am part of Trade Nation's Influencer program and receive a monthly fee for using their TradingView charts in my analysis.

EUR/USD – BEARISH BIAS IN PLAY, IS A FAKEOUT COMING?EUR/USD – BEARISH BIAS IN PLAY, IS A FAKEOUT COMING?
🧠 Market Context:
After a technical rebound earlier this week, EUR/USD is now consolidating inside a symmetrical triangle. Despite buyers attempting a breakout, low volume and price action still below the 200 EMA indicate weak bullish momentum.
The DXY is recovering on expectations the Fed will hold rates higher for longer.
Meanwhile, the Euro lacks fundamental support as the ECB remains cautious with policy moves.
👉 Given the current technical setup, the higher probability scenario (70%) is a bearish breakout, continuing the dominant downtrend.
📊 Trade Scenarios for Today:
✅ High Probability – SITUATION 1 (70%):
Price breaks below the triangle’s base near 1.1185–1.1190 and continues lower toward the 1.1110 demand zone.
⛔ SELL ZONE: 1.1210 – 1.1220 (after minor retest of broken trendline)
🎯 TP: 1.1180 → 1.1150 → 1.1120 → 1.1100
🛑 SL: 1.1245 (above EMA200)
🚨 Lower Probability – SITUATION 2 (30%):
Price breaks out and closes firmly above the triangle and 200 EMA (~1.124x) → short-term bullish reversal.
🔵 BUY ZONE: 1.1250 – 1.1260 (only after confirmed breakout with volume)
🎯 TP: 1.1290 → 1.1325 → 1.1350
🛑 SL: 1.1215
🔍 Key Technical Levels & EMA:
Resistance (200 EMA on H1): ~1.1247
Major Support Zones: 1.1180 – 1.1150 – 1.1110
🎯 Execution Strategy:
Favor short setups unless a clear bullish breakout occurs above 1.1247 with strong volume.
Watch for a breakdown and retest below 1.1180 to confirm bearish continuation.
Avoid premature entries — let price come to your levels.
⚠️ News to Watch:
No major data today, but USD is still sensitive to Fed tone and macro headlines.
Keep an eye on Fed speakers later in the NY session for potential impact on dollar direction.
✅ Final Thoughts:
The triangle pattern is coiling tight, but overall momentum favors sellers.
Expect liquidity sweeps and volatility traps, especially around session transitions.
Stick to your plan, respect your levels, and let the market decide the breakout direction.

EUR IS DANGER!!!!We are in the final phase of a major correction that has been ongoing for over 10 years. Prepare for significant instability in this region!!!!!! And take care of yourselves.
The only way this scenario would be invalidated is if the 1.26 mark is crossed — which is highly unlikely.

EUR/USD - Triangle Formation (16.05.2025)The EUR/USD pair on the M30 timeframe presents a Potential Buying Opportunity due to a recent Formation of a Triangle Pattern. This suggests a shift in momentum towards the upside and a higher likelihood of further advances in the coming hours.
Possible Long Trade:
Entry: Consider Entering A Long Position around Trendline Of The Pattern.
Target Levels:
1st Resistance – 1.1321
2nd Resistance – 1.1376
🎁 Please hit the like button and
🎁 Leave a comment to support for My Post !
Your likes and comments are incredibly motivating and will encourage me to share more analysis with you.
Best Regards, KABHI_TA_TRADING
Thank you.

Bearish reversal off 61.8% Fibonacci resistance?The Fiber (EUR/USD) has rejected off the pivot and could drop to the 1st support.
Pivot: 1.1265
1st Support: 1.1071
1st Resistance: 1.1367
Risk Warning:
Trading Forex and CFDs carries a high level of risk to your capital and you should only trade with money you can afford to lose. Trading Forex and CFDs may not be suitable for all investors, so please ensure that you fully understand the risks involved and seek independent advice if necessary.
Disclaimer:
The above opinions given constitute general market commentary, and do not constitute the opinion or advice of IC Markets or any form of personal or investment advice.
Any opinions, news, research, analyses, prices, other information, or links to third-party sites contained on this website are provided on an "as-is" basis, are intended only to be informative, is not an advice nor a recommendation, nor research, or a record of our trading prices, or an offer of, or solicitation for a transaction in any financial instrument and thus should not be treated as such. The information provided does not involve any specific investment objectives, financial situation and needs of any specific person who may receive it. Please be aware, that past performance is not a reliable indicator of future performance and/or results. Past Performance or Forward-looking scenarios based upon the reasonable beliefs of the third-party provider are not a guarantee of future performance. Actual results may differ materially from those anticipated in forward-looking or past performance statements. IC Markets makes no representation or warranty and assumes no liability as to the accuracy or completeness of the information provided, nor any loss arising from any investment based on a recommendation, forecast or any information supplied by any third-party.

EUR/USD Triangle Breakout (15.05.2025)The EUR/USD Pair on the M30 timeframe presents a Potential Selling Opportunity due to a recent Formation of a Triangle Breakout Pattern. This suggests a shift in momentum towards the downside in the coming hours.
Possible Short Trade:
Entry: Consider Entering A Short Position around Trendline Of The Pattern.
Target Levels:
1st Support – 1.1085
2nd Support – 1.1030
🎁 Please hit the like button and
🎁 Leave a comment to support for My Post !
Your likes and comments are incredibly motivating and will encourage me to share more analysis with you.
Best Regards, KABHI_TA_TRADING
Thank you.

Could the Fiber bounce from here?The price is falling towards the pivot and could bounce to the 1st resistance.
Pivot: 1.1137
1st Support: 1.1077
1st Resistance: 1.1241
Risk Warning:
Trading Forex and CFDs carries a high level of risk to your capital and you should only trade with money you can afford to lose. Trading Forex and CFDs may not be suitable for all investors, so please ensure that you fully understand the risks involved and seek independent advice if necessary.
Disclaimer:
The above opinions given constitute general market commentary, and do not constitute the opinion or advice of IC Markets or any form of personal or investment advice.
Any opinions, news, research, analyses, prices, other information, or links to third-party sites contained on this website are provided on an "as-is" basis, are intended only to be informative, is not an advice nor a recommendation, nor research, or a record of our trading prices, or an offer of, or solicitation for a transaction in any financial instrument and thus should not be treated as such. The information provided does not involve any specific investment objectives, financial situation and needs of any specific person who may receive it. Please be aware, that past performance is not a reliable indicator of future performance and/or results. Past Performance or Forward-looking scenarios based upon the reasonable beliefs of the third-party provider are not a guarantee of future performance. Actual results may differ materially from those anticipated in forward-looking or past performance statements. IC Markets makes no representation or warranty and assumes no liability as to the accuracy or completeness of the information provided, nor any loss arising from any investment based on a recommendation, forecast or any information supplied by any third-party.

Bearish drop?EUR/USD has rejected off the resistance level which is an overlap resistance and could drop from this level to our take profit.
Entry: 1.1274
Why we like it:
There is an overlap resistance level which is an overlap resistance that lines up with the 61.8% Fibonacci retracement.
Stop loss: 1.1373
Why we like it:
There is a pullback resistance level.
Take profit: 1.1084
Why we like it:
There is an overlap support level.
Enjoying your TradingView experience? Review us!
Please be advised that the information presented on TradingView is provided to Vantage (‘Vantage Global Limited’, ‘we’) by a third-party provider (‘Everest Fortune Group’). Please be reminded that you are solely responsible for the trading decisions on your account. There is a very high degree of risk involved in trading. Any information and/or content is intended entirely for research, educational and informational purposes only and does not constitute investment or consultation advice or investment strategy. The information is not tailored to the investment needs of any specific person and therefore does not involve a consideration of any of the investment objectives, financial situation or needs of any viewer that may receive it. Kindly also note that past performance is not a reliable indicator of future results. Actual results may differ materially from those anticipated in forward-looking or past performance statements. We assume no liability as to the accuracy or completeness of any of the information and/or content provided herein and the Company cannot be held responsible for any omission, mistake nor for any loss or damage including without limitation to any loss of profit which may arise from reliance on any information supplied by Everest Fortune Group.

Could the Fiber reverse from here?The price is rising towards the pivot and could reverse to the 1st support.
Pivot: 1.1208
1st Support: 1.1117
1st Resistance: 1.1244
Risk Warning:
Trading Forex and CFDs carries a high level of risk to your capital and you should only trade with money you can afford to lose. Trading Forex and CFDs may not be suitable for all investors, so please ensure that you fully understand the risks involved and seek independent advice if necessary.
Disclaimer:
The above opinions given constitute general market commentary, and do not constitute the opinion or advice of IC Markets or any form of personal or investment advice.
Any opinions, news, research, analyses, prices, other information, or links to third-party sites contained on this website are provided on an "as-is" basis, are intended only to be informative, is not an advice nor a recommendation, nor research, or a record of our trading prices, or an offer of, or solicitation for a transaction in any financial instrument and thus should not be treated as such. The information provided does not involve any specific investment objectives, financial situation and needs of any specific person who may receive it. Please be aware, that past performance is not a reliable indicator of future performance and/or results. Past Performance or Forward-looking scenarios based upon the reasonable beliefs of the third-party provider are not a guarantee of future performance. Actual results may differ materially from those anticipated in forward-looking or past performance statements. IC Markets makes no representation or warranty and assumes no liability as to the accuracy or completeness of the information provided, nor any loss arising from any investment based on a recommendation, forecast or any information supplied by any third-party.

EURUSD first 1D MA50 test since March 03. Bearish?Last time we had a look at the EURUSD pair (April 28, see chart below), we gave a bearish continuation signal, which not only did it hit its 1.12500 Target but also broke below the 3-month Channel Down:
This has brought us to the almost the first 1D MA50 (blue trend-line) test since the March 03 break-out. As long as this holds, it keeps the trend bullish but the 1D RSI is on a Bearish Divergence, indicating a potential long-term trend change.
Technically it is similar with the December 28 2023 High, which at the time of the 1D MA50 test was also on Higher Lows but its RSI on Lower Lows (Bearish Div). The 1D MA50 eventually broke, leading to a sell continuation that hit the 0.618 Fibonacci retracement level from the bottom.
As a result, if the D MA50 breaks, we will turn bearish, targeting 1.07000 (the 0.618 Fib).
-------------------------------------------------------------------------------
** Please LIKE 👍, FOLLOW ✅, SHARE 🙌 and COMMENT ✍ if you enjoy this idea! Also share your ideas and charts in the comments section below! This is best way to keep it relevant, support us, keep the content here free and allow the idea to reach as many people as possible. **
-------------------------------------------------------------------------------
Disclosure: I am part of Trade Nation's Influencer program and receive a monthly fee for using their TradingView charts in my analysis.
💸💸💸💸💸💸
👇 👇 👇 👇 👇 👇

Bullish bounce off 50% Fibonacci support?The Fiber (EUR/USD) is falling towards the pivot and could bounce from this level to our take profit.
Pivot: 1.1145
1st Support: 1.0938
1st Resistance: 1.1523
Risk Warning:
Trading Forex and CFDs carries a high level of risk to your capital and you should only trade with money you can afford to lose. Trading Forex and CFDs may not be suitable for all investors, so please ensure that you fully understand the risks involved and seek independent advice if necessary.
Disclaimer:
The above opinions given constitute general market commentary, and do not constitute the opinion or advice of IC Markets or any form of personal or investment advice.
Any opinions, news, research, analyses, prices, other information, or links to third-party sites contained on this website are provided on an "as-is" basis, are intended only to be informative, is not an advice nor a recommendation, nor research, or a record of our trading prices, or an offer of, or solicitation for a transaction in any financial instrument and thus should not be treated as such. The information provided does not involve any specific investment objectives, financial situation and needs of any specific person who may receive it. Please be aware, that past performance is not a reliable indicator of future performance and/or results. Past Performance or Forward-looking scenarios based upon the reasonable beliefs of the third-party provider are not a guarantee of future performance. Actual results may differ materially from those anticipated in forward-looking or past performance statements. IC Markets makes no representation or warranty and assumes no liability as to the accuracy or completeness of the information provided, nor any loss arising from any investment based on a recommendation, forecast or any information supplied by any third-party.

Potential bearish drop?EUR/USD is reacting off the resistance level which is a pullback resistance that lines up with the 50% Fibonacci retracement and could drop from this level to our take profit.
Entry: 1.1274
Why we like it:
There is a pullback resistance level that aligns with the 50% Fibonacci retracement.
Stop loss: 1.1373
Why we like it:
There is a pullback resistance level.
Take profit: 1.1084
Why we like it:
There is a pullback support level that lines up with the 71% Fibonacci retracement.
Enjoying your TradingView experience? Review us!
Please be advised that the information presented on TradingView is provided to Vantage (‘Vantage Global Limited’, ‘we’) by a third-party provider (‘Everest Fortune Group’). Please be reminded that you are solely responsible for the trading decisions on your account. There is a very high degree of risk involved in trading. Any information and/or content is intended entirely for research, educational and informational purposes only and does not constitute investment or consultation advice or investment strategy. The information is not tailored to the investment needs of any specific person and therefore does not involve a consideration of any of the investment objectives, financial situation or needs of any viewer that may receive it. Kindly also note that past performance is not a reliable indicator of future results. Actual results may differ materially from those anticipated in forward-looking or past performance statements. We assume no liability as to the accuracy or completeness of any of the information and/or content provided herein and the Company cannot be held responsible for any omission, mistake nor for any loss or damage including without limitation to any loss of profit which may arise from reliance on any information supplied by Everest Fortune Group.

Bearish drop?The Fiber (EUR/USD) is rising towards the pivot and could reverse to the 1st support.
Pivot: 1.1268
1st Support: 1.1088
1st Resistance: 1.1369
Risk Warning:
Trading Forex and CFDs carries a high level of risk to your capital and you should only trade with money you can afford to lose. Trading Forex and CFDs may not be suitable for all investors, so please ensure that you fully understand the risks involved and seek independent advice if necessary.
Disclaimer:
The above opinions given constitute general market commentary, and do not constitute the opinion or advice of IC Markets or any form of personal or investment advice.
Any opinions, news, research, analyses, prices, other information, or links to third-party sites contained on this website are provided on an "as-is" basis, are intended only to be informative, is not an advice nor a recommendation, nor research, or a record of our trading prices, or an offer of, or solicitation for a transaction in any financial instrument and thus should not be treated as such. The information provided does not involve any specific investment objectives, financial situation and needs of any specific person who may receive it. Please be aware, that past performance is not a reliable indicator of future performance and/or results. Past Performance or Forward-looking scenarios based upon the reasonable beliefs of the third-party provider are not a guarantee of future performance. Actual results may differ materially from those anticipated in forward-looking or past performance statements. IC Markets makes no representation or warranty and assumes no liability as to the accuracy or completeness of the information provided, nor any loss arising from any investment based on a recommendation, forecast or any information supplied by any third-party.

Bearish drop?EUR/USD has reacted off the support level which is a pullback support and could potentially drop from this level to our take profit.
Entry: 1.1274
Why we like it:
There is a pullback support level.
Stop loss: 1.1373
Why we like it:
There is a pullback resistance level.
Take profit: 1.1106
Why we like it:
There is a pullback support level that is slightly above the 61.8% Fibonacci retracement.
Enjoying your TradingView experience? Review us!
Please be advised that the information presented on TradingView is provided to Vantage (‘Vantage Global Limited’, ‘we’) by a third-party provider (‘Everest Fortune Group’). Please be reminded that you are solely responsible for the trading decisions on your account. There is a very high degree of risk involved in trading. Any information and/or content is intended entirely for research, educational and informational purposes only and does not constitute investment or consultation advice or investment strategy. The information is not tailored to the investment needs of any specific person and therefore does not involve a consideration of any of the investment objectives, financial situation or needs of any viewer that may receive it. Kindly also note that past performance is not a reliable indicator of future results. Actual results may differ materially from those anticipated in forward-looking or past performance statements. We assume no liability as to the accuracy or completeness of any of the information and/or content provided herein and the Company cannot be held responsible for any omission, mistake nor for any loss or damage including without limitation to any loss of profit which may arise from reliance on any information supplied by Everest Fortune Group.
Bearish reversal?The Fiber (EUR/USD) is rising towards the pivot and could reverse to the 1st support.
Pivot: 1.1338
1st Support: 1.1274
1st Resistance: 1.1376
Risk Warning:
Trading Forex and CFDs carries a high level of risk to your capital and you should only trade with money you can afford to lose. Trading Forex and CFDs may not be suitable for all investors, so please ensure that you fully understand the risks involved and seek independent advice if necessary.
Disclaimer:
The above opinions given constitute general market commentary, and do not constitute the opinion or advice of IC Markets or any form of personal or investment advice.
Any opinions, news, research, analyses, prices, other information, or links to third-party sites contained on this website are provided on an "as-is" basis, are intended only to be informative, is not an advice nor a recommendation, nor research, or a record of our trading prices, or an offer of, or solicitation for a transaction in any financial instrument and thus should not be treated as such. The information provided does not involve any specific investment objectives, financial situation and needs of any specific person who may receive it. Please be aware, that past performance is not a reliable indicator of future performance and/or results. Past Performance or Forward-looking scenarios based upon the reasonable beliefs of the third-party provider are not a guarantee of future performance. Actual results may differ materially from those anticipated in forward-looking or past performance statements. IC Markets makes no representation or warranty and assumes no liability as to the accuracy or completeness of the information provided, nor any loss arising from any investment based on a recommendation, forecast or any information supplied by any third-party.
