Could the Fiber reverse from here?The price is rising towards the pivot and could reverse to the 1st support.
Pivot: 1.1208
1st Support: 1.1117
1st Resistance: 1.1244
Risk Warning:
Trading Forex and CFDs carries a high level of risk to your capital and you should only trade with money you can afford to lose. Trading Forex and CFDs may not be suitable for all investors, so please ensure that you fully understand the risks involved and seek independent advice if necessary.
Disclaimer:
The above opinions given constitute general market commentary, and do not constitute the opinion or advice of IC Markets or any form of personal or investment advice.
Any opinions, news, research, analyses, prices, other information, or links to third-party sites contained on this website are provided on an "as-is" basis, are intended only to be informative, is not an advice nor a recommendation, nor research, or a record of our trading prices, or an offer of, or solicitation for a transaction in any financial instrument and thus should not be treated as such. The information provided does not involve any specific investment objectives, financial situation and needs of any specific person who may receive it. Please be aware, that past performance is not a reliable indicator of future performance and/or results. Past Performance or Forward-looking scenarios based upon the reasonable beliefs of the third-party provider are not a guarantee of future performance. Actual results may differ materially from those anticipated in forward-looking or past performance statements. IC Markets makes no representation or warranty and assumes no liability as to the accuracy or completeness of the information provided, nor any loss arising from any investment based on a recommendation, forecast or any information supplied by any third-party.
EUR

EURGBP: Shifting to long term bearish.EURGBP is heavily bearish on its 1D technical outlook (RSI = 36.165, MACD = 0.000, ADX = 36.508), and most likely will close the day under its 1D MA50. At the moment it is crossing below the 2025 Channel Up and if it closes under it, we will have a validated trend shift to bearish long term. It will be similar to the August 2024 decline that made a new Low after a 1D MA50 rejection. We first aim for the S1 level (TP1 = 0.83500) and as long as it remains under the 1D MA50, resell on the bounce to the S1 level (TP2 = 0.82500).
## If you like our free content follow our profile to get more daily ideas. ##
## Comments and likes are greatly appreciated. ##

EURUSD first 1D MA50 test since March 03. Bearish?Last time we had a look at the EURUSD pair (April 28, see chart below), we gave a bearish continuation signal, which not only did it hit its 1.12500 Target but also broke below the 3-month Channel Down:
This has brought us to the almost the first 1D MA50 (blue trend-line) test since the March 03 break-out. As long as this holds, it keeps the trend bullish but the 1D RSI is on a Bearish Divergence, indicating a potential long-term trend change.
Technically it is similar with the December 28 2023 High, which at the time of the 1D MA50 test was also on Higher Lows but its RSI on Lower Lows (Bearish Div). The 1D MA50 eventually broke, leading to a sell continuation that hit the 0.618 Fibonacci retracement level from the bottom.
As a result, if the D MA50 breaks, we will turn bearish, targeting 1.07000 (the 0.618 Fib).
-------------------------------------------------------------------------------
** Please LIKE 👍, FOLLOW ✅, SHARE 🙌 and COMMENT ✍ if you enjoy this idea! Also share your ideas and charts in the comments section below! This is best way to keep it relevant, support us, keep the content here free and allow the idea to reach as many people as possible. **
-------------------------------------------------------------------------------
Disclosure: I am part of Trade Nation's Influencer program and receive a monthly fee for using their TradingView charts in my analysis.
💸💸💸💸💸💸
👇 👇 👇 👇 👇 👇

EURJPY once again breaks key resistance.The bulls are having another attempt on moving FX_IDC:EURJPY higher. Do they have enough steam? Let's find out...
MARKETSCOM:EURJPY
Let us know what you think in the comments below.
Thank you.
77.3% of retail investor accounts lose money when trading CFDs with this provider. You should consider whether you understand how CFDs work and whether you can afford to take the high risk of losing your money. Past performance is not necessarily indicative of future results. The value of investments may fall as well as rise and the investor may not get back the amount initially invested. This content is not intended for nor applicable to residents of the UK. Cryptocurrency CFDs and spread bets are restricted in the UK for all retail clients.

Bullish bounce off 50% Fibonacci support?The Fiber (EUR/USD) is falling towards the pivot and could bounce from this level to our take profit.
Pivot: 1.1145
1st Support: 1.0938
1st Resistance: 1.1523
Risk Warning:
Trading Forex and CFDs carries a high level of risk to your capital and you should only trade with money you can afford to lose. Trading Forex and CFDs may not be suitable for all investors, so please ensure that you fully understand the risks involved and seek independent advice if necessary.
Disclaimer:
The above opinions given constitute general market commentary, and do not constitute the opinion or advice of IC Markets or any form of personal or investment advice.
Any opinions, news, research, analyses, prices, other information, or links to third-party sites contained on this website are provided on an "as-is" basis, are intended only to be informative, is not an advice nor a recommendation, nor research, or a record of our trading prices, or an offer of, or solicitation for a transaction in any financial instrument and thus should not be treated as such. The information provided does not involve any specific investment objectives, financial situation and needs of any specific person who may receive it. Please be aware, that past performance is not a reliable indicator of future performance and/or results. Past Performance or Forward-looking scenarios based upon the reasonable beliefs of the third-party provider are not a guarantee of future performance. Actual results may differ materially from those anticipated in forward-looking or past performance statements. IC Markets makes no representation or warranty and assumes no liability as to the accuracy or completeness of the information provided, nor any loss arising from any investment based on a recommendation, forecast or any information supplied by any third-party.

Potential bearish drop?EUR/USD is reacting off the resistance level which is a pullback resistance that lines up with the 50% Fibonacci retracement and could drop from this level to our take profit.
Entry: 1.1274
Why we like it:
There is a pullback resistance level that aligns with the 50% Fibonacci retracement.
Stop loss: 1.1373
Why we like it:
There is a pullback resistance level.
Take profit: 1.1084
Why we like it:
There is a pullback support level that lines up with the 71% Fibonacci retracement.
Enjoying your TradingView experience? Review us!
Please be advised that the information presented on TradingView is provided to Vantage (‘Vantage Global Limited’, ‘we’) by a third-party provider (‘Everest Fortune Group’). Please be reminded that you are solely responsible for the trading decisions on your account. There is a very high degree of risk involved in trading. Any information and/or content is intended entirely for research, educational and informational purposes only and does not constitute investment or consultation advice or investment strategy. The information is not tailored to the investment needs of any specific person and therefore does not involve a consideration of any of the investment objectives, financial situation or needs of any viewer that may receive it. Kindly also note that past performance is not a reliable indicator of future results. Actual results may differ materially from those anticipated in forward-looking or past performance statements. We assume no liability as to the accuracy or completeness of any of the information and/or content provided herein and the Company cannot be held responsible for any omission, mistake nor for any loss or damage including without limitation to any loss of profit which may arise from reliance on any information supplied by Everest Fortune Group.

EURCADPrice looks like its near a support zone dating back to around mid March of this year. Price has recently been rising on decreasing volume. Since price broke the previous high of mid March, price is trading sideways as well. Looking for a retracement for price to reach the target zone on the chart.

EURJPY Forms Ascending Wedge Near Key ResistanceEURJPY price action is contracting as it approaches the 165 resistance level. The newly formed wedge-like pattern could be an early sign that bulls are starting to lose control. Asian currencies have begun gaining strength recently, and the Taiwan dollar’s surprise move is just one example of this trend.
At the same time, USDJPY is testing a major broken trendline (see our earlier post linked below). If USDJPY gets rejected at this level while EURUSD got rejected as well from the resistance around 1.1275, there is a strong chance that EURJPY could break out of the ascending wedge pattern to the downside.
In that scenario, the first strong target would be the 160 level, followed by a potential move toward the major 155 support, depending on broader market conditions.
EURUSD:
USDJPY:

Pullback or Recovery? All Eyes on ECB and Inflation CluesEUR/USD – Pullback or Recovery? All Eyes on ECB and Inflation Clues
Hey traders! 👋
After a tough drop earlier this week, EUR/USD is now finding its feet again near the 1.1240 area. We’re seeing some early bullish signs, but the bigger question is: Is this just a pullback or the start of a stronger recovery?
🔎 What’s going on?
Today, ECB’s Šimkus came out with some pretty dovish comments:
He warned that Eurozone inflation depends a lot on how the EU responds to trade policies from the US.
There's pressure to cut interest rates as soon as June, but it’s still unclear whether they’ll follow up again in July or September.
Growth risks remain due to geopolitics and Chinese goods flowing into Europe.
These hints of a possible rate cut added more weight on the Euro. But at the same time, we’re seeing buyers step in around key support zones, so price action could get interesting soon.
🧭 Key Levels to Watch
Resistance:
1.1278 – First level to break for bulls
1.1301 – Near-term resistance
1.1325 & 1.1353 – Highs to watch if momentum builds
Support:
1.1240 – Holding well so far
1.1198 – Key BUY zone
1.1160 – Last line of defence for bulls
🧠 Trade Plan for Today (May 9th)
✅ BUY IDEA:
Buy Zone: 1.1198
SL: 1.1138
TP Targets:
→ 1.1235
→ 1.1285
→ 1.1325
❌ SELL IDEA:
Sell Zone: 1.1301
SL: 1.1360
TP Targets:
→ 1.1265
→ 1.1225
→ 1.1185
📌 Final Thoughts
The pair is still inside a downward channel, so we need to be flexible. If EUR/USD breaks and holds above 1.1300, bulls could take control. But if it fails, we might see another dip back toward the lower range.
Keep an eye on macro data next week – especially inflation figures and any fresh ECB signals.
👉 Stay patient, trade your zones, and don’t chase! Let the setup come to you.
Good luck! 🚀

Bearish drop?The Fiber (EUR/USD) is rising towards the pivot and could reverse to the 1st support.
Pivot: 1.1268
1st Support: 1.1088
1st Resistance: 1.1369
Risk Warning:
Trading Forex and CFDs carries a high level of risk to your capital and you should only trade with money you can afford to lose. Trading Forex and CFDs may not be suitable for all investors, so please ensure that you fully understand the risks involved and seek independent advice if necessary.
Disclaimer:
The above opinions given constitute general market commentary, and do not constitute the opinion or advice of IC Markets or any form of personal or investment advice.
Any opinions, news, research, analyses, prices, other information, or links to third-party sites contained on this website are provided on an "as-is" basis, are intended only to be informative, is not an advice nor a recommendation, nor research, or a record of our trading prices, or an offer of, or solicitation for a transaction in any financial instrument and thus should not be treated as such. The information provided does not involve any specific investment objectives, financial situation and needs of any specific person who may receive it. Please be aware, that past performance is not a reliable indicator of future performance and/or results. Past Performance or Forward-looking scenarios based upon the reasonable beliefs of the third-party provider are not a guarantee of future performance. Actual results may differ materially from those anticipated in forward-looking or past performance statements. IC Markets makes no representation or warranty and assumes no liability as to the accuracy or completeness of the information provided, nor any loss arising from any investment based on a recommendation, forecast or any information supplied by any third-party.

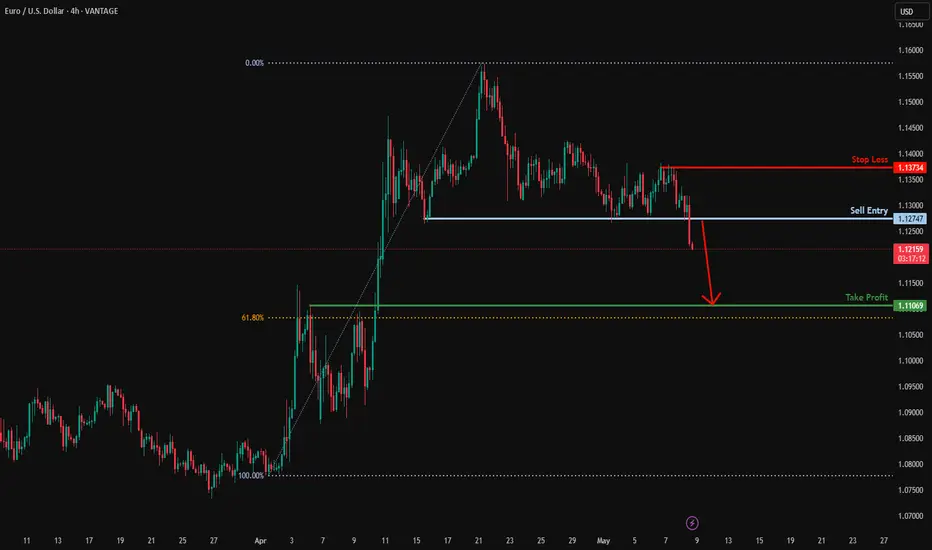
Bearish drop?EUR/USD has reacted off the support level which is a pullback support and could potentially drop from this level to our take profit.
Entry: 1.1274
Why we like it:
There is a pullback support level.
Stop loss: 1.1373
Why we like it:
There is a pullback resistance level.
Take profit: 1.1106
Why we like it:
There is a pullback support level that is slightly above the 61.8% Fibonacci retracement.
Enjoying your TradingView experience? Review us!
Please be advised that the information presented on TradingView is provided to Vantage (‘Vantage Global Limited’, ‘we’) by a third-party provider (‘Everest Fortune Group’). Please be reminded that you are solely responsible for the trading decisions on your account. There is a very high degree of risk involved in trading. Any information and/or content is intended entirely for research, educational and informational purposes only and does not constitute investment or consultation advice or investment strategy. The information is not tailored to the investment needs of any specific person and therefore does not involve a consideration of any of the investment objectives, financial situation or needs of any viewer that may receive it. Kindly also note that past performance is not a reliable indicator of future results. Actual results may differ materially from those anticipated in forward-looking or past performance statements. We assume no liability as to the accuracy or completeness of any of the information and/or content provided herein and the Company cannot be held responsible for any omission, mistake nor for any loss or damage including without limitation to any loss of profit which may arise from reliance on any information supplied by Everest Fortune Group.
Bearish reversal?The Fiber (EUR/USD) is rising towards the pivot and could reverse to the 1st support.
Pivot: 1.1338
1st Support: 1.1274
1st Resistance: 1.1376
Risk Warning:
Trading Forex and CFDs carries a high level of risk to your capital and you should only trade with money you can afford to lose. Trading Forex and CFDs may not be suitable for all investors, so please ensure that you fully understand the risks involved and seek independent advice if necessary.
Disclaimer:
The above opinions given constitute general market commentary, and do not constitute the opinion or advice of IC Markets or any form of personal or investment advice.
Any opinions, news, research, analyses, prices, other information, or links to third-party sites contained on this website are provided on an "as-is" basis, are intended only to be informative, is not an advice nor a recommendation, nor research, or a record of our trading prices, or an offer of, or solicitation for a transaction in any financial instrument and thus should not be treated as such. The information provided does not involve any specific investment objectives, financial situation and needs of any specific person who may receive it. Please be aware, that past performance is not a reliable indicator of future performance and/or results. Past Performance or Forward-looking scenarios based upon the reasonable beliefs of the third-party provider are not a guarantee of future performance. Actual results may differ materially from those anticipated in forward-looking or past performance statements. IC Markets makes no representation or warranty and assumes no liability as to the accuracy or completeness of the information provided, nor any loss arising from any investment based on a recommendation, forecast or any information supplied by any third-party.

EURUSD: Bullish trend intact unless this pattern breaks.EURUSD remains marginally bullish on its 1D technical outlook (RSI = 56.708, MACD = 0.008, ADX = 33.048) as in spite of correction of the last 2 weeks, the Bullish Megaphone remains intact with the price almost on its bottom. This maintains the bullish trend for at least another +7.80% bullish wave (TP = 1.21450). If the Megaphone breaks, the pattern and thus the trade are negated, and the trend turns bearish aiming at the 1D MA50, so the risk of going long now is very low.
## If you like our free content follow our profile to get more daily ideas. ##
## Comments and likes are greatly appreciated. ##

Bearish drop?EUR/USD is rising towards the resistance level which is a pullback resistance that aligns with the 50% Fibonacci retracement and could reverse from this level to our take profit.
Entry: 1.1425
Why we like it:
There is a pullback resistance level that aligns with the 50% Fibonacci retracement.
Stop loss: 1.1533
Why we like it:
There is a pullback resistance level.
Take profit: 1.1267
Why we like it:
There is a pullback support level.
Enjoying your TradingView experience? Review us!
Please be advised that the information presented on TradingView is provided to Vantage (‘Vantage Global Limited’, ‘we’) by a third-party provider (‘Everest Fortune Group’). Please be reminded that you are solely responsible for the trading decisions on your account. There is a very high degree of risk involved in trading. Any information and/or content is intended entirely for research, educational and informational purposes only and does not constitute investment or consultation advice or investment strategy. The information is not tailored to the investment needs of any specific person and therefore does not involve a consideration of any of the investment objectives, financial situation or needs of any viewer that may receive it. Kindly also note that past performance is not a reliable indicator of future results. Actual results may differ materially from those anticipated in forward-looking or past performance statements. We assume no liability as to the accuracy or completeness of any of the information and/or content provided herein and the Company cannot be held responsible for any omission, mistake nor for any loss or damage including without limitation to any loss of profit which may arise from reliance on any information supplied by Everest Fortune Group.

DXY / EURUSD Daily signal/setupHey Guys, Made this quick video showing you actual support and resistance and correlation between pairs.
Also a small buy/sell signal for you to take a look!
Have a great day!
PS. Our last video trade hit for 80 Pips!

EURAUD - Overall Bearish Medium-Term!Hello TradingView Family / Fellow Traders. This is Richard, also known as theSignalyst.
📈EURAUD has been overall bearish trading within the falling wedge pattern marked in red.
Moreover, the green zone is a strong structure and resistance.
🏹 Thus, the highlighted red circle is a strong area to look for sell setups as it is the intersection of the upper red trendline and resistance.
📚 As per my trading style:
As #EURAUD retests the red circle zone, I will be looking for bearish reversal setups (like a double top pattern, trendline break , and so on...)
📚 Always follow your trading plan regarding entry, risk management, and trade management.
Good luck!
All Strategies Are Good; If Managed Properly!
~Rich
Disclosure: I am part of Trade Nation's Influencer program and receive a monthly fee for using their TradingView charts in my analysis.

EURO - Price can start fall to support line of pennant patternHi guys, this is my overview for EURUSD, feel free to check it and write your feedback in comments👊
Some days ago price traded inside triangle, where it declined below $1.1310 level, but then made upward umpulse.
Price exited from triangle pattern and broke the $1.1425 level, after which it entered to pennant pattern.
In pennant, Euro reached the resistance line, after which it turned around and in a short time declined to the $1.1310 level, breaking $1.1425
Then the price some time traded between these two levels and later dropped to the support line of the pennant.
But recently it backed up and now traded very close to resistance line of pennant, so, I think it can rise a little.
After this movement, in my opinion, Euro can start to decline to $1.1300 support line of pennant.
If this post is useful to you, you can support me with like/boost and advice in comments❤️

EURUSD update 7.05.2025Short-term growth to the resistance zone (~1.1400-1.1420),
Then, there was a reversal and impulsive fall—a break of support, further decline to levels below 1.1200, possibly to a Value Area Low.
Conclusion:
This is a bearish scenario, with a trap for longists at the resistance area and an emphasis on liquidity capture under support levels.
Best regards, EXCAVO
_____________________
Disclosure: I am part of Trade Nation's Influencer program and receive a monthly fee for using their TradingView charts in my analysis.

Bearish drop?The Fiber (EUR/USD) is rising towards the pivot and could reverse to the 1st support.
Pivot: 1.1424
1st Support: 1.1268
1st Resistance: 1.1484
Risk Warning:
Trading Forex and CFDs carries a high level of risk to your capital and you should only trade with money you can afford to lose. Trading Forex and CFDs may not be suitable for all investors, so please ensure that you fully understand the risks involved and seek independent advice if necessary.
Disclaimer:
The above opinions given constitute general market commentary, and do not constitute the opinion or advice of IC Markets or any form of personal or investment advice.
Any opinions, news, research, analyses, prices, other information, or links to third-party sites contained on this website are provided on an "as-is" basis, are intended only to be informative, is not an advice nor a recommendation, nor research, or a record of our trading prices, or an offer of, or solicitation for a transaction in any financial instrument and thus should not be treated as such. The information provided does not involve any specific investment objectives, financial situation and needs of any specific person who may receive it. Please be aware, that past performance is not a reliable indicator of future performance and/or results. Past Performance or Forward-looking scenarios based upon the reasonable beliefs of the third-party provider are not a guarantee of future performance. Actual results may differ materially from those anticipated in forward-looking or past performance statements. IC Markets makes no representation or warranty and assumes no liability as to the accuracy or completeness of the information provided, nor any loss arising from any investment based on a recommendation, forecast or any information supplied by any third-party.

EURAUD forming a bottom?EURAUD - 24h expiry
The primary trend remains bullish.
The selloff has posted an exhaustion count on the daily chart.
Preferred trade is to buy on dips.
Setbacks should be limited to yesterday's low.
Bespoke support is located at 1.7500.
We look to Buy at 1.7500 (stop at 1.7440)
Our profit targets will be 1.7740 and 1.7815
Resistance: 1.7600 / 1.7700 / 1.7750
Support: 1.7470 / 1.7420 / 1.7380
Risk Disclaimer
The trade ideas beyond this page are for informational purposes only and do not constitute investment advice or a solicitation to trade. This information is provided by Signal Centre, a third-party unaffiliated with OANDA, and is intended for general circulation only. OANDA does not guarantee the accuracy of this information and assumes no responsibilities for the information provided by the third party. The information does not take into account the specific investment objectives, financial situation, or particular needs of any particular person. You should take into account your specific investment objectives, financial situation, and particular needs before making a commitment to trade, including seeking advice from an independent financial adviser regarding the suitability of the investment, under a separate engagement, as you deem fit.
You accept that you assume all risks in independently viewing the contents and selecting a chosen strategy.
Where the research is distributed in Singapore to a person who is not an Accredited Investor, Expert Investor or an Institutional Investor, Oanda Asia Pacific Pte Ltd (“OAP“) accepts legal responsibility for the contents of the report to such persons only to the extent required by law. Singapore customers should contact OAP at 6579 8289 for matters arising from, or in connection with, the information/research distributed.

EURAUD | 4H | SWING TRADINGHey there;
Traders, your likes are always my biggest source of motivation for me to share analysis. For this reason, I would like to ask each and every one of my followers; please do not miss your likes.
I sincerely thank everyone who supports me with their likes.
SIGNAL ALERT
BUY LIMIT ORDER ( EURAUD ) 1,74560
🟢TP1:1,75388
🟢TP2:1,77709
🟢TP3:1,81747
🔴SL:1,71135
RR / 2,00

EUR/GBP Wedge Breakout (06.05.2025)The EUR/GBP Pair on the M30 timeframe presents a Potential Selling Opportunity due to a recent Formation of a Wedge Breakout Pattern. This suggests a shift in momentum towards the downside in the coming hours.
Possible Short Trade:
Entry: Consider Entering A Short Position around Trendline Of The Pattern.
Target Levels:
1st Support – 0.8476
2nd Support – 0.8463
🎁 Please hit the like button and
🎁 Leave a comment to support for My Post !
Your likes and comments are incredibly motivating and will encourage me to share more analysis with you.
Best Regards, KABHI_TA_TRADING
Thank you.

EURNZD - Strong Intersection!Hello TradingView Family / Fellow Traders. This is Richard, also known as theSignalyst.
📈EURNZD has been in a correction phase trading within the falling red channel and it is currently retesting the lower bound of the bullish channel marked in blue.
Moreover, the green zone is a strong structure and support zone.
🏹 Thus, the highlighted blue circle is a strong area to look for buy setups as it is the intersection of structure and lower blue and red trendlines acting as non-horizontal support.
📚 As per my trading style:
As #EURNZD approaches the blue circle, I will be looking for bullish reversal setups (like a double bottom pattern, trendline break , and so on...)
📚 Always follow your trading plan regarding entry, risk management, and trade management.
Good luck!
All Strategies Are Good; If Managed Properly!
~Rich
Disclosure: I am part of Trade Nation's Influencer program and receive a monthly fee for using their TradingView charts in my analysis.
