Bullish bounce?EUR/JPY is falling towards the pivot which acts as an overlap support and could bounce to the 1st resistance which is also an overlap resistance.
Pivot: 160.89
1st Support: 159.93
1st Resistance: 162.23
Risk Warning:
Trading Forex and CFDs carries a high level of risk to your capital and you should only trade with money you can afford to lose. Trading Forex and CFDs may not be suitable for all investors, so please ensure that you fully understand the risks involved and seek independent advice if necessary.
Disclaimer:
The above opinions given constitute general market commentary, and do not constitute the opinion or advice of IC Markets or any form of personal or investment advice.
Any opinions, news, research, analyses, prices, other information, or links to third-party sites contained on this website are provided on an "as-is" basis, are intended only to be informative, is not an advice nor a recommendation, nor research, or a record of our trading prices, or an offer of, or solicitation for a transaction in any financial instrument and thus should not be treated as such. The information provided does not involve any specific investment objectives, financial situation and needs of any specific person who may receive it. Please be aware, that past performance is not a reliable indicator of future performance and/or results. Past Performance or Forward-looking scenarios based upon the reasonable beliefs of the third-party provider are not a guarantee of future performance. Actual results may differ materially from those anticipated in forward-looking or past performance statements. IC Markets makes no representation or warranty and assumes no liability as to the accuracy or completeness of the information provided, nor any loss arising from any investment based on a recommendation, forecast or any information supplied by any third-party.
EUR

Bullish bounce?EUR/GBP is falling towards the pivot which has been identified as a pullback support and could bounce to the overlap resistance that aligns with the 61.8% Fibonacci retracement.
Pivot: 0.8574
1st Support: 0.8530
1st Resistance: 0.8656
Risk Warning:
Trading Forex and CFDs carries a high level of risk to your capital and you should only trade with money you can afford to lose. Trading Forex and CFDs may not be suitable for all investors, so please ensure that you fully understand the risks involved and seek independent advice if necessary.
Disclaimer:
The above opinions given constitute general market commentary, and do not constitute the opinion or advice of IC Markets or any form of personal or investment advice.
Any opinions, news, research, analyses, prices, other information, or links to third-party sites contained on this website are provided on an "as-is" basis, are intended only to be informative, is not an advice nor a recommendation, nor research, or a record of our trading prices, or an offer of, or solicitation for a transaction in any financial instrument and thus should not be treated as such. The information provided does not involve any specific investment objectives, financial situation and needs of any specific person who may receive it. Please be aware, that past performance is not a reliable indicator of future performance and/or results. Past Performance or Forward-looking scenarios based upon the reasonable beliefs of the third-party provider are not a guarantee of future performance. Actual results may differ materially from those anticipated in forward-looking or past performance statements. IC Markets makes no representation or warranty and assumes no liability as to the accuracy or completeness of the information provided, nor any loss arising from any investment based on a recommendation, forecast or any information supplied by any third-party.

Bearish drop off pullback resistance?EUR/AUD is rising towards the pivot and could reverse to the 1st support which has been identified as a pullback support.
Pivot: 1.79554
1st Support: 1.74201
1st Resistance: 1.83703
Risk Warning:
Trading Forex and CFDs carries a high level of risk to your capital and you should only trade with money you can afford to lose. Trading Forex and CFDs may not be suitable for all investors, so please ensure that you fully understand the risks involved and seek independent advice if necessary.
Disclaimer:
The above opinions given constitute general market commentary, and do not constitute the opinion or advice of IC Markets or any form of personal or investment advice.
Any opinions, news, research, analyses, prices, other information, or links to third-party sites contained on this website are provided on an "as-is" basis, are intended only to be informative, is not an advice nor a recommendation, nor research, or a record of our trading prices, or an offer of, or solicitation for a transaction in any financial instrument and thus should not be treated as such. The information provided does not involve any specific investment objectives, financial situation and needs of any specific person who may receive it. Please be aware, that past performance is not a reliable indicator of future performance and/or results. Past Performance or Forward-looking scenarios based upon the reasonable beliefs of the third-party provider are not a guarantee of future performance. Actual results may differ materially from those anticipated in forward-looking or past performance statements. IC Markets makes no representation or warranty and assumes no liability as to the accuracy or completeness of the information provided, nor any loss arising from any investment based on a recommendation, forecast or any information supplied by any third-party.

EURJPY Potential DownsidesHey Traders, in today's trading session we are monitoring EURJPY for a selling opportunity around 162.100 zone, EURJPY is trading in a downtrend and currently is in a correction phase in which it is approaching the trend at 162.100 support and resistance area.
Trade safe, Joe.

EURUSD long term selllong term strategy for EURUSD in a weekly chart.
Top at 1.145. Could go down from there.
eur-usd

Bearish drop?The Fiber (EUR/USD) is rising towards the pivot and could drop to the 1st support.
Pivot: 1.1369
1st Support: 1.1147
1st Resistance: 1.1471
Risk Warning:
Trading Forex and CFDs carries a high level of risk to your capital and you should only trade with money you can afford to lose. Trading Forex and CFDs may not be suitable for all investors, so please ensure that you fully understand the risks involved and seek independent advice if necessary.
Disclaimer:
The above opinions given constitute general market commentary, and do not constitute the opinion or advice of IC Markets or any form of personal or investment advice.
Any opinions, news, research, analyses, prices, other information, or links to third-party sites contained on this website are provided on an "as-is" basis, are intended only to be informative, is not an advice nor a recommendation, nor research, or a record of our trading prices, or an offer of, or solicitation for a transaction in any financial instrument and thus should not be treated as such. The information provided does not involve any specific investment objectives, financial situation and needs of any specific person who may receive it. Please be aware, that past performance is not a reliable indicator of future performance and/or results. Past Performance or Forward-looking scenarios based upon the reasonable beliefs of the third-party provider are not a guarantee of future performance. Actual results may differ materially from those anticipated in forward-looking or past performance statements. IC Markets makes no representation or warranty and assumes no liability as to the accuracy or completeness of the information provided, nor any loss arising from any investment based on a recommendation, forecast or any information supplied by any third-party.

Bearish drop?EUR/USD has reacted off the support level which is a pullback support and could drop from this level to our take profit.
Entry: 1.1304
Why we like it:
There is a pullback resistance level.
Stop loss: 1.1371
Why we like it:
There is a pullback resistance level.
Take profit: 1.1160
Why we like it:
There is a pullback support that is slightly below the 50% Fibonacci retracement.
Enjoying your TradingView experience? Review us!
Please be advised that the information presented on TradingView is provided to Vantage (‘Vantage Global Limited’, ‘we’) by a third-party provider (‘Everest Fortune Group’). Please be reminded that you are solely responsible for the trading decisions on your account. There is a very high degree of risk involved in trading. Any information and/or content is intended entirely for research, educational and informational purposes only and does not constitute investment or consultation advice or investment strategy. The information is not tailored to the investment needs of any specific person and therefore does not involve a consideration of any of the investment objectives, financial situation or needs of any viewer that may receive it. Kindly also note that past performance is not a reliable indicator of future results. Actual results may differ materially from those anticipated in forward-looking or past performance statements. We assume no liability as to the accuracy or completeness of any of the information and/or content provided herein and the Company cannot be held responsible for any omission, mistake nor for any loss or damage including without limitation to any loss of profit which may arise from reliance on any information supplied by Everest Fortune Group.

EURGBP Potential downsidesHey Traders, in today's trading session we are monitoring EURGBP for a selling opportunity around 0.86000 zone, EURGBP is trading in a downtrend and currently is in a correction phase in which it is approaching the trend at 0.86000 support and resistance area.
Trade safe, Joe.

Setup of the Week: EURJPY Long Toward LiquidityI'm currently watching EURJPY for a potential long setup. Price is showing signs of bullish structure, and there’s a clean upside target sitting at 164.20, where equal highs rest on the weekly chart. That level also ends in a .20—an institutional number often used for stop placement—which adds confluence that price may be drawn toward it.
Why I'm Bullish
The Euro is showing strength across the board this week, supporting directional alignment.
Structure is starting to build bullish pressure, especially as price grinds upward toward liquidity.
We have weekly equal highs at 164.20, which is a clear magnet. (zoom out)
This setup is pretty straightforward: I’m anticipating that price wants to make a move toward those untouched highs. No extra complexity needed.
Recent Price Action
Looking at structure from April 9th:
Price sold off, took out a daily low, and then reversed sharply—classic manipulation and reclaim. The idea is that smart money will need to close those sell orders out if price returns to that zone.
The April 9th move down into 160 created what I believe is an institutional footprint.
This move took out liquidity, reversed hard, and left behind a zone I expect to be defended.
On Sunday’s weekly open, price quickly ran last week’s high, then reversed hard during the Tokyo session—a likely short-term trap. This tells me we might see some short-term bearish pressure before a larger move up, which is fine since I want price to return to the institutional buy zone around 160.00–160.30.
📍 Key Levels
Buy Zone: 160.00–160.30
This is where volume flooded in to drive the initial bullish manipulation move. If price returns, I expect heavy buying interest to step in.
Trap Confirmation: 162.80
During London open today, price ran a low, then reclaimed a high, and retested 162.80—another institutional level (ends in .80). That area acted as a trap and likely marked the start of the move down. We should see price stay under this move for this idea to work.
Target: 164.20
That’s the weekly equal high. Liquidity sits above there. If we return to the buy zone and bulls step in, I’ll be looking to ride the move up into that level.
Summary
I’m looking to long EURJPY on a retracement into 160.00–160.30, ideally after a stop hunt or false breakdown into that zone. The goal is to ride the volume push up toward the weekly target of 164.20, where stops likely sit from early sellers who might take a trendline break trade. If price respects the London trap at 162.80 and moves lower, I’ll be watching closely for reaction and confirmation in the buy zone.
Let me know your thoughts below or if you're watching the same levels.

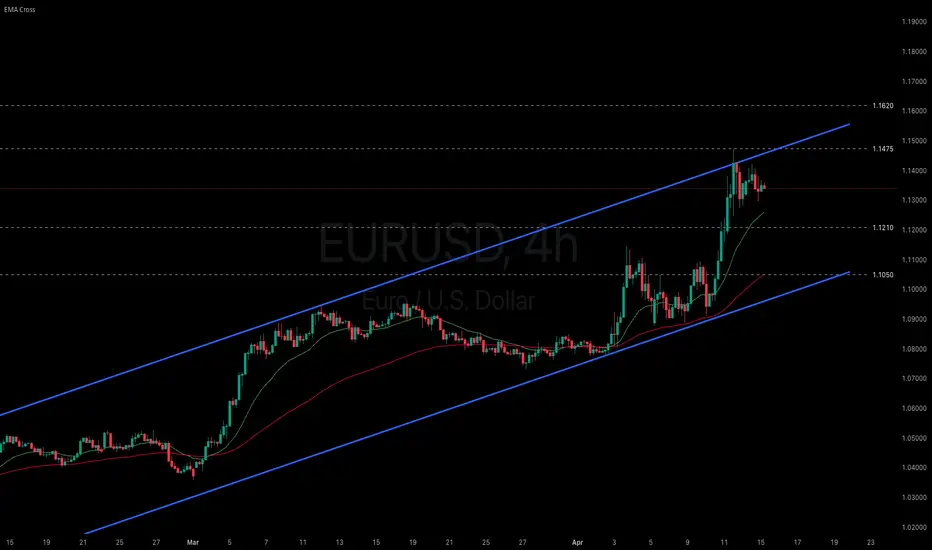
Will the persistent weak dollar help strengthen the euro?
The Trump administration announced a 90-day tariff reprieve and reciprocal exemptions on smartphones and semiconductors. However, President Trump denied that this constitutes a tariff exemption, stressing that duties on items such as semiconductors and pharmaceuticals will be reimposed.
Amid growing concerns over the impact of US tariff hikes on Eurozone growth, market sentiment has strengthened around the prospect of further ECB rate cuts. ECB President Christine Lagarde warned that the Trump administration’s aggressive tariff policy could destabilize European financial markets.
EURUSD has extended its sharp uptrend, testing the upper boundary of the ascending channel. The widening gap between both EMAs indicates a continued extension of bullish momentum. If EURUSD breaks above the channel’s upper bound, the price could advance toward the resistance at 1.1475. Conversely, if EURUSD falls below the support at 1.1210, the price may decline further toward 1.1050.
Bullish bounce?EUR/USD is falling towards the support level which is a pullback support that lines up with the 61.8% Fibonacci retracement and could bounce from this level to our take profit.
Entry: 1.1141
Why we like it:
There is a pullback support level that lines up with the 61.8% Fibonacci retracement.
Stop loss: 1.0949
Why we like it:
There is a pullback support level.
Take profit: 1.1425
Why we like it:
There is a pullback resistance.
Enjoying your TradingView experience? Review us!
Please be advised that the information presented on TradingView is provided to Vantage (‘Vantage Global Limited’, ‘we’) by a third-party provider (‘Everest Fortune Group’). Please be reminded that you are solely responsible for the trading decisions on your account. There is a very high degree of risk involved in trading. Any information and/or content is intended entirely for research, educational and informational purposes only and does not constitute investment or consultation advice or investment strategy. The information is not tailored to the investment needs of any specific person and therefore does not involve a consideration of any of the investment objectives, financial situation or needs of any viewer that may receive it. Kindly also note that past performance is not a reliable indicator of future results. Actual results may differ materially from those anticipated in forward-looking or past performance statements. We assume no liability as to the accuracy or completeness of any of the information and/or content provided herein and the Company cannot be held responsible for any omission, mistake nor for any loss or damage including without limitation to any loss of profit which may arise from reliance on any information supplied by Everest Fortune Group.

EURUSD Good sell opportunity on this short-term rejectionThe EURUSD pair got an initial rejection near its 2-month Higher Highs trend-line with the 4H RSI an a Bearish Divergence (Lower Highs) since April 03.
The last pull-back was -2.31% and made double contact with the 4H MA50 (blue trend-line) before rebounding. In fact all Higher Highs rejections hit at least he 4H MA50 before rebounding.
As a result, we see a strong short-term sell opportunity now, which even though could technically reach 1.12150 (-2.30% drop), it is advised to take profit once contact with the 4H MA50 is made.
-------------------------------------------------------------------------------
** Please LIKE 👍, FOLLOW ✅, SHARE 🙌 and COMMENT ✍ if you enjoy this idea! Also share your ideas and charts in the comments section below! This is best way to keep it relevant, support us, keep the content here free and allow the idea to reach as many people as possible. **
-------------------------------------------------------------------------------
Disclosure: I am part of Trade Nation's Influencer program and receive a monthly fee for using their TradingView charts in my analysis.
💸💸💸💸💸💸
👇 👇 👇 👇 👇 👇

EURGBP SHORT FORECAST Q2 W16 D16 Y25EURGBP SHORT FORECAST Q2 W16 D16 Y25
Morning All,
A short forecast to begin a monday morning!
Weekly order block rejection to start the week.
Bullish pressure visible therefore as always, we await confluences prior making an assumption.
In addition, we accept another reason for the trade to play against us - the weekly wick high, there is always a chance this is filled prior the turn around in price action however, if a break of 15' structure is presented, that risk will be accepted.
Happy to get involved in either of the set ups illustrated- set up 2 is clearly the "risky" trade of the two BUT did we ever forget our role is to manage risk. Set up two however have an added confluence of Tokyo range to be filled, pulling price action short.
I trust the chart analysis is becoming self explanatory.
Let's see how EURGBP plays!
FRGNT X

EURUSD Day Trade Idea Hi today I am looking at the EURUSD, and can see some potential day trade sell possibly happening soon or now. I have drawn the sell liquidity zone using the red box to show the sell pressure candles back from the current candle. Thank you please support me by following me.
#eurusd #eur #usd #sell #daytrade #day #trade #forex
@ilyaskhan.1994

Falling towards pullback support?EUR/NZD is falling towards the pivot which lines up with the 50% Fibonacci retracement and could bouncer to the pullback resistance.
Pivot: 1.91015
1st Support: 1.87490
1st Resistance: 1.97643
Risk Warning:
Trading Forex and CFDs carries a high level of risk to your capital and you should only trade with money you can afford to lose. Trading Forex and CFDs may not be suitable for all investors, so please ensure that you fully understand the risks involved and seek independent advice if necessary.
Disclaimer:
The above opinions given constitute general market commentary, and do not constitute the opinion or advice of IC Markets or any form of personal or investment advice.
Any opinions, news, research, analyses, prices, other information, or links to third-party sites contained on this website are provided on an "as-is" basis, are intended only to be informative, is not an advice nor a recommendation, nor research, or a record of our trading prices, or an offer of, or solicitation for a transaction in any financial instrument and thus should not be treated as such. The information provided does not involve any specific investment objectives, financial situation and needs of any specific person who may receive it. Please be aware, that past performance is not a reliable indicator of future performance and/or results. Past Performance or Forward-looking scenarios based upon the reasonable beliefs of the third-party provider are not a guarantee of future performance. Actual results may differ materially from those anticipated in forward-looking or past performance statements. IC Markets makes no representation or warranty and assumes no liability as to the accuracy or completeness of the information provided, nor any loss arising from any investment based on a recommendation, forecast or any information supplied by any third-party.

Bullish continuation?EUR/GBP has bounced off the pivot which is a pullback support and could rise to the 128.2% Fibonacci resistance.
Pivot: 0.8608
1st Support: 0.8527
1st Resistance: 0.8767
Risk Warning:
Trading Forex and CFDs carries a high level of risk to your capital and you should only trade with money you can afford to lose. Trading Forex and CFDs may not be suitable for all investors, so please ensure that you fully understand the risks involved and seek independent advice if necessary.
Disclaimer:
The above opinions given constitute general market commentary, and do not constitute the opinion or advice of IC Markets or any form of personal or investment advice.
Any opinions, news, research, analyses, prices, other information, or links to third-party sites contained on this website are provided on an "as-is" basis, are intended only to be informative, is not an advice nor a recommendation, nor research, or a record of our trading prices, or an offer of, or solicitation for a transaction in any financial instrument and thus should not be treated as such. The information provided does not involve any specific investment objectives, financial situation and needs of any specific person who may receive it. Please be aware, that past performance is not a reliable indicator of future performance and/or results. Past Performance or Forward-looking scenarios based upon the reasonable beliefs of the third-party provider are not a guarantee of future performance. Actual results may differ materially from those anticipated in forward-looking or past performance statements. IC Markets makes no representation or warranty and assumes no liability as to the accuracy or completeness of the information provided, nor any loss arising from any investment based on a recommendation, forecast or any information supplied by any third-party.

ECB decision shadowed by tariff risk Markets will be closely watching the European Central Bank’s (ECB) interest rate decision on April 17, with expectations for a seventh consecutive rate cut.
Despite this expectation, the euro surged to a three-year high against the US dollar last week, as traders continued to pull away from US assets.
The dollar index has dropped 4% since President Trump’s “Liberation Day” tariff announcements on April 2, falling below the key 100 level too.
At this stage, market participants will be looking for any signals on how the ECB might respond to the potential spillover effects of President Trump’s tariff measures. While some guidance may emerge around already-announced policies, the risk of further unpredictability remains high.
Trump being Trump, it is perhaps unlikely we have seen the last of his volatility-inducing tariff announcements. This can weigh further on the dollar, eroding confidence in the world’s reserve currency.

Bullish bounce off pullback support?EUR/NZD has bounced off the pivot which has been identified as a pullback support that lines up with the 38.2% Fibonacci retracement and could rise to the 1st resistance.
Pivot: 1.94887
1st Support: 1.82716
1st Resistance: 1.97446
CAD/JPY is falling towards the pivot which is a pullback support and could bounce to the pullback resistance.
Pivot: 102.61
1st Support: 101.62
1st Resistance: 103.68
Risk Warning:
Trading Forex and CFDs carries a high level of risk to your capital and you should only trade with money you can afford to lose. Trading Forex and CFDs may not be suitable for all investors, so please ensure that you fully understand the risks involved and seek independent advice if necessary.
Disclaimer:
The above opinions given constitute general market commentary, and do not constitute the opinion or advice of IC Markets or any form of personal or investment advice.
Any opinions, news, research, analyses, prices, other information, or links to third-party sites contained on this website are provided on an "as-is" basis, are intended only to be informative, is not an advice nor a recommendation, nor research, or a record of our trading prices, or an offer of, or solicitation for a transaction in any financial instrument and thus should not be treated as such. The information provided does not involve any specific investment objectives, financial situation and needs of any specific person who may receive it. Please be aware, that past performance is not a reliable indicator of future performance and/or results. Past Performance or Forward-looking scenarios based upon the reasonable beliefs of the third-party provider are not a guarantee of future performance. Actual results may differ materially from those anticipated in forward-looking or past performance statements. IC Markets makes no representation or warranty and assumes no liability as to the accuracy or completeness of the information provided, nor any loss arising from any investment based on a recommendation, forecast or any information supplied by any third-party.

Bullish bounce off pullback support?EUR/AUD has bounced off the pivot and could rise to the pullback resistance.
Pivot: 1.79142
1st Support: 1.76955
1st Resistance: 1.82291
Risk Warning:
Trading Forex and CFDs carries a high level of risk to your capital and you should only trade with money you can afford to lose. Trading Forex and CFDs may not be suitable for all investors, so please ensure that you fully understand the risks involved and seek independent advice if necessary.
Disclaimer:
The above opinions given constitute general market commentary, and do not constitute the opinion or advice of IC Markets or any form of personal or investment advice.
Any opinions, news, research, analyses, prices, other information, or links to third-party sites contained on this website are provided on an "as-is" basis, are intended only to be informative, is not an advice nor a recommendation, nor research, or a record of our trading prices, or an offer of, or solicitation for a transaction in any financial instrument and thus should not be treated as such. The information provided does not involve any specific investment objectives, financial situation and needs of any specific person who may receive it. Please be aware, that past performance is not a reliable indicator of future performance and/or results. Past Performance or Forward-looking scenarios based upon the reasonable beliefs of the third-party provider are not a guarantee of future performance. Actual results may differ materially from those anticipated in forward-looking or past performance statements. IC Markets makes no representation or warranty and assumes no liability as to the accuracy or completeness of the information provided, nor any loss arising from any investment based on a recommendation, forecast or any information supplied by any third-party.

EURCHF: Strong bearish waveEURCHF is bearish on its 1D technical outlook (RSI = 32.579, MACD = -0.004, ADX = 41.175) being on a strong bearish wave inside its Channel Down. We estimate to complete a symmetric -8.33% decline from the top, as the previous wave did (TP = 0.91100).
See how our prior idea has worked out:
## If you like our free content follow our profile to get more daily ideas. ##
## Comments and likes are greatly appreciated. ##

EURUSD POSSIBLE TRADE SETUPPotential Trade Setup on EURUSD
EURUSD is on a strong 3-week rally correction that was almost got rejected on Friday due to the UK and US GDP data that came pretty strong and weak respectively.
That said, I am still quite anticipating for a possible correction to continue towards the 50% fib level at 1.0650, before we can start looking for a possible buy entry in the long term.
Trading Plan:
1. BUY if the resistance gets broken and retest successfully.
2. SELL if the current region acts as resistance for rejection towards the downside with an engulfing called on the 4H chart.
Targets:
1. Can be 1:2 for either entries.
Tips:
1. The RSI (1d) indicates an Overbought but easing gradually towards the 50 level.
Please like, follow, and comment!!
You may find more details in the chart!
Thank you and Trade Responsibly!
❤️PS: Please support with a like or comment if you find this analysis useful for your trading day❤️

EUR/PLN SHORT Investment Opportunity 4HHello, I am Trader Andrea Russo and today I want to show you a SHORT investment opportunity on EUR/PLN. We are currently on a 4-hour (4H) chart, and some technical indicators suggest increasing bearish pressure. The overbought signals and the loss of momentum suggest that we could be facing a possible bearish reversal, making this configuration particularly interesting.
Here is the Investment Setup:
The entry price for the trade is set at 4.2854.
There is a SELL signal with a target price set at 4.2066, corresponding to a TP of 1.85%.
The stop loss is set at 4.2593, corresponding to a SL of 0.61%.
This short position offers a favorable risk/reward ratio, taking advantage of the current bearish pressure and the possible confirmation of a bearish trend on EUR/PLN.
As always, I encourage you to monitor this setup carefully and apply strategic and conscious risk management to your trading plan. Happy trading! 📉

Heading into 61.8% Fibonacci resistance?The Fiber (EUR/USD) is rising towards the pivot and could reverse to the 1st support which has been identified as a pullback support.
Pivot: 1.1024
1st Support: 1.0939
1st Resistance: 1.1089
Risk Warning:
Trading Forex and CFDs carries a high level of risk to your capital and you should only trade with money you can afford to lose. Trading Forex and CFDs may not be suitable for all investors, so please ensure that you fully understand the risks involved and seek independent advice if necessary.
Disclaimer:
The above opinions given constitute general market commentary, and do not constitute the opinion or advice of IC Markets or any form of personal or investment advice.
Any opinions, news, research, analyses, prices, other information, or links to third-party sites contained on this website are provided on an "as-is" basis, are intended only to be informative, is not an advice nor a recommendation, nor research, or a record of our trading prices, or an offer of, or solicitation for a transaction in any financial instrument and thus should not be treated as such. The information provided does not involve any specific investment objectives, financial situation and needs of any specific person who may receive it. Please be aware, that past performance is not a reliable indicator of future performance and/or results. Past Performance or Forward-looking scenarios based upon the reasonable beliefs of the third-party provider are not a guarantee of future performance. Actual results may differ materially from those anticipated in forward-looking or past performance statements. IC Markets makes no representation or warranty and assumes no liability as to the accuracy or completeness of the information provided, nor any loss arising from any investment based on a recommendation, forecast or any information supplied by any third-party.
