EURAUD Set To Fall! SELL!
My dear followers,
I analysed this chart on EURAUD and concluded the following:
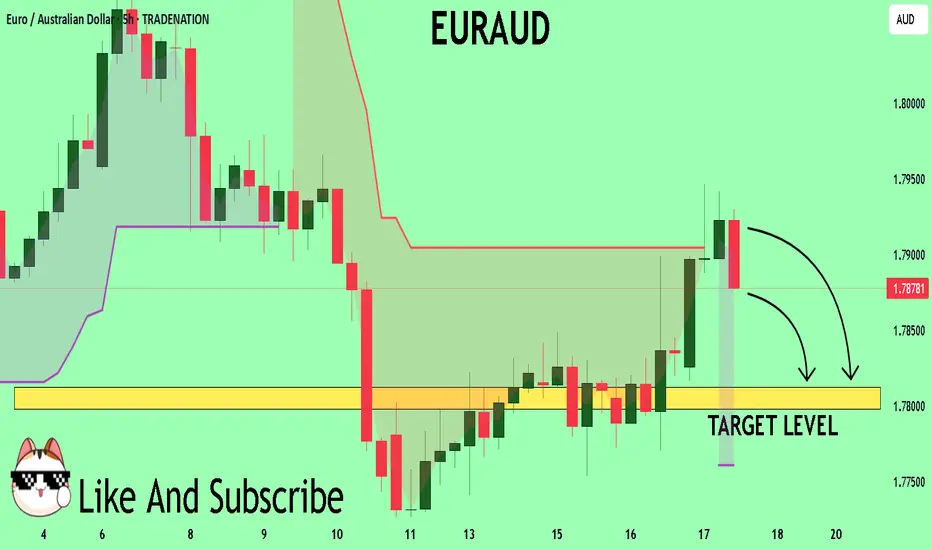
The market is trading on 1.7917 pivot level.
Bias - Bearish
Technical Indicators: Both Super Trend & Pivot HL indicate a highly probable Bearish continuation.
Target - 1.7840
Safe Stop Loss - 1.7966
About Used Indicators:
A super-trend indicator is plotted on either above or below the closing price to signal a buy or sell. The indicator changes color, based on whether or not you should be buying. If the super-trend indicator moves below the closing price, the indicator turns green, and it signals an entry point or points to buy.
Disclosure: I am part of Trade Nation's Influencer program and receive a monthly fee for using their TradingView charts in my analysis.
———————————
WISH YOU ALL LUCK
EURAUD
EURAUD Breakdown: Bearish Continuation Ahead of ECBEURAUD is showing signs of renewed downside pressure as fundamental and technical forces align in favor of Australian dollar strength. With the European Central Bank expected to hold rates steady and provide a cautious growth outlook, the euro remains vulnerable. Meanwhile, upside surprises in Australian inflation and supportive commodity dynamics continue to boost AUD sentiment. Technically, the pair has broken down from a rising wedge, confirming bearish momentum and setting the stage for further declines toward key support near 1.7648 and potentially 1.7500.
🟢 Current Bias: Bearish
🔑 Key Fundamentals:
ECB: Markets expect the ECB to hold rates steady this week. While this ends a 7-year streak of cuts, the bank has turned cautiously neutral, with no clear signal of future tightening. Core inflation remains subdued, and growth momentum across Germany and the euro area is weak.
RBA & Australia: The RBA faces persistent inflation risks after the June CPI surprised to the upside, putting rate hikes back on the table. The Aussie dollar is drawing strength from this, especially with rising commodity prices and China's potential fiscal stimulus aiding demand-side confidence.
Macro Divergence: Australia’s macro picture is improving vs. the eurozone. AUD has tailwinds; EUR is under pressure from stagnant growth and tepid inflation outlook.
⚠️ Risks to Bias:
ECB Surprise: A sudden hawkish tone from the ECB (e.g., lifting forecasts or emphasizing wage-driven inflation risk) could spark short-term EUR upside.
RBA Softness: A dovish RBA pivot or weak Aussie data could weaken AUD strength and slow EURAUD downside.
Geopolitical Risk: Broader global volatility (e.g., US-China, oil disruptions) could cause flows into euro as a semi-safe haven.
📅 Key News/Events to Watch:
ECB Rate Decision & Press Conference – July 25
Eurozone Flash GDP + CPI – Next week
China industrial data (AUD-sensitive)
RBA August Meeting Statement (early Aug)
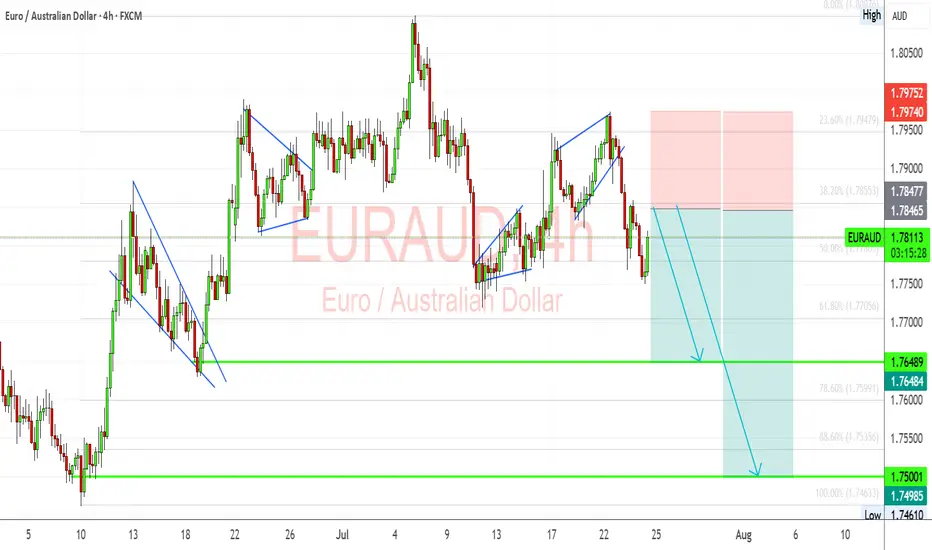
📉 Technical Breakdown (4H Chart):
Price broke bearish from a wedge consolidation.
Minor bullish pullbacks are being sold into, confirming a distribution phase.
Targets:
1st Target: 1.76480 (support & fib confluence)
2nd Target: 1.7500–1.7460 zone (major swing low)
Resistance: 1.7855–1.7975 zone is key invalidation area.
Structure favors lower highs & continuation patterns until support zones break.
🧭 Leader/Lagger Behavior:
AUD is leading the move. Strong CPI and China demand backdrop are fueling bullish AUD momentum.
EUR is lagging, tracking broader USD risk tone and internal Eurozone data weakness.
EURAUD is currently reactive to external forces rather than setting direction for other pairs.
✅ Summary: Bias and Watchpoints
Bias: Bearish
Fundamentals: Weak Eurozone growth vs. hotter Aussie inflation and hawkish RBA tone.
Risk: ECB hawkish tilt or a dovish shift from the RBA.
Event to Watch: ECB press conference and Aussie CPI commentary from policymakers.
Leader/Lagger: Lagger — following AUD strength rather than leading.
EURAUD: Bullish Forecast & Outlook
Our strategy, polished by years of trial and error has helped us identify what seems to be a great trading opportunity and we are here to share it with you as the time is ripe for us to buy EURAUD.
Disclosure: I am part of Trade Nation's Influencer program and receive a monthly fee for using their TradingView charts in my analysis.
❤️ Please, support our work with like & comment! ❤️

EURAUD – Planning Ahead, Not PredictingAs usual, I have marked my level.
🎯 I’m waiting for the price to reach it and if a valid sell signal appears, I will enter a short position.
If the level is broken cleanly,
I’ll wait for a pullback and enter a buy trade.
We are just traders, not predictors.
We have no impact on the market —
we are just a tiny part of a huge system.
🧠 So I never say: “Price will come here, then must fall.”
That’s not my mindset.
My belief is simple:
Manage risk, be prepared for everything.
One trade won’t make me rich,
and I won’t let one trade destroy me.
📌 Stop-loss is the first and last rule.
Trading without a stop-loss is just gambling.
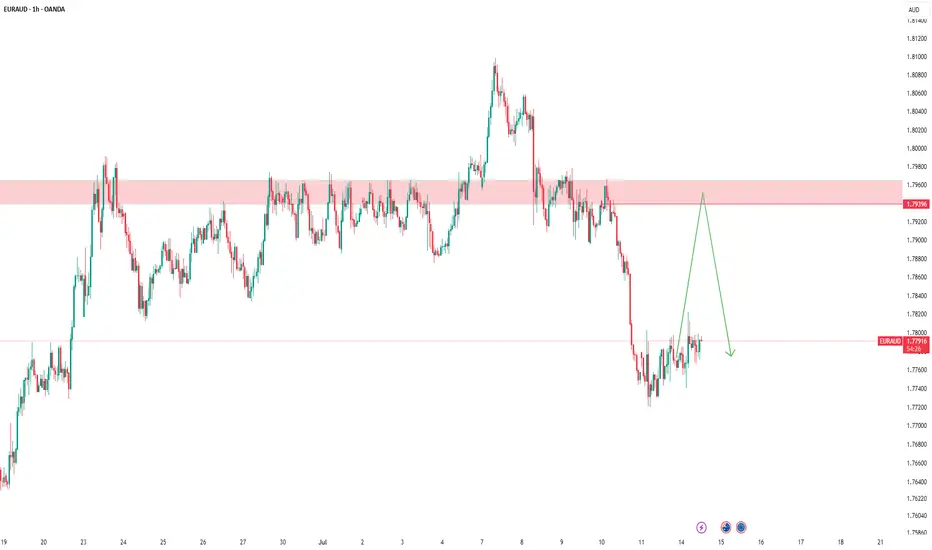
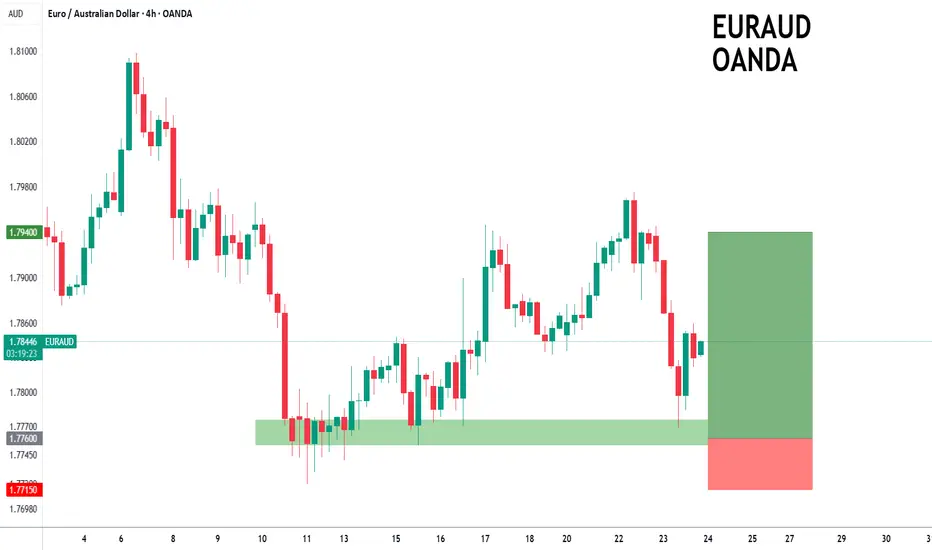
EURAUD to find buyers at previous support?EURAUD - 24h expiry
The primary trend remains bullish.
We are trading at oversold extremes.
Preferred trade is to buy on dips.
Risk/Reward would be poor to call a buy from current levels.
Bespoke support is located at 1.7760.
We look to Buy at 1.7760 (stop at 1.7715)
Our profit targets will be 1.7940 and 1.7960
Resistance: 1.7840 / 1.7900 / 1.7950
Support: 1.7750 / 1.7720 / 1.7700
Risk Disclaimer
The trade ideas beyond this page are for informational purposes only and do not constitute investment advice or a solicitation to trade. This information is provided by Signal Centre, a third-party unaffiliated with OANDA, and is intended for general circulation only. OANDA does not guarantee the accuracy of this information and assumes no responsibilities for the information provided by the third party. The information does not take into account the specific investment objectives, financial situation, or particular needs of any particular person. You should take into account your specific investment objectives, financial situation, and particular needs before making a commitment to trade, including seeking, under a separate engagement, as you deem fit.
You accept that you assume all risks in independently viewing the contents and selecting a chosen strategy.
Where the research is distributed in Singapore to a person who is not an Accredited Investor, Expert Investor or an Institutional Investor, Oanda Asia Pacific Pte Ltd (“OAP“) accepts legal responsibility for the contents of the report to such persons only to the extent required by law. Singapore customers should contact OAP at 6579 8289 for matters arising from, or in connection with, the information/research distributed.
EURAUD: Waiting for the FVG Tap and Confirmation to ShortPrice ran previous liquidity and dropped aggressively, creating a clean FVG.
I’m now watching for price to retrace into that imbalance and form a strong bearish candle. If it does, I’ll be looking to short down
Clean structure. Just waiting for confirmation.

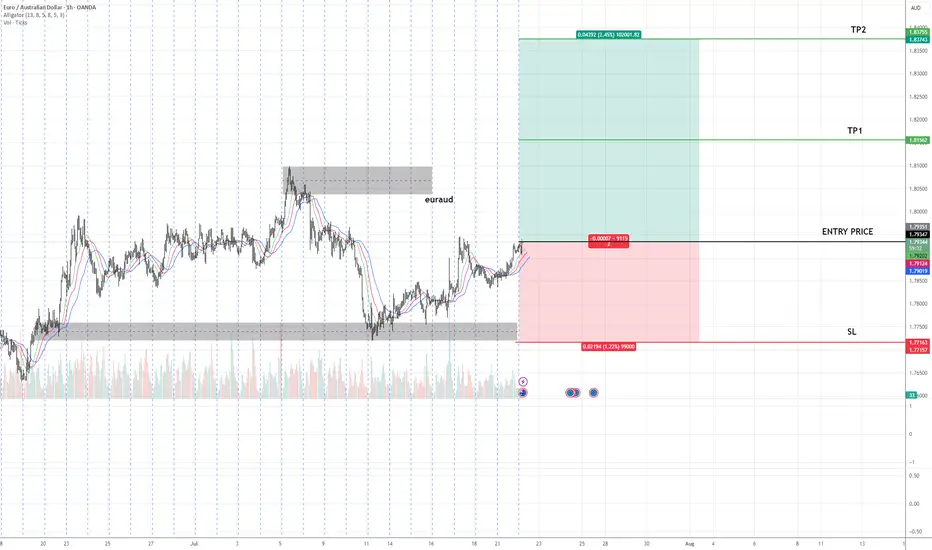
EURAUD Buy Setup – Advanced Analysis Entry: As marked on chart
🎯 TP1: As highlighted on chart
🎯 TP2: As highlighted on chart
🛑 SL: As defined on chart
📊 Technical Insight:
Price has completed a higher low formation, indicating the potential start of a new uptrend phase.
The market has shown an accumulation phase followed by a breakout above minor resistance, suggesting strong demand at current levels.
Volume analysis supports the breakout, with increased participation on bullish pushes and decreasing volume on retracements, confirming healthy trend dynamics.
📍 As long as price holds above the stop loss zone, we expect continuation towards TP1 and TP2 in line with the primary trend.
EUR/AUD BUYERS WILL DOMINATE THE MARKET|LONG
EUR/AUD SIGNAL
Trade Direction: long
Entry Level: 1.787
Target Level: 1.791
Stop Loss: 1.785
RISK PROFILE
Risk level: medium
Suggested risk: 1%
Timeframe: 1h
Disclosure: I am part of Trade Nation's Influencer program and receive a monthly fee for using their TradingView charts in my analysis.
✅LIKE AND COMMENT MY IDEAS✅

EURUAD is in the Buy directionHello Traders
In This Chart EUR/AUD 4 HOURLY Forex Forecast By FOREX PLANET
today EUR/AUD analysis 👆
🟢This Chart includes_ (EUR/AUD market update)
🟢What is The Next Opportunity on EUR/AUD Market
🟢how to Enter to the Valid Entry With Assurance Profit
This CHART is For Trader's that Want to Improve Their Technical Analysis Skills and Their Trading By Understanding How To Analyze The Market Using Multiple Timeframes and Understanding The Bigger Picture on the Charts


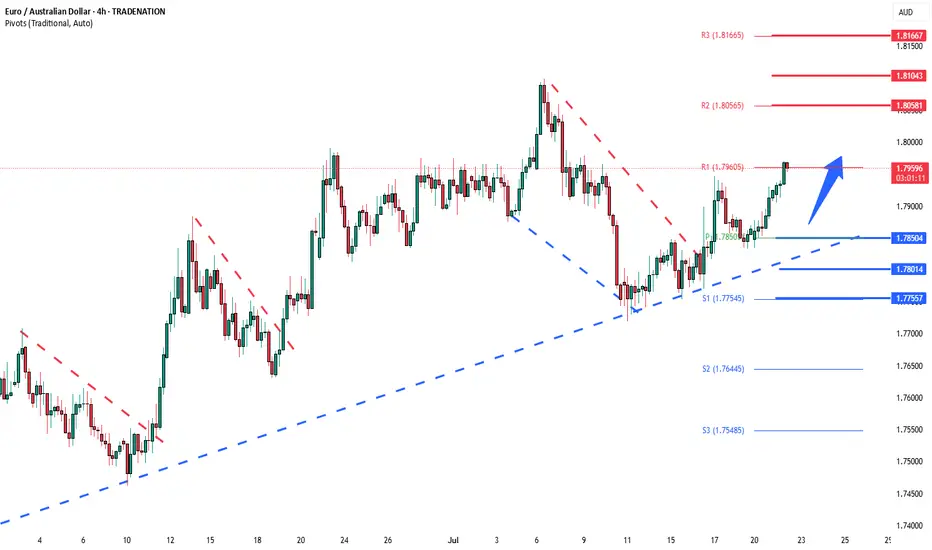
EURAUD Bullish breakout supported at 1.7650The EURAUD remains in a bullish trend, with recent price action indicating a continuation breakout within the broader uptrend.
Support Zone: 1.7850 – a key level from previous consolidation. Price is currently testing or approaching this level.
A bullish rebound from 1.7850 would confirm ongoing upside momentum, with potential targets at:
1.8060 – initial resistance
1.8100 – psychological and structural level
1.8165 – extended resistance on the longer-term chart
Bearish Scenario:
A confirmed break and daily close below 1.7850 would weaken the bullish outlook and suggest deeper downside risk toward:
1.7800 – minor support
1.7755 – stronger support and potential demand zone
Outlook:
Bullish bias remains intact while the EURAUD holds above 1.7850. A sustained break below this level could shift momentum to the downside in the short term.
This communication is for informational purposes only and should not be viewed as any form of recommendation as to a particular course of action or as investment advice. It is not intended as an offer or solicitation for the purchase or sale of any financial instrument or as an official confirmation of any transaction. Opinions, estimates and assumptions expressed herein are made as of the date of this communication and are subject to change without notice. This communication has been prepared based upon information, including market prices, data and other information, believed to be reliable; however, Trade Nation does not warrant its completeness or accuracy. All market prices and market data contained in or attached to this communication are indicative and subject to change without notice.
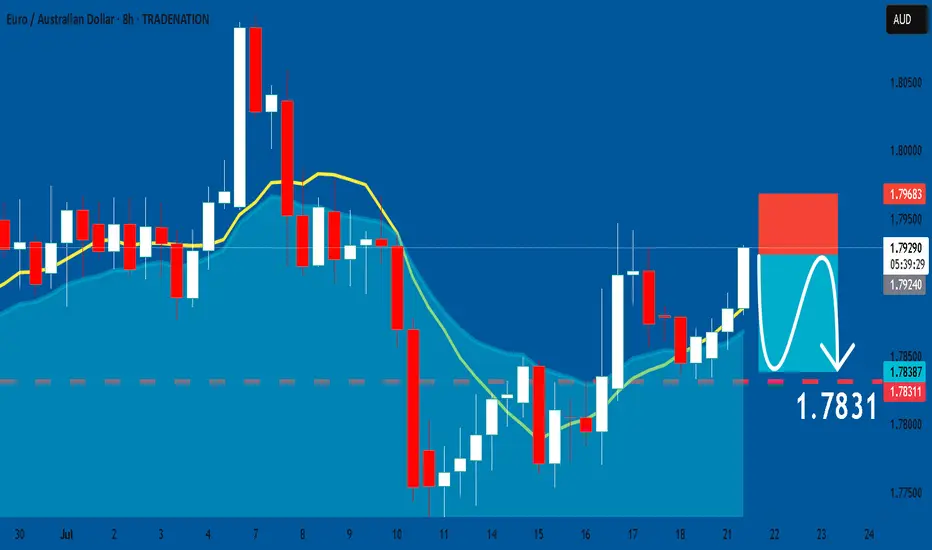
EURAUD: Short Signal Explained
EURAUD
- Classic bearish pattern
- Our team expects retracement
SUGGESTED TRADE:
Swing Trade
Sell EURAUD
Entry - 1.7924
Stop - 1.7968
Take - 1.7831
Our Risk - 1%
Start protection of your profits from lower levels
Disclosure: I am part of Trade Nation's Influencer program and receive a monthly fee for using their TradingView charts in my analysis.
❤️ Please, support our work with like & comment! ❤️
euraud long tradein my opinion this is a good trade with a good r/r
hope hit the tp
consider this is my trade not your trade and i just like to share my trades with world

EUR_AUD WILL GROW|LONG|
✅EUR_AUD is trading in an uptrend
With the pair set to retest
The rising support line
From where I think the growth will continue
LONG🚀
✅Like and subscribe to never miss a new idea!✅
Disclosure: I am part of Trade Nation's Influencer program and receive a monthly fee for using their TradingView charts in my analysis.

EUR-AUD Strong Uptrend! Buy!
Hello, Traders!
EUR-AUD is trading along
The rising support line in a
Strong uptrend so we we are
Bullish biased and as the pair
Is going down to retest the
Support we will be expecting
A rebound and a move up
Buy!
Comment and subscribe to help us grow!
Check out other forecasts below too!
Disclosure: I am part of Trade Nation's Influencer program and receive a monthly fee for using their TradingView charts in my analysis.

EURAUD Buyers In Panic! SELL!
My dear friends,
Please, find my technical outlook for EURAUD below:
The price is coiling around a solid key level - 1.7893
Bias - Bearish
Technical Indicators: Pivot Points Low anticipates a potential price reversal.
Super trend shows a clear sell, giving a perfect indicators' convergence.
Goal - 1.7812
About Used Indicators:
The pivot point itself is simply the average of the high, low and closing prices from the previous trading day.
Disclosure: I am part of Trade Nation's Influencer program and receive a monthly fee for using their TradingView charts in my analysis.
———————————
WISH YOU ALL LUCK
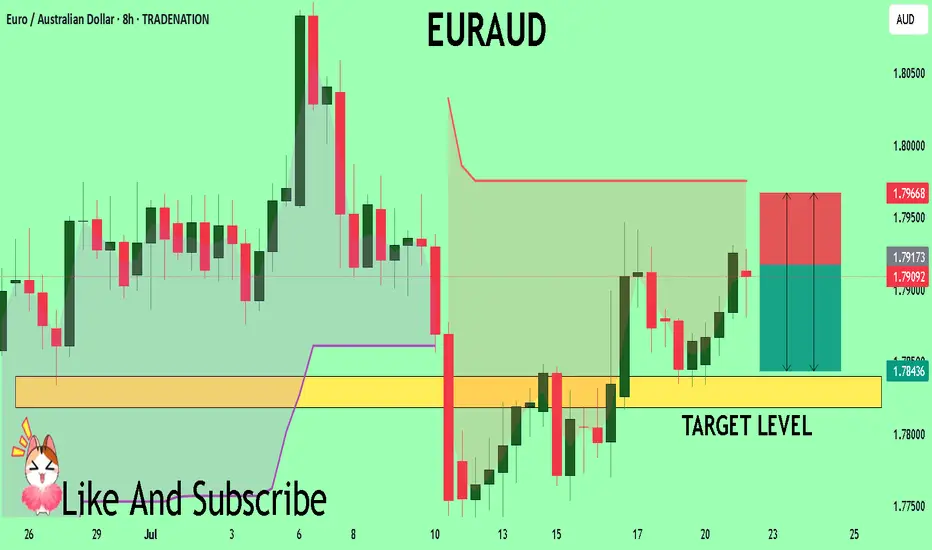
FX Setup of the Day: EURAUD SELL ZONEHey traders 👋
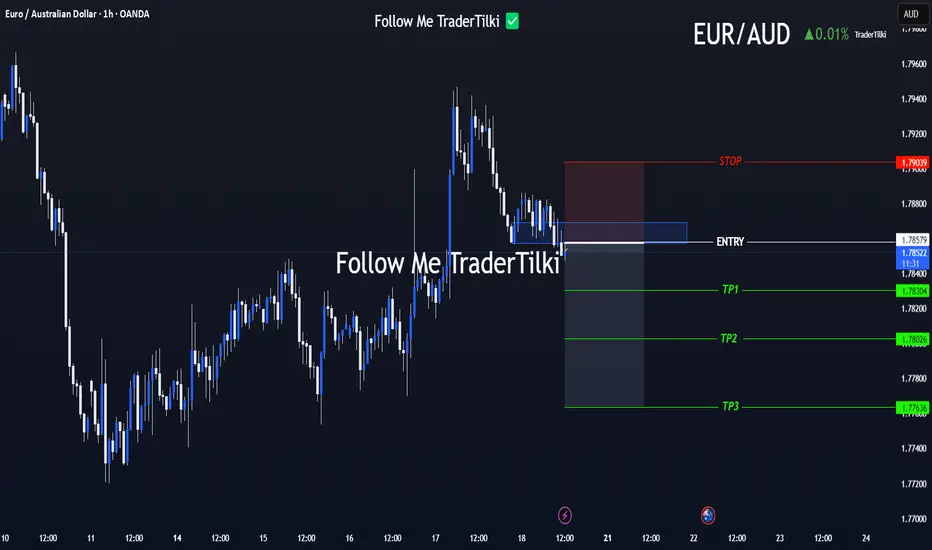
📌 SELL / EURAUD – Technical Breakdown
🟢 Entry: 1.78579
🎯 Target 1: 1.78304
🎯 Target 2: 1.78026
🎯 Target 3: 1.77636
🔴 Stop Loss: 1.79039
📈 Risk/Reward Ratio: 2.00
I’ve carefully validated these levels and crafted a clean, focused analysis for you.
Every like seriously fuels my drive to produce more top-tier content 📈
Your support genuinely means a lot to me.
Thanks from the heart to everyone showing love 💙
🎯 Clear targets, solid strategy.
🤝 Let’s move forward with logic and discipline.
EURAUD Bullish Bias!
HI,Traders !
#EURAUD keeps trading
In an uptrend along the
Rising support line and
We are already seeing a
Bullish rebound so we are
Bullish biased and we will
Be expecting a further
Bullish move up !
Comment and subscribe to help us grow !

EURAUD buy ideaAs expected now price moving in our favoured direction
Took some partials and move stops to breakeven 🤝
EURAUD SELL IDEAWe can only anticipate sells if price breaks out of the trendline,there has been rejection already on H4 due to a reaction from breakerblock.
EURAUD still looks bearish internally and if you look closely you will notice price is forming an expansion
But if price keeps keeps the bullish run which I doubt,we can anticipate the bullish move to continue as it has hit the 3rd touch on the trendline
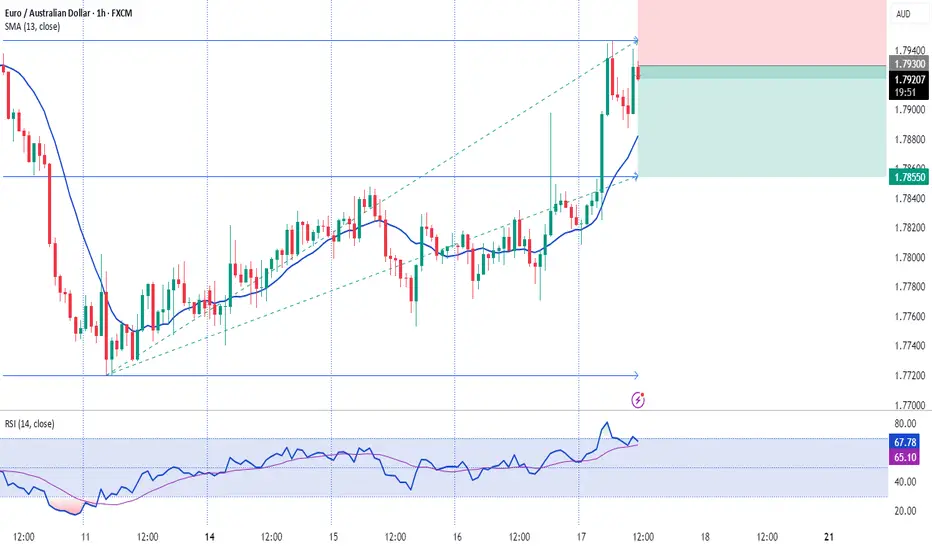
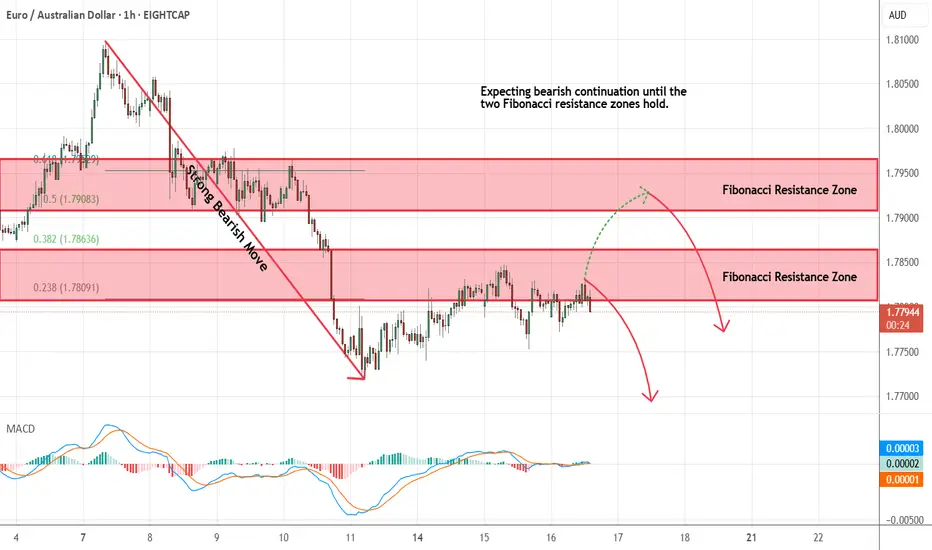
EURAUD - Looking To Sell Pullbacks In The Short TermH1 - Strong bearish move.
No opposite signs.
Currently it looks like a pullback is happening.
Expecting bearish continuation until the two Fibonacci resistance zones hold.
If you enjoy this idea, don’t forget to LIKE 👍, FOLLOW ✅, SHARE 🙌, and COMMENT ✍! Drop your thoughts and charts below to keep the discussion going. Your support helps keep this content free and reach more people! 🚀
--------------------------------------------------------------------------------------------------------------------
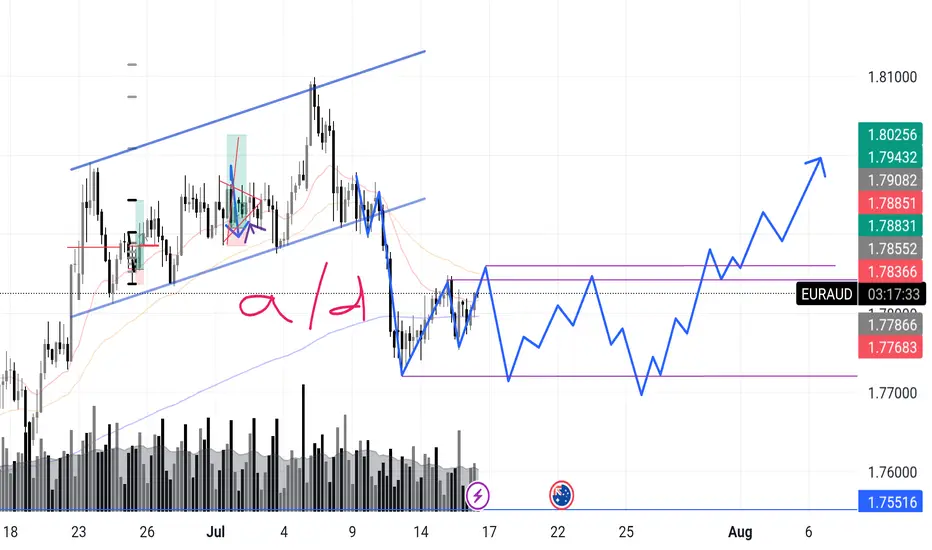
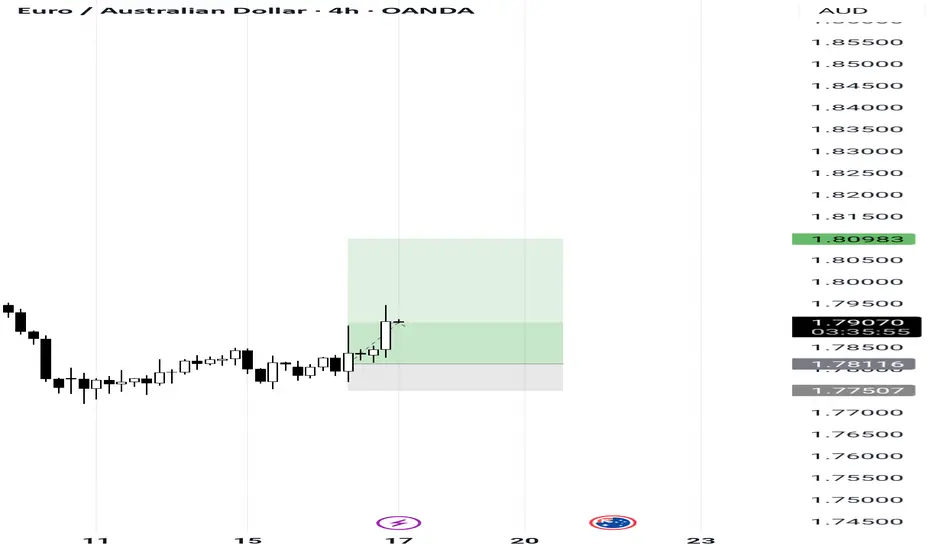
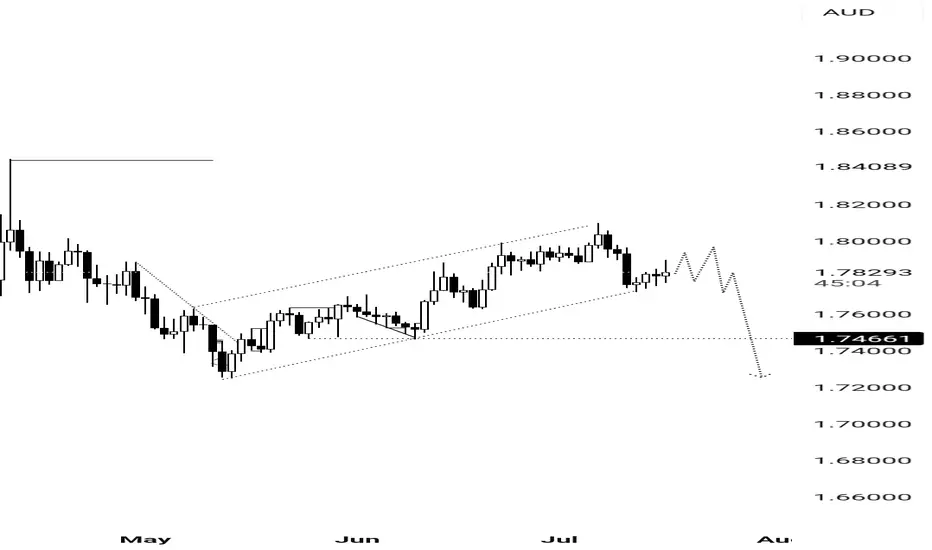
EURAUD – Incoming Upthrust? Accumulation or Distribution? Chart Context:
EURAUD recently completed a sharp markdown after a textbook rising channel break. What’s interesting now is that price has entered what looks like a potential box range between 1.7768 and 1.7885.
I'm anticipating a possible upthrust move into the 1.788x zone — and what follows will reveal the true intent.
Here’s the internal debate:
Are we looking at reaccumulation — smart money trapping shorts before driving higher in line with broader money flow?
Or is this a distribution — where the market builds a false sense of support before deeper downside?
🔍 What tips the scale for now is this:
>The overall money flow direction (via volume patterns + structure) has leaned bullish, so I’m favoring accumulation with a shakeout scenario.
Signs I’m watching:
✅ Absorption volume near the bottom of the range
✅ Higher lows inside the zone
✅ Fake breakout / upthrust into prior structure
❌ Failure to hold above 1.7855 could flip the bias short-term
📉 Expecting one more dip to test demand, followed by range tightening, and if buyers show up strong — the breakout can get explosive.
What’s your take?
Are we prepping for a markup or will this fakeout and roll over?
"I go long or short as close as I can to the danger point, and if the danger becomes real, I close out and take a small loss"