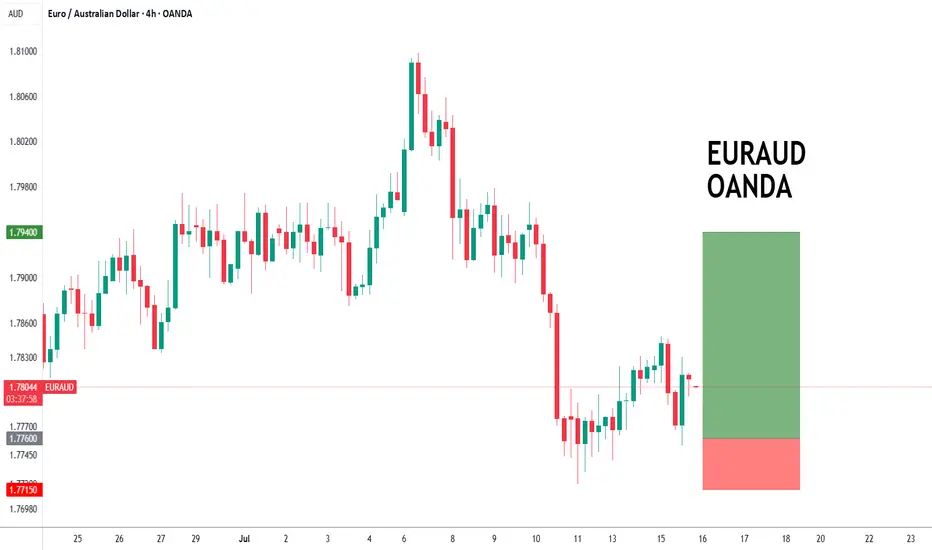
EURAUD forming a bottom?EURAUD - 24h expiry
The primary trend remains bullish.
The selloff has posted an exhaustion count on the daily chart.
Preferred trade is to buy on dips.
Risk/Reward would be poor to call a buy from current levels.
Bespoke support is located at 1.7760.
We look to Buy at 1.7760 (stop at 1.7715)
Our profit targets will be 1.7940 and 1.7970
Resistance: 1.7875 / 1.7950 / 1.8000
Support: 1.7750 / 1.7715 / 1.7670
Risk Disclaimer
The trade ideas beyond this page are for informational purposes only and do not constitute investment advice or a solicitation to trade. This information is provided by Signal Centre, a third-party unaffiliated with OANDA, and is intended for general circulation only. OANDA does not guarantee the accuracy of this information and assumes no responsibilities for the information provided by the third party. The information does not take into account the specific investment objectives, financial situation, or particular needs of any particular person. You should take into account your specific investment objectives, financial situation, and particular needs before making a commitment to trade, including seeking advice from an independent financial adviser regarding the suitability of the investment, under a separate engagement, as you deem fit.
You accept that you assume all risks in independently viewing the contents and selecting a chosen strategy.
Where the research is distributed in Singapore to a person who is not an Accredited Investor, Expert Investor or an Institutional Investor, Oanda Asia Pacific Pte Ltd (“OAP“) accepts legal responsibility for the contents of the report to such persons only to the extent required by law. Singapore customers should contact OAP at 6579 8289 for matters arising from, or in connection with, the information/research distributed.
EURAUD
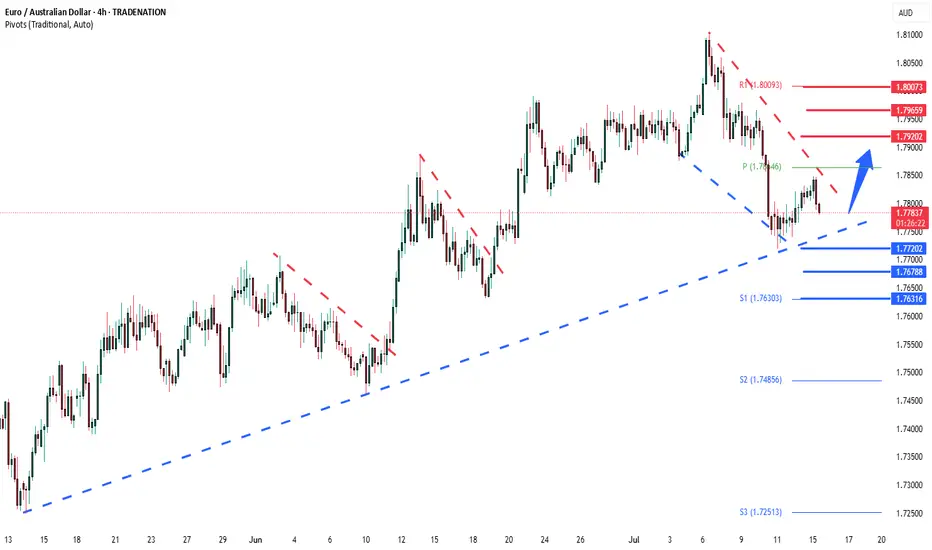
EURAUD Bullish support at 1.7720The EURAUD remains in a bullish trend, with recent price action showing signs of a corrective pullback within the broader uptrend.
Support Zone: 1.7720 – a key level from previous consolidation. Price is currently testing or approaching this level.
A bullish rebound from 1.7720 would confirm ongoing upside momentum, with potential targets at:
1.7920 – initial resistance
1.7970 – psychological and structural level
1.8000 – extended resistance on the longer-term chart
Bearish Scenario:
A confirmed break and daily close below 1.7720 would weaken the bullish outlook and suggest deeper downside risk toward:
1.7680 – minor support
1.7630 – stronger support and potential demand zone
Outlook:
Bullish bias remains intact while the EURAUD holds above 1.7720. A sustained break below this level could shift momentum to the downside in the short term.
This communication is for informational purposes only and should not be viewed as any form of recommendation as to a particular course of action or as investment advice. It is not intended as an offer or solicitation for the purchase or sale of any financial instrument or as an official confirmation of any transaction. Opinions, estimates and assumptions expressed herein are made as of the date of this communication and are subject to change without notice. This communication has been prepared based upon information, including market prices, data and other information, believed to be reliable; however, Trade Nation does not warrant its completeness or accuracy. All market prices and market data contained in or attached to this communication are indicative and subject to change without notice.
Bullish reversal?EUR/AUD has bounced off the support level which is an overlap support that aligns with the 61.8% Fibonacci retracement and could rise from this level to our take profit.
Entry: 1.77003
Why we like it:
There is an overlap support level that lines up with the 61.8% Fibonacci retracement.
Stop loss: 1.74799
Why we like it:
There is a pullback support.
Take profit: 1.7974
Why we lik e it:
There is a pullback resistance that lines up with the 61.8% Fibonacci retracement.
Enjoying your TradingView experience? Review us!
Please be advised that the information presented on TradingView is provided to Vantage (‘Vantage Global Limited’, ‘we’) by a third-party provider (‘Everest Fortune Group’). Please be reminded that you are solely responsible for the trading decisions on your account. There is a very high degree of risk involved in trading. Any information and/or content is intended entirely for research, educational and informational purposes only and does not constitute investment or consultation advice or investment strategy. The information is not tailored to the investment needs of any specific person and therefore does not involve a consideration of any of the investment objectives, financial situation or needs of any viewer that may receive it. Kindly also note that past performance is not a reliable indicator of future results. Actual results may differ materially from those anticipated in forward-looking or past performance statements. We assume no liability as to the accuracy or completeness of any of the information and/or content provided herein and the Company cannot be held responsible for any omission, mistake nor for any loss or damage including without limitation to any loss of profit which may arise from reliance on any information supplied by Everest Fortune Group.

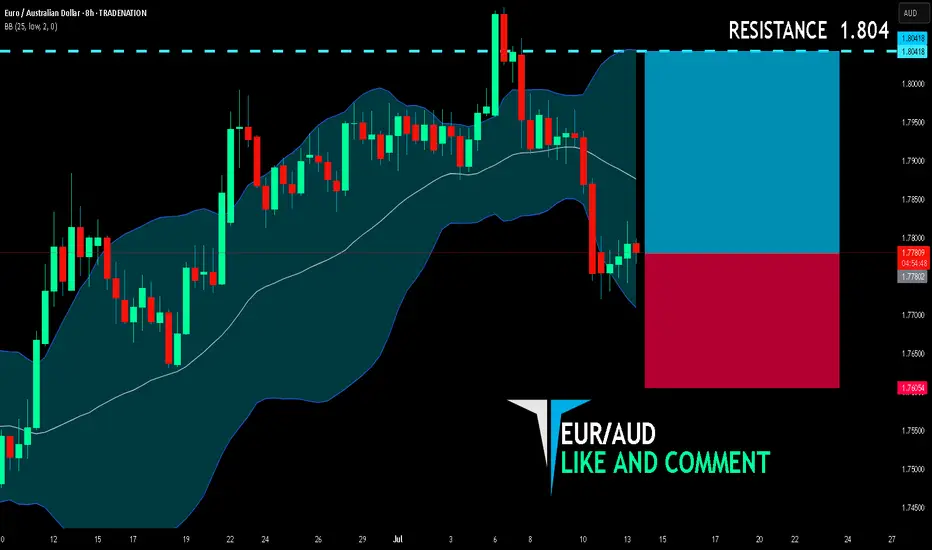
EUR/AUD BULLISH BIAS RIGHT NOW| LONG
EUR/AUD SIGNAL
Trade Direction: long
Entry Level: 1.778
Target Level: 1.804
Stop Loss: 1.760
RISK PROFILE
Risk level: medium
Suggested risk: 1%
Timeframe: 8h
Disclosure: I am part of Trade Nation's Influencer program and receive a monthly fee for using their TradingView charts in my analysis.
✅LIKE AND COMMENT MY IDEAS✅
EURUAD is in the Buy direction from the Third TouchHello Traders
In This Chart EUR/AUD 4 HOURLY Forex Forecast By FOREX PLANET
today EUR/AUD analysis 👆
🟢This Chart includes_ (EUR/AUD market update)
🟢What is The Next Opportunity on EUR/AUD Market
🟢how to Enter to the Valid Entry With Assurance Profit
This CHART is For Trader's that Want to Improve Their Technical Analysis Skills and Their Trading By Understanding How To Analyze The Market Using Multiple Timeframes and Understanding The Bigger Picture on the Charts

EUR_AUD WILL GO UP|LONG|
✅EUR_AUD is trading in an uptrend
And the bullish bias is confirmed
By the rebound we are seeing
After the pair retested the support
So I think the growth will continue
LONG🚀
✅Like and subscribe to never miss a new idea!✅
Disclosure: I am part of Trade Nation's Influencer program and receive a monthly fee for using their TradingView charts in my analysis.

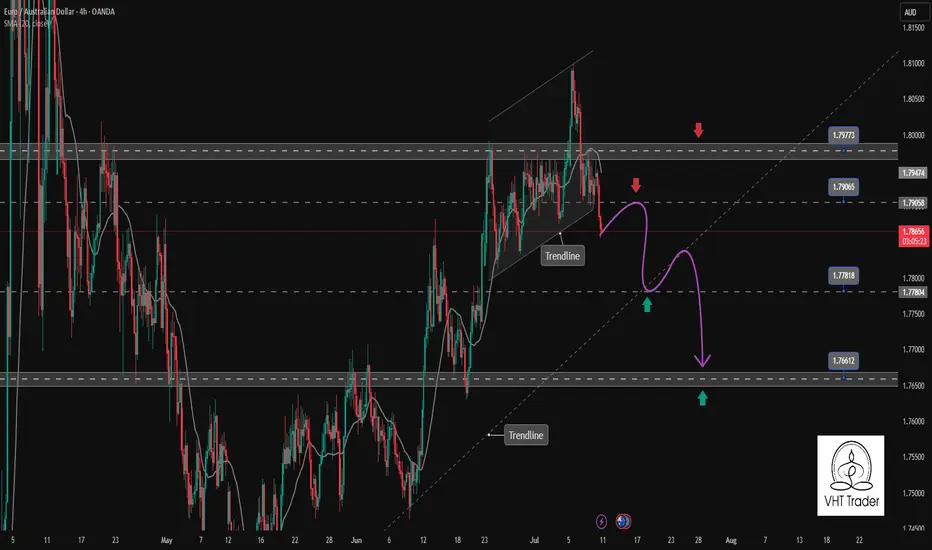
EURAUD Weekly Trade Setup(14 to 18th July 2025) - Head&ShoulderThis week, EURAUD (Euro/Australian Dollar) has entered a critical price zone, providing a textbook technical opportunity for traders. A clear Head & Shoulders pattern has formed on the 4-hour chart, pointing toward a potential trend reversal from bullish to bearish.
Let’s explore how to trade this intelligently from both bullish and bearish perspectives.
1. Bearish Setup – Head & Shoulders Pattern Breakdown
This is the primary trade idea for the week.
✅ Trade Logic:
Price has completed a classic Left Shoulder → Head → Right Shoulder formation.
The neckline (support) will be tested.
The current price is will pulling back to retest the right shoulder resistance zone, offering an ideal short opportunity.
🔻 Entry Plan:
Wait for bearish reversal confirmation (candlestick rejection or bearish engulfing) on the 1H or 4H timeframe.
Enter short once confirmation appears near 1.7850–1.7900.
📉 Stop Loss:
Place SL above the right shoulder high, adjusting for volatility and swing high (around 1.7950).
🎯 Targets:
Target zone: 1.7450–1.7500 (profit booking zone marked on the chart)
Potential Risk/Reward Ratio: 1:2, 1:3, or even 1:4+
2. Alternative Bullish Setup – Reversal at Neckline (High Risk)
This setup is for experienced or aggressive traders who spot early reversals.
✅ Trade Logic:
Price may bounce from the neckline and 200 EMA support area.
If this happens, a temporary bullish reversal may push price back toward the right shoulder zone.
🔺 Entry Plan:
Wait for bullish confirmation (reversal candle) near the neckline and EMA support (around 1.7700).
🚨 Stop Loss:
SL must be below the neckline swing low (around 1.7650).
🎯 Targets:
Resistance zone (right shoulder): 1.7850–1.7900
R:R setups of 1:2 or 1:3 possible
⚠️ This is considered a counter-trend trade and should be traded with caution.
3. Technical Confluence and Indicators
Pattern: Head & Shoulders (bearish reversal)
EMA 200: Price reacting around the long-term trend line
Support/Resistance: Cleanly defined horizontal zones
Reversal zones: Highlighted in red (supply) and green (demand)
4. Final Thoughts
This week’s EURAUD setup is a strong example of structure-based trading. With a well-formed head and shoulders pattern and a clean neckline break, the market signals a shift in momentum.
Safe Approach: Trade the short side after resistance rejection.
Risky Approach: Try a long on neckline bounce with tight SL.
Always confirm with your system and maintain strict risk management. Trade what you see, not what you feel.
Ready to trade? Save this setup, monitor price action, and execute only with confirmation.
=================================================================
Disclosure: I am part of Trade Nation's Influencer program and receive a monthly fee for using their TradingView charts in my analysis.
=================================================================

EUR-AUD Bullish Bias! Buy!
Hello,Traders!
EUR-AUD went down but
A strong horizontal support
Level is below around 1.7690
And as the pair is trading in
An uptrend we will be expecting
A round and a move up
On Monday!
Buy!
Comment and subscribe to help us grow!
Check out other forecasts below too!
Disclosure: I am part of Trade Nation's Influencer program and receive a monthly fee for using their TradingView charts in my analysis.

EURAUD Breakdown Incoming? Price + COT + Seasonality🧠 MACRO & INSTITUTIONAL FLOWS (COT)
EURO (EUR)
Strong increase in net long positions by non-commercials: +16,146
Commercials also added long exposure: +25,799
Bias: moderately bullish
AUSTRALIAN DOLLAR (AUD)
Non-commercials remain heavily net short (long/short ratio: 15% vs 63.6%)
Slight increase in commercial longs: +2,629
Bias: still bearish, but showing early signs of positioning exhaustion
COT Conclusion: EUR remains strong, AUD remains weak — but the recent extension calls for caution on fresh EURAUD longs.
📊 SEASONALITY (JULY)
EUR shows historically positive July performance across 2Y, 5Y, and 10Y averages
AUD also shows mild strength, but less consistent
🔎 Net differential: No strong seasonal edge on EURAUD in July
📈 RETAIL SENTIMENT
54% of retail traders are short EURAUD, 46% long
Slight contrarian bullish bias, but not extreme yet → neutral to slightly long
📉 TECHNICAL STRUCTURE – MULTI-TIMEFRAME
1. Weekly Chart
Strong bearish engulfing candle after 4 weeks of upside
RSI dropped below 50 → clear momentum shift
1.7960–1.8100 is now a liquidity zone that’s been tapped
2. Daily Chart
Confirmed break of the ascending channel formed since May
Price reacted from demand zone around 1.7460–1.7720, signaling potential pullback
Watch for rejection around 1.7910 (50% body of the weekly engulfing candle)
3. Entry Setup
Key area for short entries: 1.7910–1.7940
This zone aligns with:
✅ Former support now turned resistance
✅ Inside a valid bearish order block
✅ Ideal retracement level (50% engulfing body)
🎯 OPERATIONAL CONCLUSION
While the macro context still favors a stronger EUR against AUD, price action tells another story.
The weekly engulfing candle is a strong technical reversal signal, and the daily structure confirms the break.
→ Shorting the pullback into 1.7910–1.7940 could offer an excellent R/R trade setup.
Bias: Short-term bearish – Targeting 1.7700, 1.7550, and potentially 1.7315
Invalidation: Daily close above 1.8040

EURAUD: Expecting Bullish Movement! Here is Why:
It is essential that we apply multitimeframe technical analysis and there is no better example of why that is the case than the current EURAUD chart which, if analyzed properly, clearly points in the upward direction.
Disclosure: I am part of Trade Nation's Influencer program and receive a monthly fee for using their TradingView charts in my analysis.
❤️ Please, support our work with like & comment! ❤️

EURAUD confirms the continuation of the bearish correction trendEURAUD has just broken the rising channel to start a downtrend. The confirmation is there with the h4 candle closing completely below the support zone of the Price Channel. This corrective downtrend can now extend to the support of 1.766. The support zone is a Break point at the moment 1.778 is a positive DCA point with a SELL Entry above.
Support: 1.778-1.766
Resistance: 1.790-1.797
Sell now: Resistance zone 1.79000
Target: 1.778 Support zone, followed by 1.766 lower zone
Sell Trigger: Break below 1.778
BUY Trigger: rejection 1.778 Support zone
Leave your comments on the idea. I am happy to read your views.
EURUAD is in the Buy direction from the Third Touch Hello Traders
In This Chart EUR/AUD 4 HOURLY Forex Forecast By FOREX PLANET
today EUR/AUD analysis 👆
🟢This Chart includes_ (EUR/AUD market update)
🟢What is The Next Opportunity on EUR/AUD Market
🟢how to Enter to the Valid Entry With Assurance Profit
This CHART is For Trader's that Want to Improve Their Technical Analysis Skills and Their Trading By Understanding How To Analyze The Market Using Multiple Timeframes and Understanding The Bigger Picture on the Charts

EURAUD Set To Grow! BUY!
My dear followers,
This is my opinion on the EURAUD next move:
The asset is approaching an important pivot point 1.7833
Bias - Bullish
Safe Stop Loss - 1.7781
Technical Indicators: Supper Trend generates a clear long signal while Pivot Point HL is currently determining the overall Bullish trend of the market.
Goal - 1.7932
About Used Indicators:
For more efficient signals, super-trend is used in combination with other indicators like Pivot Points.
Disclosure: I am part of Trade Nation's Influencer program and receive a monthly fee for using their TradingView charts in my analysis.
———————————
WISH YOU ALL LUCK

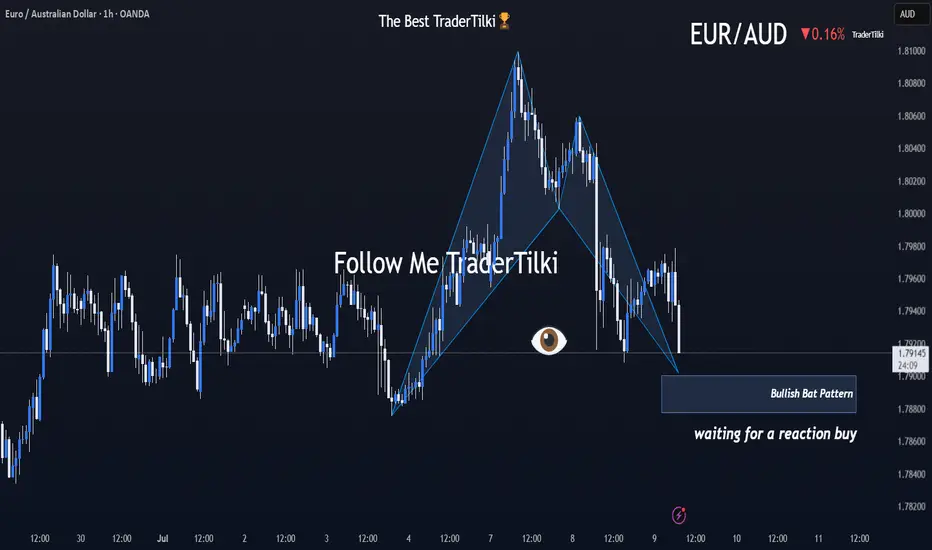
Brace Yourselves: EURAUD’s Harmonic Storm Is Coming!Good morning, Traders ☀️
I've identified a bullish harmonic Bat pattern on the EURAUD pair.
At this stage, I'm only anticipating a reactional buy from the marked zone.
I'll determine my target level after observing the market's response from that area.
📌 I’ll be sharing the target details under this post once the reaction unfolds.
Your likes and support are what keep me motivated to share these analyses consistently.
Huge thanks to everyone who shows love and appreciation! 🙏
EURAUD sell signal. Don't forget about stop-loss.
Write in the comments all your questions and instruments analysis of which you want to see.
Friends, push the like button, write a comment, and share with your mates - that would be the best THANK YOU.
P.S. I personally will open entry if the price will show it according to my strategy.
Always make your analysis before a trade

EURAUD support retest at 1.7880The EURAUD currency pair maintains a bullish bias, underpinned by the prevailing upward trend. Recent sideways consolidation in intraday price action suggests a potential continuation pattern within the broader uptrend.
The key level to watch is 1.7880, marking the lower boundary of the recent consolidation range. A corrective pullback toward this level, followed by a bullish bounce, could trigger a fresh rally targeting resistance levels at 1.8020, then 1.8060, and potentially 1.8090 over the medium term.
Conversely, a decisive breakdown below 1.7880, confirmed by a daily close beneath this support, would invalidate the current bullish outlook. This would expose the pair to deeper retracement targets near 1.7840, followed by 1.7810.
Trend Bias: Bullish above 1.7880
Key Support: 1.7880, 1.7840, 1.7810
Key Resistance: 1.8020, 1.8060, 1.8090
Conclusion:
EURAUD remains technically constructive while holding above 1.7880. Traders should monitor this level for bullish continuation signals. A bounce from this zone could reinforce the uptrend, while a break and close below it would shift momentum and open the door for a deeper corrective move.
This communication is for informational purposes only and should not be viewed as any form of recommendation as to a particular course of action or as investment advice. It is not intended as an offer or solicitation for the purchase or sale of any financial instrument or as an official confirmation of any transaction. Opinions, estimates and assumptions expressed herein are made as of the date of this communication and are subject to change without notice. This communication has been prepared based upon information, including market prices, data and other information, believed to be reliable; however, Trade Nation does not warrant its completeness or accuracy. All market prices and market data contained in or attached to this communication are indicative and subject to change without notice.

EURAUD Local Long!
HI Traders !
#EURAUD is trading in an
Uptrend and the pair is
About to retest a horizontal
Support of 1.79749 and as
We are locally bullish biased
We will be expecting a
Local bullish rebound !
Comment and subscribe to help us grow !

EURAUD - Bearish... but not for long!Hello TradingView Family / Fellow Traders. This is Richard, also known as theSignalyst.
As per our last EURAUD analysis, attached on the chart, it rejected the upper bound of the blue channel and traded lower.
What's next?
📈EURAUD is now retesting the lower bound of the channel.
Moreover, the blue zone is a strong demand.
🏹 Thus, the highlighted blue circle is a strong area to look for buy setups as it is the intersection of the lower blue trendline and demand.
📚 As per my trading style:
As #EURAUD is around the blue circle zone, I will be looking for bullish reversal setups (like a double bottom pattern, trendline break , and so on...)
📚 Always follow your trading plan regarding entry, risk management, and trade management.
Good luck!
All Strategies Are Good; If Managed Properly!
~Rich
Disclosure: I am part of Trade Nation's Influencer program and receive a monthly fee for using their TradingView charts in my analysis.

EUR/AUD Made Perfect Breakout , Long Setup Valid To Get 150 PipsHere is My 2H T.F Chart and if we have a look we will see that we have a very good breakout after this ascending triangle , the price finally closed above neckline for this pattern and we have a good confirmation so i`m waiting the price to go back to retest this broken neckline and then we can enter a buy trade . and if the price closed below my neckline with daily candle then this idea will not be valid anymore .

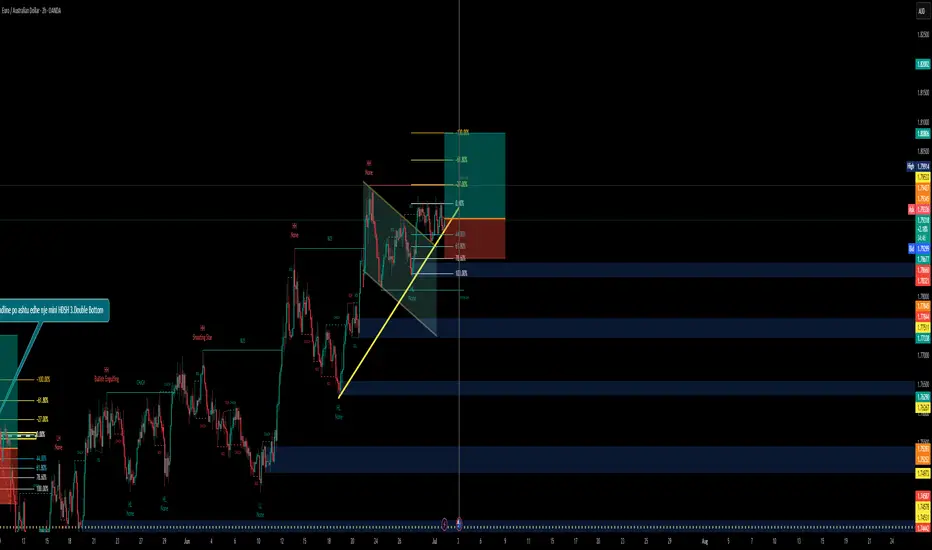
EURAUDBullish Continuation from a Bull Flag Pattern + Break of Structure
Bull Flag Pattern Formed
After a strong impulsive bullish move, the price forms a consolidation channel (flag), sloping slightly downward.
This is a classic bull flag pattern, indicating bullish continuation.
Break of Structure (BOS) Confirmed
The price broke above the flag, showing a BOS (Break of Structure) to the upside.
This confirms a potential continuation of the uptrend.
Fibonacci Confluence
Price retraced to the 61.8–78.6% Fibonacci zone (golden zone), which often acts as a strong reversal area in trending markets.
This gives a good risk-to-reward (R:R) opportunity.
Higher Highs and Higher Lows (Market Structure)
The market is forming HHs (Higher Highs) and HLs (Higher Lows) – typical of a healthy uptrend.
Demand Zones Below
Several demand zones (blue boxes) support price if it retraces.
The strong low marked adds structure-based support beneath the trade entry.
Risk-to-Reward (R:R) Setup
You’ve set a tight stop loss below structure and a larger take profit aiming at the -61.8% and 100% Fib extensions – a favorable R:R ratio
EUR-AUD Will Fall! Sell!
Hello,Traders!
EUR-AUD keeps trading in
A strong uptrend and the pair
Is locally overbought so as the
Pair is retesting a horizontal
Resistance of 1.8019 from
Where we will be expecting
A local pullback on Monday
Sell!
Comment and subscribe to help us grow!
Check out other forecasts below too!
Disclosure: I am part of Trade Nation's Influencer program and receive a monthly fee for using their TradingView charts in my analysis.

EUR_AUD LOCAL CORRECTION|SHORT|
✅EUR_AUD is set to retest a
Strong resistance level above at 1.8020
After trading in a local uptrend for some time
Which makes a bearish pullback a likely scenario
With the target being a local support below at 1.7940
SHORT🔥
✅Like and subscribe to never miss a new idea!✅
Disclosure: I am part of Trade Nation's Influencer program and receive a monthly fee for using their TradingView charts in my analysis.

EUR/AUD 1H – Decision Point Ahead Breakout or Fakeout? Eyes on Confirmation Zone 👁️
EUR/AUD has finally tapped into a critical resistance at 1.79900, a level previously rejected with high volatility. The current price action is testing this ceiling, with signs of strength — but smart money waits for confirmation.
What We’re Seeing:
🔹 Uptrend Intact: All EMAs are aligned in bullish order.
🔹 Bullish Fair Value Gap (FVG) formed below — a potential area of demand.
🔹 Price now hovering inside the Confirmation Zone — marked by previous highs and psychological resistance.
🔹 Volume building gradually — but breakout volume not confirmed yet.
⚖️ Summary:
Trend: Upward
Structure: Breakout under test
Momentum: Bullish
Market Phase: Confirmation / decision point
Key Behavior: Watch for commitment or rejection without predicting it
