EURAUD Short Term Buy Idea Follow UpHi Traders, on March 13th I shared this "EURAUD Short Term Buy Idea"
We had a strong bullish momentum on the 4H chart and I mentioned that I expect pullbacks towards the marked key support zones and then a potential continuation higher.
Price has currently reached the first key support zone with the price developing a bullish divergence. Expecting the price to potentially move higher further from the first key support zone.
Until both the key support zones hold my short term view still remains bullish here.
If you enjoy this idea, don’t forget to LIKE 👍, FOLLOW ✅, SHARE 🙌, and COMMENT ✍! Drop your thoughts and charts below to keep the discussion going. Your support helps keep this content free and reach more people! 🚀
---------------------------------------------------------------------------------------------------------------------
Disclosure: I am part of Trade Nation's Influencer program and receive a monthly fee for using their TradingView charts in my analysis.
EURAUD

EURAUD Corrective pullback supported at 1.0750
The EURAUD currency pair maintains a bullish sentiment, supported by the prevailing long-term uptrend. However, recent price action suggests an overextended bullish breakout, approaching significant resistance zones on both daily and weekly timeframes.
The key trading level to watch is 1.7050. A potential overbought pullback from current levels, followed by a bullish rebound from 1.7050, could extend the upside, targeting 1.7320, with further resistance at 1.7676 and 1.7800 over a longer timeframe.
Conversely, a confirmed break below 1.7050, with a daily close under this level, could signal a corrective pullback towards 1.6880 and 1.6800.
Conclusion:
While the broader trend remains bullish, the current overextended move suggests the possibility of short-term retracements. Holding 1.7050 as support will be critical for further upside continuation, while a breakdown below this level could trigger deeper corrections. Traders should monitor price action closely and adjust risk management accordingly.
This communication is for informational purposes only and should not be viewed as any form of recommendation as to a particular course of action or as investment advice. It is not intended as an offer or solicitation for the purchase or sale of any financial instrument or as an official confirmation of any transaction. Opinions, estimates and assumptions expressed herein are made as of the date of this communication and are subject to change without notice. This communication has been prepared based upon information, including market prices, data and other information, believed to be reliable; however, Trade Nation does not warrant its completeness or accuracy. All market prices and market data contained in or attached to this communication are indicative and subject to change without notice.

TradingView Idea for EUR/AUD (4H Chart)
Market Overview:
The EUR/AUD 4-hour chart displays a downtrend followed by a consolidation phase at a critical support zone. The price is currently reacting within a demand area, indicating a potential bullish reversal.
Key Levels:
Support Zone: ~1.7050 - 1.7100 (Highlighted in dark grey)
Resistance Zone: ~1.7200 (Short-term)
Target Level: ~1.74217
Potential Trade Scenarios:
Bullish Scenario: If the price holds above the support zone, we could see a rebound towards 1.7200, with further continuation towards the 1.74217 target.
Retest and Breakout: A slight pullback into the support zone, followed by a breakout above 1.7200, could confirm a strong buying momentum.
Bearish Risk: A failure to hold above support may lead to further downside continuation.
Trade Plan:
Entry: Look for bullish confirmation in the demand zone.
Stop Loss: Below the support zone (~1.7050).
Take Profit: First at 1.7200, then 1.74217 for an extended move.
Bias: Bullish if support holds, bearish if price breaks below.

EUR_AUD SUPPORT AHEAD|LONG|
✅EUR_AUD is making a bearish
Correction and will soon retest a
Key support level of 1.7100
While trading in a strong uptrend
So I think that the pair will make a rebound
And go up to retest the supply level above at 1.7260
LONG🚀
✅Like and subscribe to never miss a new idea!✅
Disclosure: I am part of Trade Nation's Influencer program and receive a monthly fee for using their TradingView charts in my analysis.

EURAUD The Week Ahead 17th March ‘25The EURAUD currency pair maintains a bullish sentiment, supported by the prevailing long-term uptrend. However, recent price action suggests an overextended bullish breakout, approaching significant resistance zones on both daily and weekly timeframes.
The key trading level to watch is 1.7050. A potential overbought pullback from current levels, followed by a bullish rebound from 1.7050, could extend the upside, targeting 1.7320, with further resistance at 1.7676 and 1.7800 over a longer timeframe.
Conversely, a confirmed break below 1.7050, with a daily close under this level, could signal a corrective pullback towards 1.6880 and 1.6800.
Conclusion:
While the broader trend remains bullish, the current overextended move suggests the possibility of short-term retracements. Holding 1.7050 as support will be critical for further upside continuation, while a breakdown below this level could trigger deeper corrections. Traders should monitor price action closely and adjust risk management accordingly.
This communication is for informational purposes only and should not be viewed as any form of recommendation as to a particular course of action or as investment advice. It is not intended as an offer or solicitation for the purchase or sale of any financial instrument or as an official confirmation of any transaction. Opinions, estimates and assumptions expressed herein are made as of the date of this communication and are subject to change without notice. This communication has been prepared based upon information, including market prices, data and other information, believed to be reliable; however, Trade Nation does not warrant its completeness or accuracy. All market prices and market data contained in or attached to this communication are indicative and subject to change without notice.

EUR/AUD "Euro vs Aussie" Forex Market Bearish Heist Plan🌟Hi! Hola! Ola! Bonjour! Hallo!🌟
Dear Money Makers & Robbers, 🤑 💰🐱👤🐱🏍
Based on 🔥Thief Trading style technical and fundamental analysis🔥, here is our master plan to heist the EUR/AUD "Euro vs Aussie" Forex Market. Please adhere to the strategy I've outlined in the chart, which emphasizes short entry. Our aim is the high-risk Green Zone. Risky level, oversold market, consolidation, trend reversal, trap at the level where traders and bullish robbers are stronger. 🏆💸Book Profits Be wealthy and safe trade.💪🏆🎉
Entry 📈 : "The vault is wide open! Swipe the Bearish loot at any price - the heist is on!
however I advise placing Sell limit orders within a 15 or 30 minute timeframe. Entry from the most recent or closest low or high level should be in retest.
Stop Loss 🛑: Thief SL placed at 1.66000 (swing Trade Basis) Using the 4H period, the recent / nearest low or high level.
SL is based on your risk of the trade, lot size and how many multiple orders you have to take.
Target 🎯:
Primary Target - 1.62700 (or) Escape Before the Target
Secondary Target - 1.61000 (or) Escape Before the Target
Scalpers, take note 👀 : only scalp on the Short side. If you have a lot of money, you can go straight away; if not, you can join swing traders and carry out the robbery plan. Use trailing SL to safeguard your money 💰.
📰🗞️Fundamental, Macro, COT, Sentimental Outlook:
EUR/AUD "Euro vs Aussie" Forex Market is currently experiencing a Bearish trend., driven by several key factors.
🌞Market Overview
Current Price: 1.64624
30-Day High: 1.6734
30-Day Low: 1.5931
30-Day Average: 1.6231
🌞Fundamental Analysis
Economic Trends: The European economy is expected to grow, driven by a rebound in consumer spending and investment
Interest Rates: The European Central Bank is expected to maintain low interest rates, supporting the euro
🌞Macro Economics
Global Economic Trends: The ongoing global economic recovery is expected to drive up demand for commodities, including Australian exports
Inflation Rate: Global inflation is expected to rise to 3.8% in 2025, potentially increasing demand for commodities and supporting the Australian dollar
Interest Rates: Central banks are expected to maintain low interest rates in 2025, supporting currency markets
🌞COT Data
Non-Commercial Traders (Institutional):
Net Short Positions: 40%
Open Interest: 80,000 contracts
Commercial Traders (Companies):
Net Long Positions: 25%
Open Interest: 50,000 contracts
Non-Reportable Traders (Small Traders):
Net Short Positions: 35%
Open Interest: 30,000 contracts
COT Ratio: 1.8 (indicating a bearish trend)
🌞Sentimental Analysis
Institutional Sentiment: 55% bearish, 45% bullish
Retail Sentiment: 50% bearish, 50% bullish
Market Mood: The overall market mood is bearish, with a sentiment score of -20
🌞Positioning Analysis
Institutional Traders: Net short positions increased by 10% over the past week, indicating growing bearish sentiment
Retail Traders: Net short positions decreased by 5% over the past week, indicating decreasing bearish sentiment
Leverage: The average leverage used by traders has decreased to 2.2, indicating decreasing confidence in the market
🌞Overall Outlook
The overall outlook for EUR/AUD is bearish, driven by a combination of fundamental, technical, and sentimental factors. The expected growth in the Australian economy, low interest rates, and bearish market sentiment are all supporting the bearish trend. However, investors should remain cautious of potential upside risks, including changes in global economic trends and unexpected regulatory developments.
⚠️Trading Alert : News Releases and Position Management 📰 🗞️ 🚫🚏
As a reminder, news releases can have a significant impact on market prices and volatility. To minimize potential losses and protect your running positions,
we recommend the following:
Avoid taking new trades during news releases
Use trailing stop-loss orders to protect your running positions and lock in profits
📌Please note that this is a general analysis and not personalized investment advice. It's essential to consider your own risk tolerance and market analysis before making any investment decisions.
📌Keep in mind that these factors can change rapidly, and it's essential to stay up-to-date with market developments and adjust your analysis accordingly.
💖Supporting our robbery plan will enable us to effortlessly make and steal money 💰💵 Tell your friends, Colleagues and family to follow, like, and share. Boost the strength of our robbery team. Every day in this market make money with ease by using the Thief Trading Style.🏆💪🤝❤️🎉🚀
I'll see you soon with another heist plan, so stay tuned 🤑🐱👤🤗🤩

EUR-AUD Will Go UP! Buy!
Hello,Traders!
EUR-AUD is trading in an
Uptrend and we are now
Seeing a nice bullish reaction
From the horizontal support
Of 1.7153 which reinforces our
Bullish bias and we will be
Expecting the pair grow more
With the target of 1.7417
Buy!
Comment and subscribe to help us grow!
Check out other forecasts below too!
Disclosure: I am part of Trade Nation's Influencer program and receive a monthly fee for using their TradingView charts in my analysis.

EURAUD, LONG rebound from the 8 EMAEURAUD, Rebound from the 8 EMA to the 1h orderblock and after that i expect a downside to the 38.2% fibbonacci level on daily timeframe.


EURAUD Short Term Buy IdeaH4 - Strong bullish momentum
Currently it looks like a correction is happening
Until the two key support zones hold my short term view remain bullish here.

EUR/AUD D Closure Is Amazing , Short Setup Valid To Get 250 PipsWe have a very good daily closure in bearish in this pair and i think the price will go down a little after this huge movement to upside without any correction , so i think this res will be the best place tp can sell this pair and at least 250 pips target !
This Is An Educational + Analytic Content That Will Teach Why And How To Enter A Trade
Make Sure You Watch The Price Action Closely In Each Analysis As This Is A Very Important Part Of Our Method
Disclaimer : This Analysis Can Change At Anytime Without Notice And It Is Only For The Purpose Of Assisting Traders To Make Independent Investments Decisions.

euraud sell signal. Don't forget about stop-loss.
Write in the comments all your questions and instruments analysis of which you want to see.
Friends, push the like button, write a comment, and share with your mates - that would be the best THANK YOU.
P.S. I personally will open entry if the price will show it according to my strategy.
Always make your analysis before a trade

EURAUD challenging important resistance at 1.7330The EURAUD currency pair maintains a bullish sentiment, supported by the prevailing long-term uptrend. However, recent price action suggests an overextended bullish breakout, approaching significant resistance zones on both daily and weekly timeframes.
The key trading level to watch is 1.7050. A potential overbought pullback from current levels, followed by a bullish rebound from 1.7050, could extend the upside, targeting 1.7320, with further resistance at 1.7676 and 1.7800 over a longer timeframe.
Conversely, a confirmed break below 1.7050, with a daily close under this level, could signal a corrective pullback towards 1.6880 and 1.6800.
Conclusion:
While the broader trend remains bullish, the current overextended move suggests the possibility of short-term retracements. Holding 1.7050 as support will be critical for further upside continuation, while a breakdown below this level could trigger deeper corrections. Traders should monitor price action closely and adjust risk management accordingly.
This communication is for informational purposes only and should not be viewed as any form of recommendation as to a particular course of action or as investment advice. It is not intended as an offer or solicitation for the purchase or sale of any financial instrument or as an official confirmation of any transaction. Opinions, estimates and assumptions expressed herein are made as of the date of this communication and are subject to change without notice. This communication has been prepared based upon information, including market prices, data and other information, believed to be reliable; however, Trade Nation does not warrant its completeness or accuracy. All market prices and market data contained in or attached to this communication are indicative and subject to change without notice.

EURAUD Short Daily Chart Trend line + BB + Fibo E 361.80EURAUD Short Daily Chart Trend line + BB + Fibo E 361.80
It can go down much more than our take profit price

EUR_AUD WIlL KEEP GROWING|LONG|
✅EUR_AUD made a bullish
Breakout of the key horizontal
Level of 1.7162 and the breakout
Is confirmed so we are bullish
Biased and we will be expecting
A further move up
LONG🚀
✅Like and subscribe to never miss a new idea!✅

EURAUD continues to flirt with the highest point of 2024We mentioned this pair last week and told you to keep an eye on the highest point of 2024. And there we are, MARKETSCOM:EURAUD is flirting with that area. If we continue to see the rate struggling to remain above that hurdle, there might be a chance for a slight retracement.
What do you think?
Let's dig in!
FX_IDC:EURAUD
Let us know what you think in the comments below.
Thank you.
74.2% of retail investor accounts lose money when trading CFDs with this provider. You should consider whether you understand how CFDs work and whether you can afford to take the high risk of losing your money. Past performance is not necessarily indicative of future results. The value of investments may fall as well as rise and the investor may not get back the amount initially invested. This content is not intended for nor applicable to residents of the UK. Cryptocurrency CFDs and spread bets are restricted in the UK for all retail clients.

EURAUD Bullish overextended rallyThe EURAUD currency pair maintains a bullish sentiment, supported by the prevailing long-term uptrend. However, recent price action suggests an overextended bullish breakout, approaching significant resistance zones on both daily and weekly timeframes.
The key trading level to watch is 1.7050. A potential overbought pullback from current levels, followed by a bullish rebound from 1.7050, could extend the upside, targeting 1.7320, with further resistance at 1.7676 and 1.7800 over a longer timeframe.
Conversely, a confirmed break below 1.7050, with a daily close under this level, could signal a corrective pullback towards 1.6880 and 1.6800.
Conclusion:
While the broader trend remains bullish, the current overextended move suggests the possibility of short-term retracements. Holding 1.7050 as support will be critical for further upside continuation, while a breakdown below this level could trigger deeper corrections. Traders should monitor price action closely and adjust risk management accordingly.
This communication is for informational purposes only and should not be viewed as any form of recommendation as to a particular course of action or as investment advice. It is not intended as an offer or solicitation for the purchase or sale of any financial instrument or as an official confirmation of any transaction. Opinions, estimates and assumptions expressed herein are made as of the date of this communication and are subject to change without notice. This communication has been prepared based upon information, including market prices, data and other information, believed to be reliable; however, Trade Nation does not warrant its completeness or accuracy. All market prices and market data contained in or attached to this communication are indicative and subject to change without notice.

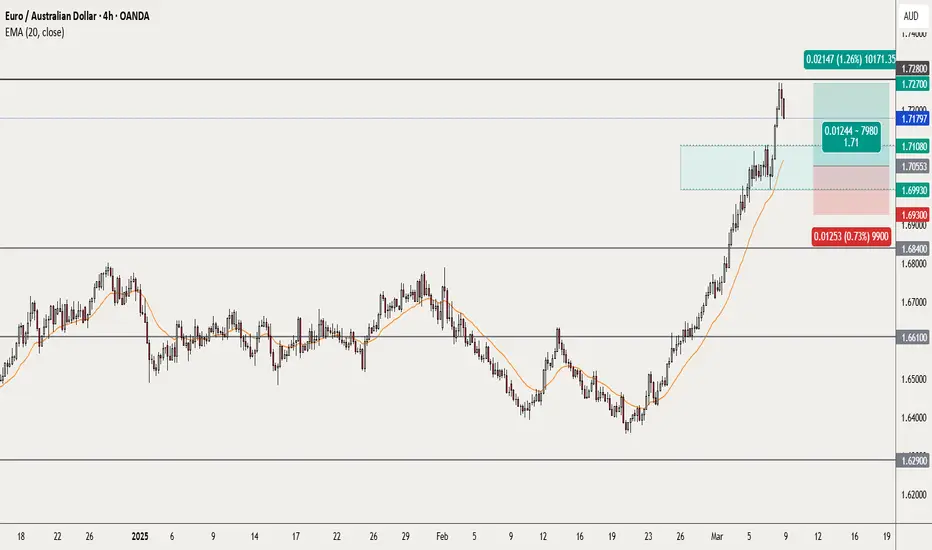
EURAUD looking for value zone to go long ... the week of 10 Mar Weekly – strongly bullish
Daily – strongly bullish
H4 – bullish, now pulling back towards a consolidation zone between 1.7108 and 1.69930 (marked on my chart). 20 ema is also currently located here.
When/If price reaches this zone, I will be monitoring PA on H4 and H1 timeframes with a view to find evidence of a bullish continuation. In the current uncertain US situation, it is vital to establish that control of the market has returned to the bulls, before taking a long trade. Stop can be below the zone (around 1.6930) or a bit lower with the initial target at about 1.7280.
This is not a trade recommendation, merely my own analysis. Trading carries a high level of risk, so only trade with money you can afford to lose and carefully manage your capital and risk. If you like my idea, please give a “boost” and follow me to get even more. Please comment and share your thoughts too!!
It’s not whether you are right or wrong, but how much money you make when you are right and how much you lose when you are wrong – George Soros

EURAUD Will Go Lower! Short!
Here is our detailed technical review for EURAUD.
Time Frame: 1h
Current Trend: Bearish
Sentiment: Overbought (based on 7-period RSI)
Forecast: Bearish
The market is approaching a significant resistance area 1.705.
Due to the fact that we see a positive bearish reaction from the underlined area, I strongly believe that sellers will manage to push the price all the way down to 1.695 level.
P.S
We determine oversold/overbought condition with RSI indicator.
When it drops below 30 - the market is considered to be oversold.
When it bounces above 70 - the market is considered to be overbought.
Like and subscribe and comment my ideas if you enjoy them!

EURAUD to see a turnaround?EURAUD - 24h expiry
We are trading at overbought extremes.
Bearish divergence is expected to cap gains.
The rally is close to a correction count on the daily chart.
We look to Sell a break of 1.6950.
A lower correction is expected.
We look to Sell a break of 1.6950 (stop at 1.7010)
Our profit targets will be 1.6740 and 1.6710
Resistance: 1.7070 / 1.7100 / 1.7250
Support: 1.6950 / 1.6850 / 1.6730
Risk Disclaimer
The trade ideas beyond this page are for informational purposes only and do not constitute investment advice or a solicitation to trade. This information is provided by Signal Centre, a third-party unaffiliated with OANDA, and is intended for general circulation only. OANDA does not guarantee the accuracy of this information and assumes no responsibilities for the information provided by the third party. The information does not take into account the specific investment objectives, financial situation, or particular needs of any particular person. You should take into account your specific investment objectives, financial situation, and particular needs before making a commitment to trade, including seeking advice from an independent financial adviser regarding the suitability of the investment, under a separate engagement, as you deem fit.
You accept that you assume all risks in independently viewing the contents and selecting a chosen strategy.
Where the research is distributed in Singapore to a person who is not an Accredited Investor, Expert Investor or an Institutional Investor, Oanda Asia Pacific Pte Ltd (“OAP“) accepts legal responsibility for the contents of the report to such persons only to the extent required by law. Singapore customers should contact OAP at 6579 8289 for matters arising from, or in connection with, the information/research distributed.

EUR-AUD Strong Resistance Ahead! Sell!
Hello,Traders!
EUR-AUD surged up sharply
And the pair is locally overbought
So after it hits a horizontal resistance
Of 1.7190 from where we will
Be expecting a local bearish
Correction and a move down
Sell!
Comment and subscribe to help us grow!
Check out other forecasts below too!

EURAUD, EURNZD and AUDNZD - Quick technical pieceWe are seeing strong move in the euro just before the ECB rate decision on Thursday. However, let's not forget that we will get some action from the RBA and RBNZ in the first days of April. MARKETSCOM:EURAUD and MARKETSCOM:EURNZD are at key resistance areas, which could be interesting for the sellers. That said, we have not received any reversal signal yet, so the bears need to wait for a bit.
Let's dig into the technicals.
FX_IDC:EURAUD
FX_IDC:EURNZD
Let us know what you think in the comments below.
Thank you.
74.2% of retail investor accounts lose money when trading CFDs with this provider. You should consider whether you understand how CFDs work and whether you can afford to take the high risk of losing your money. Past performance is not necessarily indicative of future results. The value of investments may fall as well as rise and the investor may not get back the amount initially invested. This content is not intended for nor applicable to residents of the UK. Cryptocurrency CFDs and spread bets are restricted in the UK for all retail clients.
