EUR/CAD BEARS ARE GAINING STRENGTH|SHORT
Hello, Friends!
We are targeting the 1.594 level area with our short trade on EUR/CAD which is based on the fact that the pair is overbought on the BB band scale and is also approaching a resistance line above thus going us a good entry option.
Disclosure: I am part of Trade Nation's Influencer program and receive a monthly fee for using their TradingView charts in my analysis.
✅LIKE AND COMMENT MY IDEAS✅
EURCAD
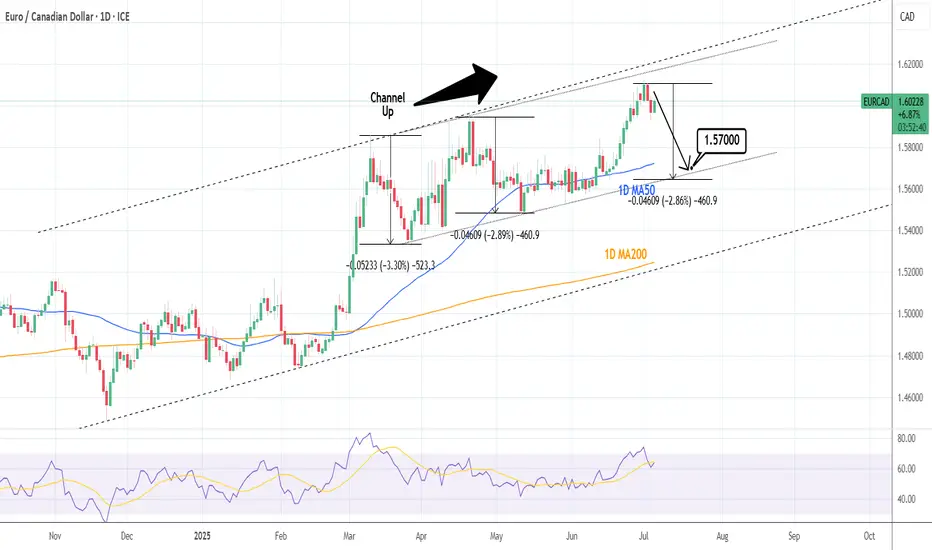
EURCAD: Sell signal on Double Channel Up Top.EURCAD is bullish on its 1D technical outlook (RSI = 63.955, MACD = 0.010, ADX = 41.562) having peaked on two Channel Up patterns at the same time. Technically it should now start the new bearish wave to test the bottom a little below the 1D MA50. Short, TP = 1.57000.
See how our prior idea has worked out:
## If you like our free content follow our profile to get more daily ideas. ##
## Comments and likes are greatly appreciated. ##
EUR/CAD: Wave 5 Trade SetupEUR/CAD is presenting a compelling long setup as what appears to be a five-wave impulse from the June lows looks ready for its final leg higher. The structure shows a classic wave 4 correction that has found support right where Elliott Wave theory suggests it should—setting up a potential wave 5 that could deliver solid risk-to-reward for patient traders.
What the Current Structure Shows (Primary Scenario)
Clean Five-Wave Impulse in Progress: The move up from the June 2025 lows has unfolded in a textbook impulsive pattern, with waves 1, 2, and 3 clearly defined and wave 4 appearing to have completed its correction.
Wave 4 Finds Support: The correction has retraced to a level that respects the typical boundaries for a fourth wave—not too deep to overlap with wave 1, but enough to provide a healthy pullback before the final push.
Wave 5 Setup: With wave 4 likely complete, the structure points to wave 5 beginning, targeting the equality relationship with wave 1 at 1.6170.
Why the Count Is Labeled This Way
The initial surge from the lows shows strong, impulsive characteristics with clear five-wave subdivisions.
Wave 3 extended beyond the typical 1.618 relationship with wave 1, which is common in strong trends.
The current level, at around 1.5927, represents a logical support zone where wave 4 should find its footing.
Trade Setup: Riding the Final Wave
Entry: Current levels, with wave 4 appearing to have bottomed.
Stop Loss: Below 1.5952—if price breaks this level, the wave count is invalidated and suggests wave 4 may be more complex or the entire structure needs reassessment.
Target: 1.6170, where wave 5 achieves equality with wave 1. This is a classic Elliott Wave projection when wave 3 has been the extended wave in the sequence.
What to Watch Next (Confirmation or Invalidation)
Confirmation: A break of the B wave termination point at 160.50 would be confirmation that wave 5 may have started.
Invalidation: A break below 1.5928 would suggest wave 4 is not complete and may be forming a more complex correction.
After Wave 5: Once the target is reached, expect a significant correction as the entire five-wave sequence from the June lows completes.
Alternate Count
If the current support fails, wave 4 could extend into a more complex correction—possibly a triangle or double zigzag—before wave 5 begins. This would delay but not necessarily invalidate the bullish scenario.

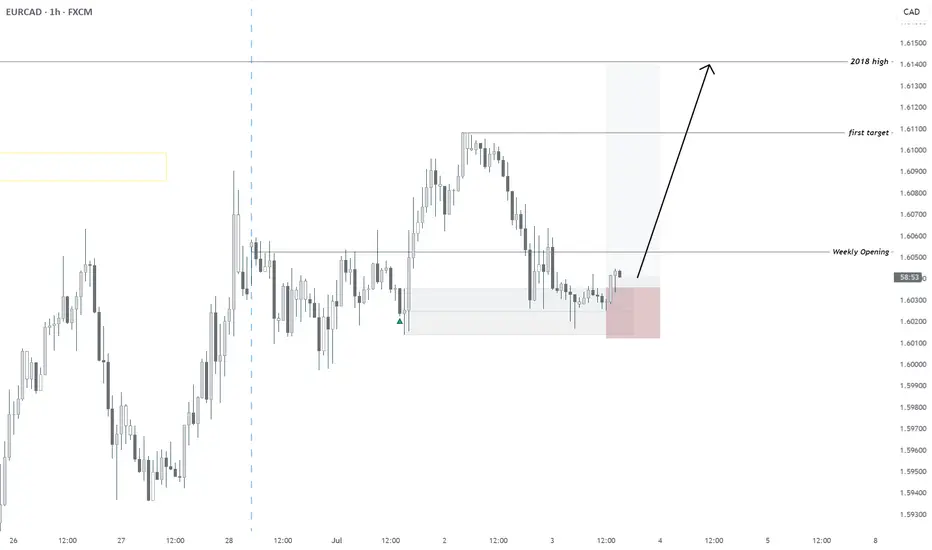
07/02/2025 | EURCAD | BULLISH - REACHING MULTI-YEAR HIGHDaily FX Outlook today:
All timeframes Bullish
Invalidation: 1.60055
First TP: on chart
Second: 2018 High
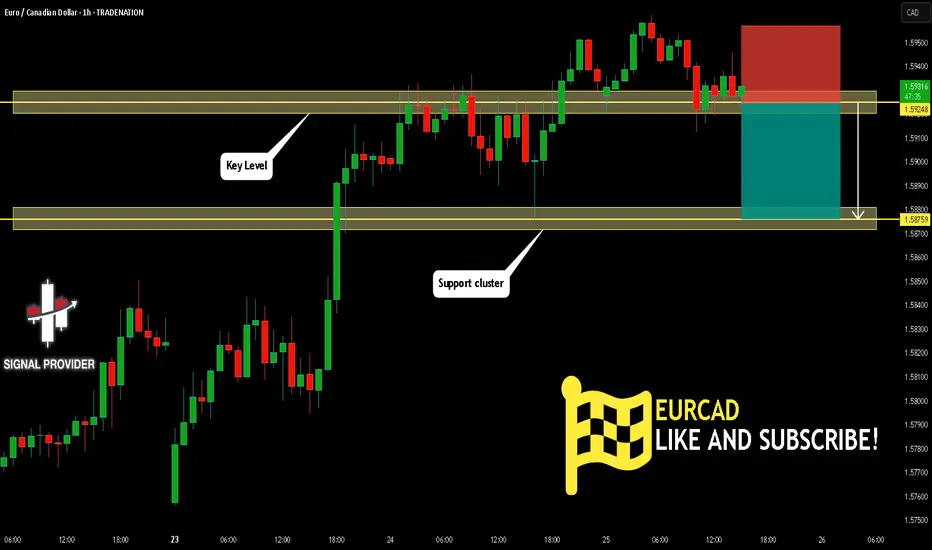
EURCAD Will Go Down!
HI,Traders !
EUR-CAD made a bearish
Breakout of the rising support
And is now consolidating
Below the line so we are
Bearish biased and we will
Be expecting a further
Bearish continuation !
Comment and subscribe to help us grow !

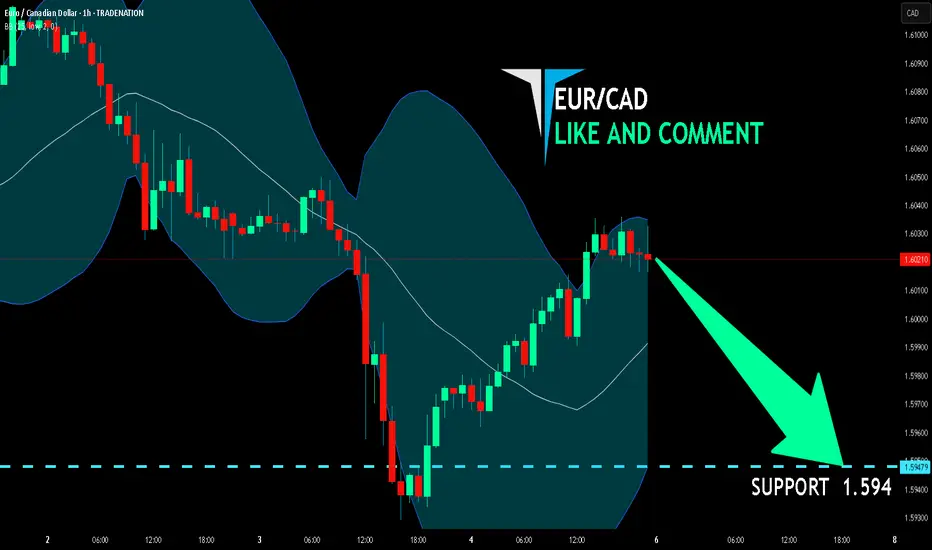
EURCAD: Expecting Bearish Continuation! Here is Why:
The recent price action on the EURCAD pair was keeping me on the fence, however, my bias is slowly but surely changing into the bearish one and I think we will see the price go down.
Disclosure: I am part of Trade Nation's Influencer program and receive a monthly fee for using their TradingView charts in my analysis.
❤️ Please, support our work with like & comment! ❤️
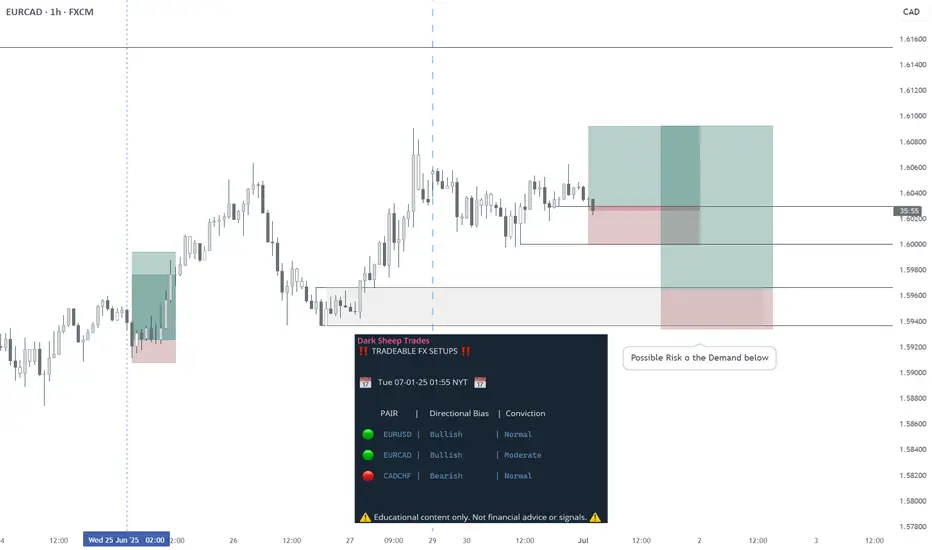
EURCAD - LONG - Statistically-backed FX shortlistEURCAD - LONG
Daily Outlook: Statistically-backed FX shortlist
@darksheeptrades
EUR/CAD Raid Alert: Last Chance to Loot This Bullish Breakout!🏴☠️ EUR/CAD LOOT ALERT: Can We Steal 100 Pips Before the Trap Springs? (Thief Trading Blueprint)
🌟 Hola! Bonjour! Ciao! Hallo! Marhaba! 🌟
Attention Forex Bandits & Loonie Raiders! 💶🦫💰
🔥 Thief Trading Intel: We're targeting EUR/CAD for a MA breakout heist! Long entry only - eyeing that 1.57200 breakout level. High-risk MA Zone ahead: overbought, consolidating, perfect for our ambush.
"Take your pips and vanish - this steal's on the house!" 💨💵
🚪 ENTRY: The Trap is Set!
📈 "Wait for MA breakout at 1.57200 - then STRIKE!"
Option 1: Buy Stop above MA (breakout confirmation)
Option 2: Buy Limit at swing levels (15-30 min TF)
📌 Pro Thief Move: SET THOSE ALERTS!
🛑 STOP LOSS: Escape Plan
🔊 "Listen up, rookies!" 🗣️
Breakout trades? NO SL until after confirmation!
Rebels: Place wherever... but sleep with one eye open! 👁️
📍 Smart Crew SL: Nearest swing low (1H TF)
🎯 TARGET: Loot & Scoot!
🎯 1.58200 (100 pips of pure profit!)
⚡ SCALPERS' QUICK HIT
👀 Long only!
Deep pockets? Raid now
Light wallet? Join swing heist
Trailing SL = Your Getaway Car! 🚗💨
📢 WHY THIS HEIST?
"Euro vs Loonie" showing strength! Watch for:
COT data & Macro trends
Intermarket analysis
Sentiment shifts
🔗 Full dossier? Bio0 links below! 👉🏻☝🏻👉🏻☝🏻
⚠️ WARNING: News = Police Raid! 📰🚨
CAD news moves fast! Protect your stash:
❌ No new trades during news
🔒 Trailing stops = Handcuff-proof profits
💖 SUPPORT THE CREW!
💥 SMASH THAT BOOST BUTTON! 💥
More boosts = bigger future scores!
Stronger crew = more pips for all!
Next currency heist coming soon... 💶🔫

EUR/CAD BEARS ARE STRONG HERE|SHORT
Hello, Friends!
We are now examining the EUR/CAD pair and we can see that the pair is going up locally while also being in a uptrend on the 1W TF. But there is also a powerful signal from the BB upper band being nearby, indicating that the pair is overbought so we can go short from the resistance line above and a target at 1.588 level.
Disclosure: I am part of Trade Nation's Influencer program and receive a monthly fee for using their TradingView charts in my analysis.
✅LIKE AND COMMENT MY IDEAS✅

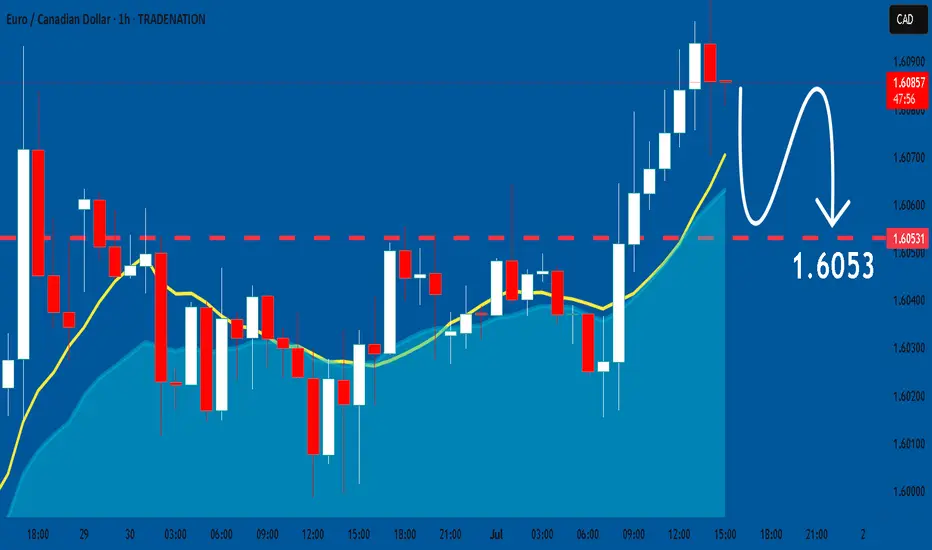
EURCAD My Opinion! SELL!
My dear friends,
Please, find my technical outlook for EURCAD below:
The instrument tests an important psychological level 1.6006
Bias - Bearish
Technical Indicators: Supper Trend gives a precise Bearish signal, while Pivot Point HL predicts price changes and potential reversals in the market.
Target - 1.5978
About Used Indicators:
Super-trend indicator is more useful in trending markets where there are clear uptrends and downtrends in price.
Disclosure: I am part of Trade Nation's Influencer program and receive a monthly fee for using their TradingView charts in my analysis.
———————————
WISH YOU ALL LUCK

EURCAD: The Buy Might Be Hidden in the GapEURCAD just cleared out some liquidity at the highs and is now pulling back into an interesting zone. The bullish structure is still intact, and price has left behind a clean fair value gap right above the previous day’s low.
This zone is where I’m watching closely.
If price taps into that FVG and gives a strong reaction, we could see another leg to the upside. But no need to jump in blindly. Let the 15-minute timeframe show a change of character first.
If that shift happens, I’ll be looking for entries back toward the highs.
Let price come to you. Let structure guide you.

EUR-CAD Local Long! Buy!
Hello,Traders!
EUR-CAD is trading in an
Uptrend and the pair is
About to retest a horizontal
Support of 1.5933 and as
We are locally bullish biased
We will be expecting a
Local bullish rebound
Buy!
Comment and subscribe to help us grow!
Check out other forecasts below too!
Disclosure: I am part of Trade Nation's Influencer program and receive a monthly fee for using their TradingView charts in my analysis.

EURCAD Analysis & The Blueprint for a Winning Trading Strategy📍 You’ve got to have a roadmap — a solid trading plan is absolutely essential 🧭.
In this video, I break down my personal trading plan and walk you through exactly how I approach the markets 🎯. I’m currently looking at EURCAD and there’s a lot happening on this chart 📉📊.
First things first: price action is clearly overextended 📈. The question is — do you really want to be buying at a premium? That’s where risk increases significantly ⚠️.
My approach is simple yet effective: I look for signs of reversal or a pullback into equilibrium 🌀 — then I wait for price to break structure before I act 📐.
Having a system in place that alerts you when key conditions are met is critical 🔔. That’s how you build consistency and gain a real edge in the market 🧠⚔️.
In this video, I’ll show you my strategy, how I plan a trade, what I’m looking for, and why patience is key 🧘♂️.
🛑 Don’t chase price. Let the setup come to you. Let the chart reveal its hand 🃏.
Not financial advice — always do your own research. 📚

EUR-CAD Bullish Breakout! Buy!
Hello,Traders!
EUR-CAD is trading in an
Uptrend and the pair made
A bullish breakout of the key
Horizontal level of 1.5936 so we
Are bullish biased and we
Will be expecting a further
Bullish move up
Buy!
Comment and subscribe to help us grow!
Check out other forecasts below too!
Disclosure: I am part of Trade Nation's Influencer program and receive a monthly fee for using their TradingView charts in my analysis.

EURCADhello trader, the price of eurcad is all time high, but it can go further to previous high level or could surpass it, price in bullish uptrend channel in daily timeframe, the price did reached the main resistance level, this level has been tested multiple times but this time I think it won't hold (with week BOC fundamentals) as well the previous high could break too because that one also has been test before, the price wil likely make all new all time high.. good luck

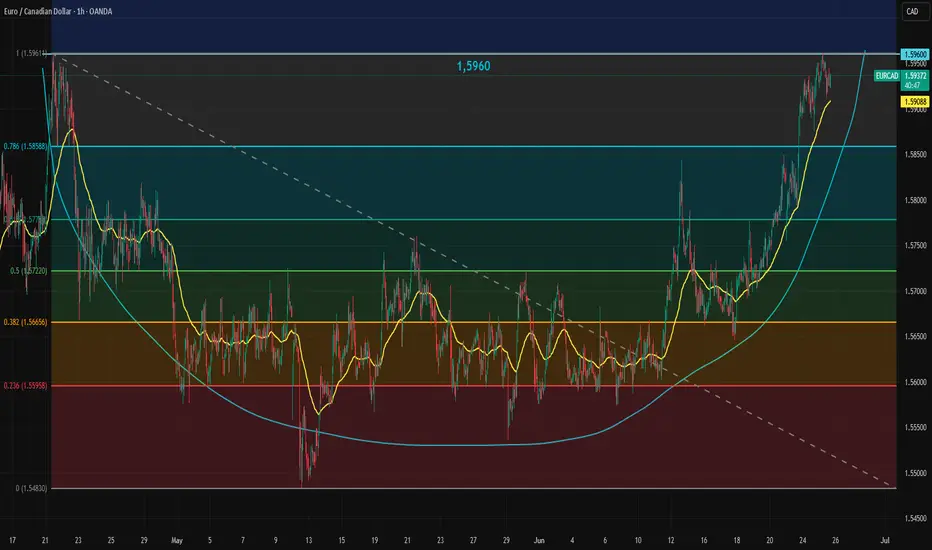
EURCAD Forms Cup FormationThe EURCAD rally, driven by a strong euro and a weak Canadian dollar, has created an impressive chart setup. A cup formation has developed just below the 1.5960 resistance level. Whether this pattern will be completed with a handle remains unclear at this stage.
If a handle forms, the 78.6% retracement level could serve as a reasonable downside target. In the short term, the 50-hour EMA is supporting the trend and can be watched as key support.
If EURCAD breaks above 1.5960 and confirms the cup formation, the medium-term target for the pattern could reach as high as 1.6440.
EURCAD Will Fall! Sell!
Here is our detailed technical review for EURCAD.
Time Frame: 1h
Current Trend: Bearish
Sentiment: Overbought (based on 7-period RSI)
Forecast: Bearish
The market is approaching a significant resistance area 1.592.
Due to the fact that we see a positive bearish reaction from the underlined area, I strongly believe that sellers will manage to push the price all the way down to 1.587 level.
P.S
Overbought describes a period of time where there has been a significant and consistent upward move in price over a period of time without much pullback.
Disclosure: I am part of Trade Nation's Influencer program and receive a monthly fee for using their TradingView charts in my analysis.
Like and subscribe and comment my ideas if you enjoy them!
EURCAD: The Reaction Was Clean But The Drop Might Be CleanerEURCAD just gave a textbook reaction from a liquidity grab followed by a clean break of structure. After taking out the highs and filling the upper imbalance, price is reversing right back into a bearish FVG.
If price respects it, the downside continuation becomes even more likely.
This setup is simple and clear. Let the market pull into the zone and watch how it reacts. If momentum shifts again, the path down toward previous lows could be smooth.
Be patient. Let price come to you. No need to force entries. Wait for the lower timeframes to confirm the shift before making any move.

EURCAD at key resistance: Will price rebound to 1.5215?The price is currently at a strong resistance level, where it has struggled to break through and reversed sharply to the downside before. This makes the area particularly important to monitor, especially for traders considering potential short setups.
If we begin to see signs of rejection at this level, such as long upper wicks, bearish candlestick patterns, or a clear loss of buying momentum, we could see a move down toward the 1.5215 level . In this particular context I am targeting a very achievable bounce. But if price cleanly breaks out, that would rule out the bearish outlook and suggest even further upside will follow.
This area is pretty important and could give us a better idea of where price is headed.
Just sharing my thoughts on support and resistance, this isn’t financial advice. Always confirm your setups and manage your risk properly.


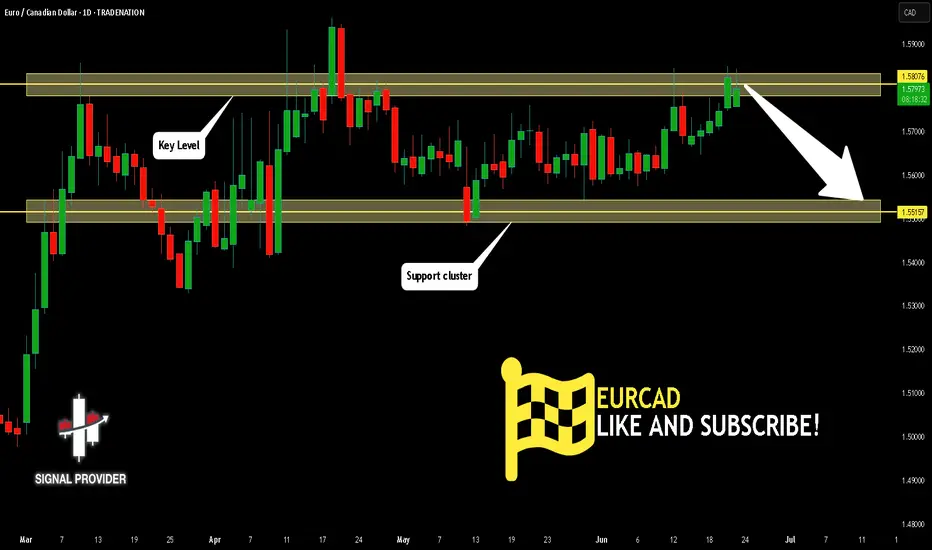
EURCAD Will Go Lower From Resistance! Sell!
Take a look at our analysis for EURCAD.
Time Frame: 1D
Current Trend: Bearish
Sentiment: Overbought (based on 7-period RSI)
Forecast: Bearish
The market is testing a major horizontal structure 1.580.
Taking into consideration the structure & trend analysis, I believe that the market will reach 1.551 level soon.
P.S
The term oversold refers to a condition where an asset has traded lower in price and has the potential for a price bounce.
Overbought refers to market scenarios where the instrument is traded considerably higher than its fair value. Overvaluation is caused by market sentiments when there is positive news.
Disclosure: I am part of Trade Nation's Influencer program and receive a monthly fee for using their TradingView charts in my analysis.
Like and subscribe and comment my ideas if you enjoy them!
EUR/CAD BuyEntry – Buy-limit 1.5560 (front-run zone); back-up bid 1.5520 if you ladder.
Stop-loss – Hard stop 1.5410 (below 1.5500 break-fail line).
Targets
TP1 1.5750 – lock ~1.5 R; trail stop to break-even.
TP2 1.5900 – cash majority.
Runner 1.6000 – only if momentum is strong.
Expiry: cancel if not filled after 5 trading days.

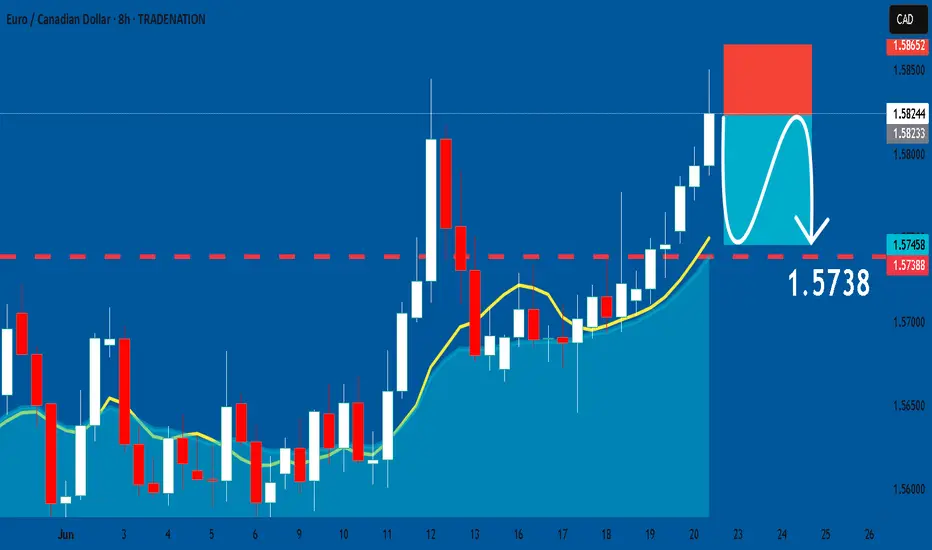
EURCAD: Short Trade Explained
EURCAD
- Classic bearish pattern
- Our team expects retracement
SUGGESTED TRADE:
Swing Trade
Sell EURCAD
Entry - 1.5823
Stop - 1.5865
Take - 1.5738
Our Risk - 1%
Start protection of your profits from lower levels
Disclosure: I am part of Trade Nation's Influencer program and receive a monthly fee for using their TradingView charts in my analysis.
❤️ Please, support our work with like & comment! ❤️