EURCAD
EUR-CAD Free Signal! Sell!
Hello,Traders!
EUR-CAD is making some
Bullish gains but the pair
Is approaching a horizontal
Resistance level of 1.5577
From where we can enter
A short trade with the
Target Level of 1.5508
And the Stop Loss of 1.5592
Sell!
Comment and subscribe to help us grow!
Check out other forecasts below too!
Disclosure: I am part of Trade Nation's Influencer program and receive a monthly fee for using their TradingView charts in my analysis.
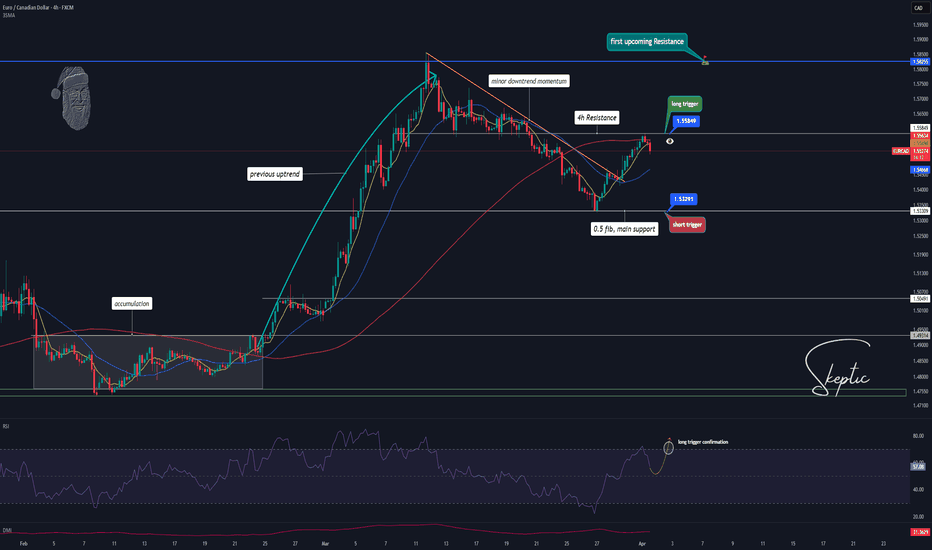
Skeptic | EUR/CAD at Crossroads: 1.55849 vs. 1.53291Welcome back, guys! 👋 I'm Skeptic.
Today, we’re diving deep into EUR/CAD, analyzing key levels and potential triggers. 🔍
Market Structure & Current Outlook
Looking at the 4H time frame , we initially saw an accumulation phase from February 3rd to February 24th. After breaking out from the accumulation range, price rallied strongly, continuing the major uptrend until 1.58552 .
Following this peak, EUR/CAD entered a corrective phase, forming a secondary downtrend that retraced to the 0.5 Fibonacci level.
Now, the minor downtrend has broken , signaling a potential continuation of the major 4H uptrend. With strong confluence for a bullish move, we’ll be looking for a long setup, but we’ll also prepare for a potential short trigger in case price reverses. Remember, as traders, we analyze the market from both perspectives and execute based on confirmations—skeptical eyes always! 🔮👽
📈 Bullish Scenario (Long Setup):
🔹 Trigger: Break & close above 1.55849
🔹 Confirmation: 7 SMA below the breakout candle
RSI entering overbought zone
🔹 Invalidation: Rejection & close back below 1.54325
📉 Bearish Scenario (Short Setup):
🔹 Trigger: Drop below 1.53291
🔹 Confirmation: RSI entering oversold zone
⚠️ Key Notes & Risk Management
🔹 Fundamentals:
This Friday is NFP day, a crucial event that could create volatility in the market.
Always consider fundamental catalysts when executing trades.
🔹 Risk Management:
Avoid overleveraging.
Wait for confirmed breaks before entering positions.
Stick to your trading plan and stop-loss strategy.
Stay sharp, and I’ll see you in the next analysis! 🚀
Bearish revrsal off pullback resistance?EUR/CAD is rising towards the pivot and could reverse to the 1st support which is a pullback support.
Pivot: 1.5629
1st Support: 1.5420
1st Resistance: 1.5731
Risk Warning:
Trading Forex and CFDs carries a high level of risk to your capital and you should only trade with money you can afford to lose. Trading Forex and CFDs may not be suitable for all investors, so please ensure that you fully understand the risks involved and seek independent advice if necessary.
Disclaimer:
The above opinions given constitute general market commentary, and do not constitute the opinion or advice of IC Markets or any form of personal or investment advice.
Any opinions, news, research, analyses, prices, other information, or links to third-party sites contained on this website are provided on an "as-is" basis, are intended only to be informative, is not an advice nor a recommendation, nor research, or a record of our trading prices, or an offer of, or solicitation for a transaction in any financial instrument and thus should not be treated as such. The information provided does not involve any specific investment objectives, financial situation and needs of any specific person who may receive it. Please be aware, that past performance is not a reliable indicator of future performance and/or results. Past Performance or Forward-looking scenarios based upon the reasonable beliefs of the third-party provider are not a guarantee of future performance. Actual results may differ materially from those anticipated in forward-looking or past performance statements. IC Markets makes no representation or warranty and assumes no liability as to the accuracy or completeness of the information provided, nor any loss arising from any investment based on a recommendation, forecast or any information supplied by any third-party.
EUR/CAD BEARISH BIAS RIGHT NOW| SHORT
Hello, Friends!
EUR/CAD pair is trading in a local downtrend which know by looking at the previous 1W candle which is red. On the 1H timeframe the pair is going up. The pair is overbought because the price is close to the upper band of the BB indicator. So we are looking to sell the pair with the upper BB line acting as resistance. The next target is 1.542 area.
Disclosure: I am part of Trade Nation's Influencer program and receive a monthly fee for using their TradingView charts in my analysis.
✅LIKE AND COMMENT MY IDEAS✅
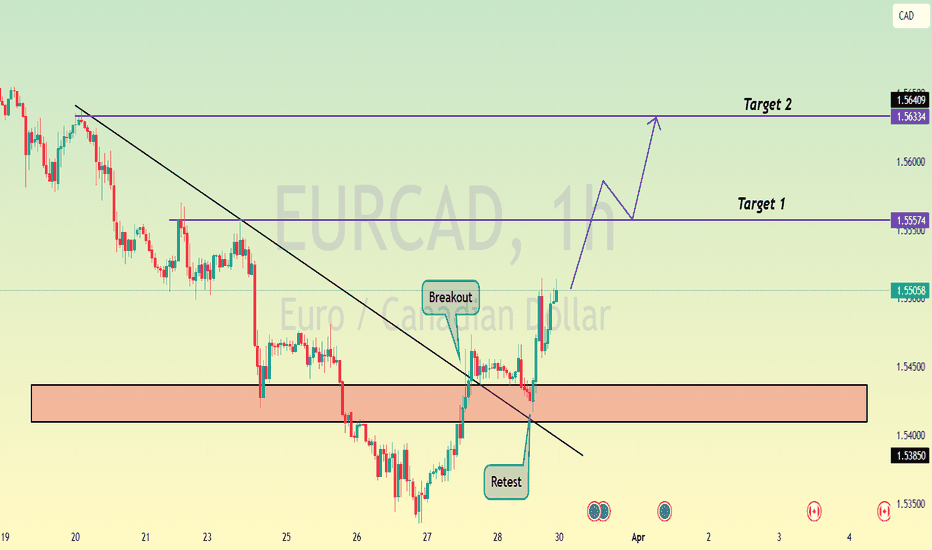
EURCAD , Successful Trendline Break , Ready for BullHello Traders
In This Chart EURCAD HOURLY Forex Forecast By FOREX PLANET
today EURCAD analysis 👆
🟢This Chart includes_ (EURCAD market update)
🟢What is The Next Opportunity on EURCAD Market
🟢how to Enter to the Valid Entry With Assurance Profit
This CHART is For Trader's that Want to Improve Their Technical Analysis Skills and Their Trading By Understanding How To Analyze The Market Using Multiple Timeframes and Understanding The Bigger Picture on the Charts
EURCAD Resistance , All eyes on SellingHello Traders
In This Chart EURCAD HOURLY Forex Forecast By FOREX PLANET
today EURCAD analysis 👆
🟢This Chart includes_ (EURCAD market update)
🟢What is The Next Opportunity on EURCAD Market
🟢how to Enter to the Valid Entry With Assurance Profit
This CHART is For Trader's that Want to Improve Their Technical Analysis Skills and Their Trading By Understanding How To Analyze The Market Using Multiple Timeframes and Understanding The Bigger Picture on the Charts
Bearish reversal off pulback resistance?EUR/CAD is rising towards the resistance level which is a pullback resistance that line sup with the 38.2% Fibonacci retracement and could reverse from this level to our take profit.
Entry: 1.5548
Why we like it:
There is a pullback resistance level that line sup with the 38.2% Fibonacci retracement.
Stop loss: 1.5695
Why we like it:
There is a pullback resistance level that line sup with the 71% Fibonacci retracement.
Take profit: 1.5340
Why we like it:
There is a pullback support level.
Enjoying your TradingView experience? Review us!
Please be advised that the information presented on TradingView is provided to Vantage (‘Vantage Global Limited’, ‘we’) by a third-party provider (‘Everest Fortune Group’). Please be reminded that you are solely responsible for the trading decisions on your account. There is a very high degree of risk involved in trading. Any information and/or content is intended entirely for research, educational and informational purposes only and does not constitute investment or consultation advice or investment strategy. The information is not tailored to the investment needs of any specific person and therefore does not involve a consideration of any of the investment objectives, financial situation or needs of any viewer that may receive it. Kindly also note that past performance is not a reliable indicator of future results. Actual results may differ materially from those anticipated in forward-looking or past performance statements. We assume no liability as to the accuracy or completeness of any of the information and/or content provided herein and the Company cannot be held responsible for any omission, mistake nor for any loss or damage including without limitation to any loss of profit which may arise from reliance on any information supplied by Everest Fortune Group.
Forex Traders Focus on Trump’s Tariff NewsForex Traders Focus on Trump’s Tariff News
As April 2 approaches—the date when Trump's international trade tariffs are set to take effect—traders are increasingly concentrating on this highly uncertain issue.
Yesterday, the U.S. president stated that:
→ Tariffs on cars would be introduced "soon" (but not all possible tariffs would be imposed);
→ Some countries might receive exemptions;
→ Nations purchasing oil from Venezuela could face 25% tariffs.
Following these remarks:
→ Oil prices rose;
→ U.S. stocks gained as Wall Street (according to Reuters) interpreted the comments as a sign of flexibility in trade negotiations.
Given this backdrop, the EUR/CAD chart is particularly interesting, as both Europe and Canada frequently feature in news related to the White House's trade policies.
EUR/CAD Exchange Rate Today
As seen on the EUR/CAD chart, the pair has slightly declined at the start of the week, dipping towards 1.54450. However, market volatility remains high:
→ The pair has gained approximately 2.85% since early March;
→ The decline from March’s peak is around 2.6%.
Technical Analysis of EUR/CAD
The pair’s volatile price swings have formed a trend channel (marked in blue).
Notably, the 1.57750 level has shifted from support to resistance, signalling bearish dominance. This is further reflected in the price movement within the red channel. If bears maintain control, EUR/CAD may drop towards a support zone, which includes:
→ The median of the blue channel;
→ The 1.54000 support level, drawn from early March’s local low.
This article represents the opinion of the Companies operating under the FXOpen brand only. It is not to be construed as an offer, solicitation, or recommendation with respect to products and services provided by the Companies operating under the FXOpen brand, nor is it to be considered financial advice.
EUR_CAD SHORT SIGNAL|
✅EUR_CAD is going down
Now and the pair made a
Bearish breakout of the local
Key level of 1.5580 which is now
A resistance so we are locally
Bearish biased and we will be
Expecting a further move down
So a short trade can be entered
With the TP of 1.5480 and
The SL of 1.5600
SHORT🔥
✅Like and subscribe to never miss a new idea!✅
Disclosure: I am part of Trade Nation's Influencer program and receive a monthly fee for using their TradingView charts in my analysis.
EUR-CAD Free Signal! Sell!
Hello,Traders!
EUR-CAD made a bearish
Breakout of the key horizontal
Level of 1.5528 so we are
Bearish biased so we can
Enter a short trade with
The Take Profit of 1.5454
And the Stop Loss of 1.5576
Sell!
Comment and subscribe to help us grow!
Check out other forecasts below too!
Disclosure: I am part of Trade Nation's Influencer program and receive a monthly fee for using their TradingView charts in my analysis.
EUR/CAD LONG FROM SUPPORT
Hello, Friends!
EUR/CAD pair is trading in a local uptrend which know by looking at the previous 1W candle which is green. On the 3H timeframe the pair is going down. The pair is oversold because the price is close to the lower band of the BB indicator. So we are looking to buy the pair with the lower BB line acting as support. The next target is 1.566 area.
Disclosure: I am part of Trade Nation's Influencer program and receive a monthly fee for using their TradingView charts in my analysis.
✅LIKE AND COMMENT MY IDEAS✅
Bullish bounce off 50% Fibonacci support?EUR/CAD is falling towards the pivot which acts as a pullback support and could bounce to the 1st resistance.
Pivot: 1.54200
1st Support: 1.53020
1st Resistance: 1.55988
Risk Warning:
Trading Forex and CFDs carries a high level of risk to your capital and you should only trade with money you can afford to lose. Trading Forex and CFDs may not be suitable for all investors, so please ensure that you fully understand the risks involved and seek independent advice if necessary.
Disclaimer:
The above opinions given constitute general market commentary, and do not constitute the opinion or advice of IC Markets or any form of personal or investment advice.
Any opinions, news, research, analyses, prices, other information, or links to third-party sites contained on this website are provided on an "as-is" basis, are intended only to be informative, is not an advice nor a recommendation, nor research, or a record of our trading prices, or an offer of, or solicitation for a transaction in any financial instrument and thus should not be treated as such. The information provided does not involve any specific investment objectives, financial situation and needs of any specific person who may receive it. Please be aware, that past performance is not a reliable indicator of future performance and/or results. Past Performance or Forward-looking scenarios based upon the reasonable beliefs of the third-party provider are not a guarantee of future performance. Actual results may differ materially from those anticipated in forward-looking or past performance statements. IC Markets makes no representation or warranty and assumes no liability as to the accuracy or completeness of the information provided, nor any loss arising from any investment based on a recommendation, forecast or any information supplied by any third-party.
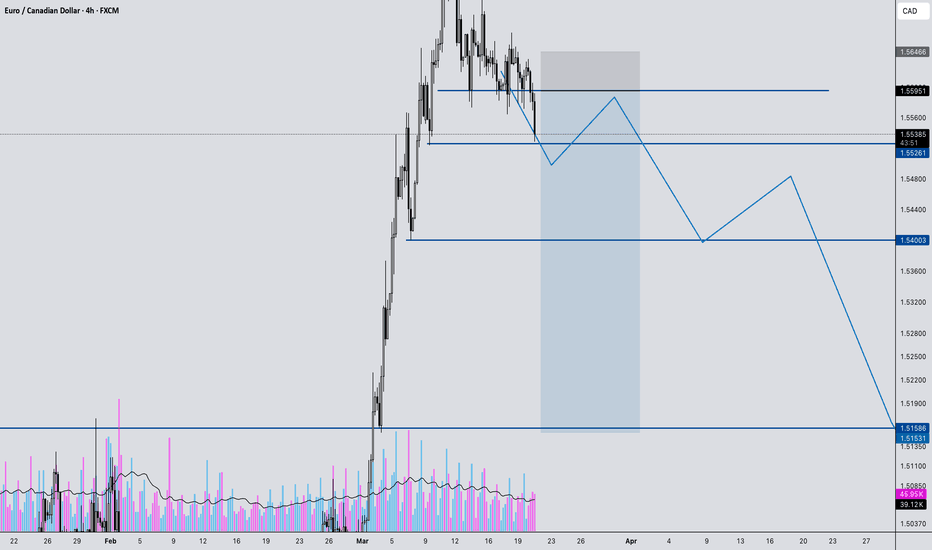
EURCAD Breakdown: Major Reversal Incoming? Watch This Setup!In this video, we analyze a high-probability trade setup on EURCAD, breaking down key market structure shifts and potential reversal zones. 📊
🔹 Massive impulse move into key resistance – Is a pullback coming?
🔹 Breakdown of bullish structure – Signs of a trend shift?
🔹 Key entry & exit points mapped out – Waiting for confirmation at 1.5595
🔹 Targeting major liquidity zones – Potential downside to 1.5523, 1.5400, and 1.5155
If price rejects our marked resistance zone, we could see a strong move downward, stopping out euphoric buyers and creating new trading opportunities. But what if it breaks above? We discuss both scenarios and how to react accordingly.
📍 Watch until the end for a full breakdown and trade execution strategy!
💬 Drop your thoughts in the comments! Do you see something different in this setup? Let’s discuss.
🚀 Like, share, and follow for more market insights!
A possible short-term bullish set-up on EURCAD?Well, it seems that FX_IDC:EURCAD could be forming either a bullish pennant, or a falling wedge pattern in the near-term. Both patterns tend to result in a bullish breakout. However, we still require a confirmation. Without it, there is still a chance to see a move lower.
MARKETSCOM:EURCAD
Let us know what you think in the comments below.
Thank you.
74.2% of retail investor accounts lose money when trading CFDs with this provider. You should consider whether you understand how CFDs work and whether you can afford to take the high risk of losing your money. Past performance is not necessarily indicative of future results. The value of investments may fall as well as rise and the investor may not get back the amount initially invested. This content is not intended for nor applicable to residents of the UK. Cryptocurrency CFDs and spread bets are restricted in the UK for all retail clients.


