EURCADBullish Indicators:
1) Double bottom
2) Support at 1.43192
Bearish Indicators:
1) LH LL
2) Downward Trend
3) Resistance zone at 1.44406 and the upward trendline.
Plan A: After making double bottom one can take a long position from here or on the breaking of upward trendline for the target of 1.46223
Plan B: On the failure of breaking of upward trendline and resistance zone at 1.44406 one can take short position for the target of 1.43192.
Eurcadanalysis

EURCAD Broke the Monthly flagHi there,
EURCAD broke the bearish flag on Monthly timeframe, big bearish signal.
As you see oil also changed the trend, and its now in a uptrend after it broke the previous top, but soon oil will make a correction, so eurcad will make a correction as well.
Wait for the price to retest the broken bearish flag, then short it from there to the targets mentioned in the chart.
Good luck

EURCAD LONG IDEAHey guys, this pair is currently trading on the daily support. There's a double bottom on the daily time frame. On H1, we see an inverted head and shoulder pattern which is a reversal pattern. I'm long on this pair. My bias will be invalidated incase that daily support zone is broken.
Happy trading

EUR/CAD Looking For Longing Opportunity EURCADEURCAD reached a weekly and monthly major support level and retested the trendline after a strong impulse to the downside without any correction. We can expect growth from here before continuing the move to the downside or break of the bearish movement.
This post does not provide financial advice. It is for educational purposes only! You can use the information from the post to make your own trading plan for the market. But you must do your own research and use it as the priority. Trading is risky, and it is not suitable for everyone. Only you can be responsible for your trading.


EURCAD - TIME FOR A BULLISH RUN?We've seen EURCAD decline for a couple of weeks now, plummeting over 500 pips from 1.5 (LQP). At recent, the market is approaching a demand zone around 1.44. The pair is still within Bearish market conditions i.e from the 4H time-frame the market structure is bearish. A shift in MS from Bearish to bullish around the target zone will trigger a bullish run. We should see the market retrace to either the 50.0% or 61.8% (Golden ratio) Fibonacci retracement level on the impulse run.
Swing Trade with an insane risk:reward ratio.
TP1 @1.4500 and TP2 @ 1.750
SL max 50pips below entry level.
Happy Trading Week!!
Please like, comment and follow if you found this helpful!!


Potential reversal for EURAUDEURCAD is now trading on daily support and the price is trading in the falling channel/wedge. What is more interesting is the divergence shown by an Awesome Oscillator. This indicates exhaustion of bearish momentum and more buying pressure coming in. Thus, I expect a reversal from this area.
What is your opinion on EURCAD?
Nice Trading!!!!

EURCAD top-down analysisHello traders, this is the full breakdown of this pair. We will take this trade if all the conditions are satisfied as discussed in the analysis. Smash the like button if you find value in this analysis and drop a comment if you have any questions or let me know which pair to cover in my next analysis.

EURCADBullish indicators:
1) Trading near major support area of 1.46100
2) Bullish Harami candle
3) Falling wedge
Bearish Indicators:
1) LL LH
2) Currently trading in downward trend
Plan A: On the bounce from the support area one can buy for the target 1.47733 first and then for the 1.48075.
Plan B: On the breaking of trendline and support one can sell for the target of 1.45826 where the major support lies.

EURCAD BearishEURCAD had a nice sell on Friday, no signs of retracement yet. Want to see what price does when it get to the small support to make a double bottom. This is where patience pays off. Once we hit full TP we will watch for a break or bounce

EURCAD: Don't Miss 400 PIPS Opportunity Till the end OctoberEURCAD
Duration 30-45 Days
Terms: Long Term / Swing Trade
Target: 400 PIPS
GOOD LUCK


EURCAD sells after pull backEURCAD, waiting for a retest of the support price broke out of Friday. Once we get our retest as resistance we can go short to the double bottom of 1.45830

after retracementprice is making LL and LH
previous resistance turned support
after the pullback I expect continuation to the downside

EUR/CAD Support and Resistance Hi every one.
This is a trading setup in my opinion. If you want to trade, do not forget about capital management.
Good Luck.

A wave of hope for the bears | EURCADFX:EURCAD
Hello traders;
Here's my outlook on EURCAD-
We see price-breaking LL indicating a bearish trend and as such, we expect for price to make a successful retrace which will end at the OB before the bullish impulsive move which was initiated by smart money. Once price hits this OB (blue rectangle zone) we expect to see a more impulsive bearish pull to the downside to continue the bearish structure.

[EURCAD W3 Sept 2021]EURCAD
Short Setup
👉🏻 Price did not break the previous high, in fact formed a lower high. Possible Wave-2 here is made up of a complex 3 waves' move.

EURCADlast day price make an large uptrend channel and it’s already broke with retest, but wee still didn’t know where price will go, but my personal opinion i will going short in this pairs.

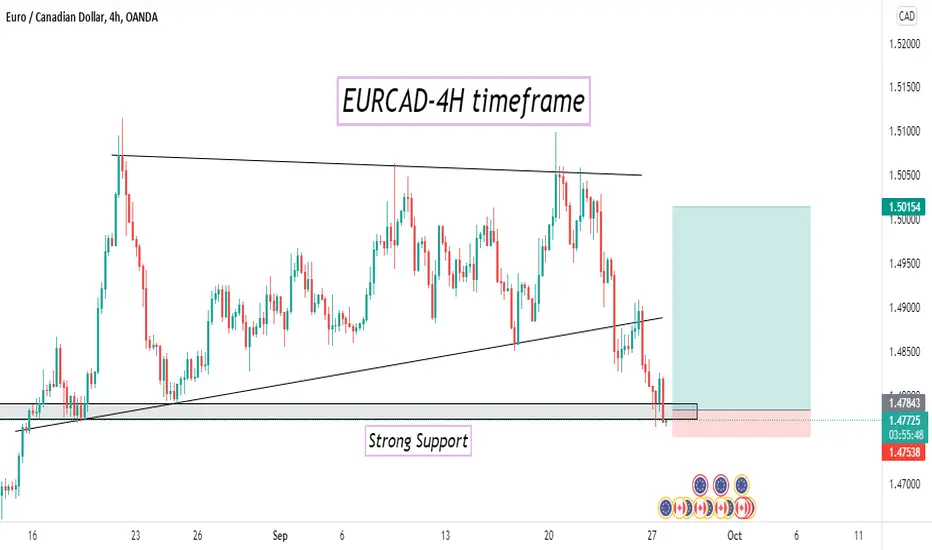
EURCAD ANALYSISEURCAD breakdown the ascending channel and complete the backtesting .so place the order 1.49133 level, enjoy this trade

EURCAD SHORT Here is my short idea of EURCAD. It is possible to expect some further downside on EURCAD with a strong Crude.

Short EURCADPrice has broken the Channel and right now is around the support level. On the break of support and retest go short with good risk reward.
