Eurcadbuy

EURCAD Fundamental Analysis – October 11th 2019Here are the key factors to keep in mind today for Euro trades:
Final German CPI: The Final German CPI for September was reported flat at 0.0% monthly and increased by 1.2% annualized. Economists predicted a flat reading of 0.0% and an increase of 1.2%. Forex traders can compare this to the German CPI for August which decreased by 0.2% monthly and which increased by 1.2% annualized. The Final EU Harmonized German CPI for September decreased by 0.1% monthly and increased by 0.9% annualized. Economists predicted a decrease of 0.1% and an increase of 0.9%. Forex traders can compare this to the EU Harmonized German CPI for August which decreased by 0.1% monthly and which increased by 0.9% annualized.
Final Spanish CPI: The Final Spanish CPI for September was reported flat at 0.0% monthly and increased by 0.1% annualized. Economists predicted a flat reading of 0.0% and an increase of 0.1%. Forex traders can compare this to the Spanish CPI for August which decreased by 0.1% monthly and which increased by 0.1% annualized. The Final EU Harmonized Spanish CPI for September increased by 0.4% monthly and by 0.2% annualized. Economists predicted an increase of 0.4% and of 0.2%. Forex traders can compare this to the EU Harmonized Spanish CPI for August which increased by 0.4% monthly and by 0.2% annualized.
Here is the key factor to keep in mind today for Canadian Dollar trades:
Canadian Employment Report: The Canadian Employment Report for September is predicted to show the addition of 7.9K jobs and an Unemployment Rate of 5.7%. Forex traders can compare this to the Canadian Employment Report for August which showed the addition of 81.1K jobs and an Unemployment Rate of 5.7%. Hourly Earnings for Permanent Employees for September are predicted to increase by 3.8% annualized. Forex traders can compare this to Hourly Earnings for Permanent Employees for August which increased by 3.8% annualized. 21.7K Full-Time Positions are expected to have been created and 10.0K Part-Time Positions lost in September. Forex traders can compare this to the creation of 23.8K Full-Time Positions and 57.2K Part-Time Positions which were reported in August. The Labor Force Participation Rate for September is expected at 65.7%. Forex traders can compare this to the Labor Force Participation Rate for August which was reported at 65.8%.
Should price action for the EURCAD remain inside the or breakdown below the 1.4585 to 1.4650 zone the following trade set-up is recommended:
Timeframe: D1
Recommendation: Short Position
Entry Level: Short Position @ 1.4610
Take Profit Zone: 1.4415 – 1.4470
Stop Loss Level: 1.4690
Should price action for the EURCAD breakout above 1.4650 the following trade set-up is recommended:
Timeframe: D1
Recommendation: Long Position
Entry Level: Long Position @ 1.4690
Take Profit Zone: 1.4860 – 1.4930
Stop Loss Level: 1.4650
Open your PaxForex Trading Account now and add this currency pair to your forex portfolio. Did you know that you can earn more pips per trade simply by switching to PaxForex? Sign-up now and boost your profits!

EURCAD Monthly Trend Possibility. "In the name of Allah, the Most Gracious, the Most Merciful".
EURCAD Monthly Trend Possibility.
Note: This is only for Educational Purpose this is not Investment advice.
Thanks
Adil Khan.


EURCAD approaching resistance, look out for potential reversal!
EURCAD is approaching its resistance at 1.46961 where it is could reverse down to its support at 1.45495.
Trading CFDs on margin carries high risk.
Losses can exceed the initial investment so please ensure you fully
understand the risks.

ELLIOT WAVE: EURCAD BULLS LOOKING TO MAKE A NEW HIGHThe price movement for the EUR/CAD has been constrained by several channels and overlapping price action over the past few years. The above chart visualizes the WEEKLY price action of EURCAD from August 2012 low. As visible, its structure can be best labeled as a "W-X-Y" double three/combination Elliot Wave pattern.
The advance from August 2012 and March 2014 can be labeled as an (a)-(b)-(c) zigzag pattern in wave W. While the sideways and time-consuming price action that follows the rally between March 2014 and September 2019 seems to be unfolded as an Elliot Wave running triangle pattern labeled (a)-(b)-(c)-(d)-(e) in wave X.
.
According to Elliot wave theory, Triangle is a continuation pattern which breaks in the direction of the preceding move. With that being said, we could see a rally in wave Y in the form of a zigzag to complete the double three structure.
.
Wave Y has the potential to equal the size of wave W. So, the blue box and upper trendline of the channel is the most likely price target.
BEYOND ELLIOT WAVE
We could also see the price testing the longterm ascending trendline that extends from August 2012 low and has not been tested since 2015 for the third time. Last weekly price action closed as bullish outside or engulfing bar, this further suggesting a potential surge in the exchange rate of EURCAD.
Thanks for reading!

EURCAD FALLING WEDGE PATTERN"In the name of Allah, the Most Gracious, the Most Merciful"
EURCAD FALLING WEDGE PATTERN.
Note: This is only for Educational Purpose this is not Investment advice.
Please support the setup with your likes, comments and by following on Trading View.
Share Our Chart on All Social Media.
Thanks
Adil Khan

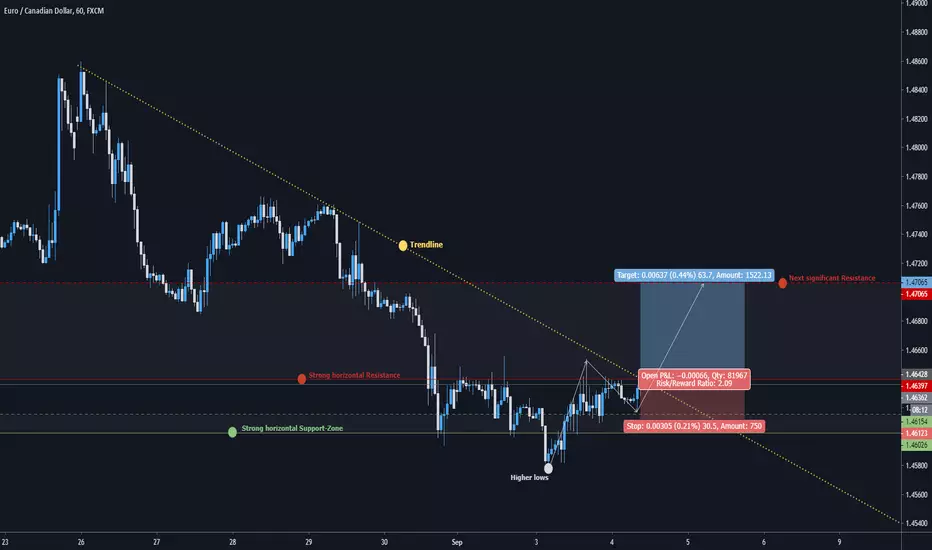
EUR/CAD: Daytrade-Opportunity#BUYEUR/CAD: Daytrade-Opportunity#BUYHey tradomaniacs,
welcome to another free signal of Week 36 Nr. 8
How to trade: Wait for the breakout, retest and rejection before you buy.
-----------------------------
Type: Daytrade
Buy here: 1,46430
Stop-Loss: 1,46112
Target 1: 1,46856
Target 2: 1,47065
-----------------------------
LEAVE A LIKE AND A COMMENT - I appreciate every support! =)
Peace and good trades
Irasor
Wanna see more? Don`t forget to follow me.
Any questions? PM me. :-)
EURCAD bounced from support, potential for a further rise!
EURCAD bounced off 1.45774 where it could potentially rise further to 1.47072.
Trading CFDs on margin carries high risk.
Losses can exceed the initial investment so please ensure you fully
understand the risks.


EURCAD approaching support, potential for a further rise!
EURCAD approaching support at 1.45908 where it could potentially rise further to 1.46529.
Trading CFDs on margin carries high risk.
Losses can exceed the initial investment so please ensure you fully
understand the risks.

EURCAD approaching support, potential for a bounce!
EURCAD is expected to drop to 1st support at 1.47072 where it could potentially react off and up to 1st resistance at 1.46351.
Trading CFDs on margin carries high risk.
Losses can exceed the initial investment so please ensure you fully
understand the risks.


EURCAD potential reversal!
EURCAD expected to rise up to 1st resistance at 1.47845 where it could potentially react off and drop down to 1st support at 1.47141.
Trading CFDs on margin carries high risk.
Losses can exceed the initial investment so please ensure you fully
understand the risks.


SELL EURCAD AT MARKED ENTRY We previously saw EURCAD break out of range bearish until most recent point of support by which it had completed the first potential cycle. Price still has bearish potential from which we may see price move bearish from around 1.48626 and complete the move at 1.42913.
Stoploss is about 220 pips so manage your risk accordingly.
Check out all analysis on my page :) and hit that follow button for more analysis.


EURCAD LONG TRADE IDEAThe EURCAD made an impulsive move to the upside and followed by a corrective structure that has retraced 61.8% of the rally.
The prices have rejected a broken resistance that lined up with mean value "moving averages" as support.
Price has the potential to resume higher from the near current level and resistance level @ 1.51700 area is a plausible target!

EURCAD bounced from support, potential for a further rise!
EURCAD bounced off its support at 1.47592 where it could potentially rise further to 1.48234.
Trading CFDs on margin carries high risk.
Losses can exceed the initial investment so please ensure you fully
understand the risks.

EURCAD potential reversal!
EURCAD expected to rise up to 1st resistance at 1.47610 where it could potentially react off and drop down to 1st support at 1.46915.
Trading CFDs on margin carries high risk.
Losses can exceed the initial investment so please ensure you fully
understand the risks.


EUR/CAD : Watch Flag and Strong SELLBUY & SELL As Per Above Given Chart or
You Can Also set Own Risk reward.
Let see what Will be Next Move.
Warning- I m Not a Financial Advisor this idea Only For Educational Purpose Only.
Thank You !!
