EUR/CAD New Short Setup Available, Hope This Time Will Move ! This is an educational + analytic content that will teach why and how to enter a trade
Make sure you watch the price action closely in each analysis as this is a very important part of our method
Disclaimer : this analysis can change at anytime without notice and it is only for the purpose of assisting traders to make independent investments decisions
Eurcadsetup

I love this EURCAD strategy 😍💪This buy is valid on our EURCAD 30M strategy.
Entry details are shown on the chart.
We're only looking for TP3.
Trade history can be seen below this trade idea too for full transparency.
As you will see this 1:3 RR strategy is a real strong one.
Do many of you guys back test your strategies?
Having a strategy tester built in to the script and knowing all the facts before placing a trade helps with keeping trading emotions in check.
------------------------------------------
I try and share as many ideas as I can as and when I have time. My trades are automated so I am not sat in front of a screen daily.
Jumping on random trade ideas 'willy-nilly' on Trading View trying to find that one trade that you can retire from is not a sustainable way to trade. You might get lucky, but it will always end one way.
------------------------------------------
Please hit the 👍 LIKE button if you like my ideas🙏
Also follow my profile, then you will receive a notification whenever I post a trading idea - so you don't miss them. 🙌
No one likes missing out, do they?
Also, see my 'related ideas' below to see more just like this.
The stats for this pair are shown below too.
Thank you.
Darren

EUR/CAD Trying To Make Head&Shoulders Pattern,Short Setup HereThis is an educational + analytic content that will teach why and how to enter a trade
Make sure you watch the price action closely in each analysis as this is a very important part of our method
Disclaimer : this analysis can change at anytime without notice and it is only for the purpose of assisting traders to make independent investments decisions


EUR/CAD Multi-Time frame analysisHi Traders
EUR/CAD Multi-Timeframe analysis
H1 Chart (Bearish)
A medium probability, entry signal to go SHORT will be given after the completion of a bearish trend reversal on the lower time frame at 1.46867 after the market found resistance at 1.47157 . Only the upward break of 1.47157 would cancel the bearish scenario.
Support & Resistance
1.46686 1.47146
1.46415 1.47270
1.45955 1.47431
H4 Chart (Bullish)
The completion of a trend reversal formation at 1.47288 has forced us to close our position earlier than we had planned. Now we are looking for the next opportunity to enter the market.
Support & Resistance
1.47410 1.47757
1.46415 1.47997
1.45810 1.48992
Daily Chart (Bearish)
The completion of a trend reversal formation at 1.47607 has forced us to close our position earlier than we had planned. Now we are looking for the next opportunity to enter the market.
Support & Resistance
1.47237 1.48156
1.45810 1.52092
1.44426 1.53833
Weekly Chart (Strong Up)
Waiting for a retracement higher towards the 1.47237 resistance level in order to reinstate SHORT positions. Next important resistance is the 1.50518 level.
Support & Resistance
1.45810 1.47237
1.44478 1.50518
1.42626 1.51914

EURCAD: possible LONG setup on DailyHi Traders,
This is my view on this cross for the next few days.
#EURCAD
Wait for the bullish environment to be confirmed, the structure to be broken and retested.
After that, you can go Long
BUY 1.50530
SL 1.488
TP 1.54
I remind you that this is only a forecast based on what current data are.
Therefore the following signal will be activated only if specific rules are strictly respected.
If you follow my strategy you will be able to identify the right filters and triggers to enter correctly the market and avoid fake signals.
I really hope you liked this video and I would like to know what do you think about this analysis, so please use the comment section below this video to give me your point of view.
Thank You
———————————
Pietro from Trading Kitchen

EUR/CAD New Pattern Analysis With great Pips This is an educational + analytic content that will teach why and how to enter a trade
Make sure you watch the price action closely in each analysis as this is a very important part of our method
Disclaimer : this analysis can change at anytime without notice and it is only for the purpose of assisting traders to make independent investments decisions

EUR/CAD New Analysis And 2 Setups Available To Catch 300 PipsThis is an educational + analytic content that will teach why and how to enter a trade
Make sure you watch the price action closely in each analysis as this is a very important part of our method
Disclaimer : this analysis can change at anytime without notice and it is only for the purpose of assisting traders to make independent investments decisions

EURCAD; Short, for now.This is dropping strait onto the 200 Months Ema. (In conjunction with a final Equities Blow-off Top ). - After which, this should be a one-way Long for the better part of "forever". (EUR positive account balance vs. CAD, a purely speculative bubble - in no small part where the Wilshire5000 / GDP having just hit 200%!)
The Weekly;

EURCAD - BUY to the targetOne more Drop to the 0.5
then BUY to the 0.618 target
LIKE - COMMENT - SHARE , the best analysis on the tradingview
I NEED YOU SUPPORT TO GROW!

EUR CAD SHORT ENTRY IM GOING SHORT ON THIS MARKET , DUE :
- RSI DIVERGNCE ON 15 MIN
- BROKEN RESSISTANCE
- 0,61 FIB RETRACEMENT
CONCULSION :
BETTER TO YOU TO FIND SHORT ENTRY BUT KEEP ON MIND THE REVERSAL , DUE THE SOLID TREND & THE H&S PATTERN !

EUR/CAD Hit All Targets +200 Pips And New Entry Available This is an educational + analytic content that will teach why and how to enter a trade
Make sure you watch the price action closely in each analysis as this is a very important part of our method
Disclaimer : this analysis can change at anytime without notice and it is only for the purpose of assisting traders to make independent investments decisions

EURCADPotentially a good trade brewing, I recommend a wait to see how market will choose to move
Like and follow for more, thanks

EUR/CAD Running In 40 Pips Profits And New Entry Added This is an educational + analytic content that will teach why and how to enter a trade
Make sure you watch the price action closely in each analysis as this is a very important part of our method
Disclaimer : this analysis can change at anytime without notice and it is only for the purpose of assisting traders to make independent investments decisions

#EURCAD creating a SHS pattern, wait for confirmation!#EURCAD creating a SHS pattern, wait for confirmation!


EUR/CAD New Long Setup With Daily Candle Closure This is an educational + analytic content that will teach why and how to enter a trade
Make sure you watch the price action closely in each analysis as this is a very important part of our method
Disclaimer : this analysis can change at anytime without notice and it is only for the purpose of assisting traders to make independent investments decisions

EUR/CAD Finally Closed Above Our Res Area ,Let`s Catch This PipsThis is an educational + analytic content that will teach why and how to enter a trade
Make sure you watch the price action closely in each analysis as this is a very important part of our method
Disclaimer : this analysis can change at anytime without notice and it is only for the purpose of assisting traders to make independent investments decisions

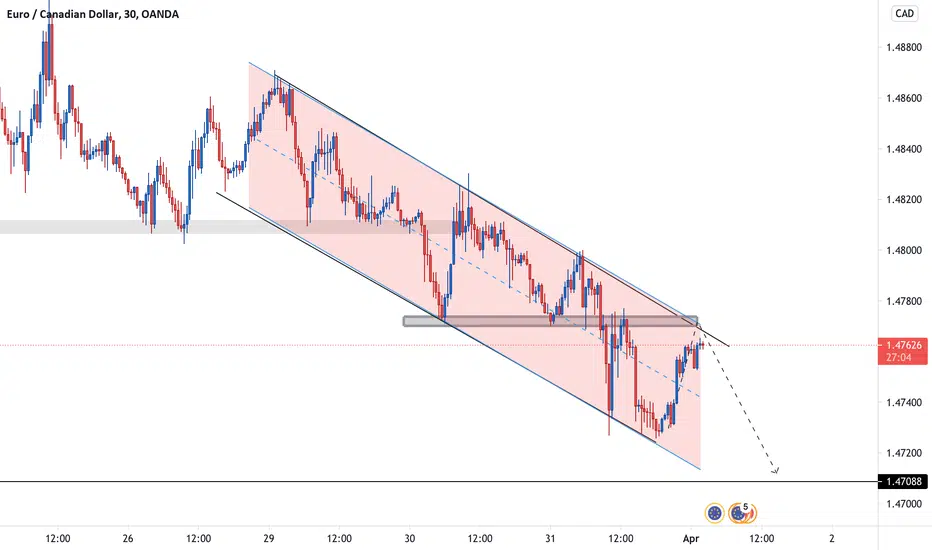
Bearish on EURCADClean bearish channel forming.
Price was able to break previous support level, wait to sell on the retest.
EUR/CAD Running In 60 Pips And New Entry Avialbe This is an educational + analytic content that will teach why and how to enter a trade
Make sure you watch the price action closely in each analysis as this is a very important part of our method
Disclaimer : this analysis can change at anytime without notice and it is only for the purpose of assisting traders to make independent investments decisions

EUR/CAD At Very Important Area Now , It Will Break It ?This is an educational + analytic content that will teach why and how to enter a trade
Make sure you watch the price action closely in each analysis as this is a very important part of our method
Disclaimer : this analysis can change at anytime without notice and it is only for the purpose of assisting traders to make independent investments decisions

Possible buy setup for EURCADTo support my previous EURCAD setup post, this is the 1hr chart. Price has broken resistance (now new support) and retested that level. I think this pair will be good for a buy during London session.
