CADJPY Will Go Down!
HI,Traders !
CAD-JPY made a bearish
Breakout of the rising support
And is now consolidating
Below the line so we are
Bearish biased and we will
Be expecting a further
Bearish continuation !
Comment and subscribe to help us grow !
Eurcadshort

EURCAD – Two Key Levels, One Solid PlanOn this pair, we have two important levels:
🟡 The first level might act as a trap (stop hunting).
So don’t rush to buy — wait for confirmation.
🟢 The second level offers a safer buy opportunity.
As always, our plan stays firm —
we don’t tell the market what to do, we follow it.
🔻 If a clean break and valid pullback occurs on the first level,
a short trade toward the lower level is possible.
⚠️ This pullback short scenario is only valid until price reaches the lower level.
If price hits the lower level and starts moving up,
any short position becomes much riskier.
Discipline > Prediction.

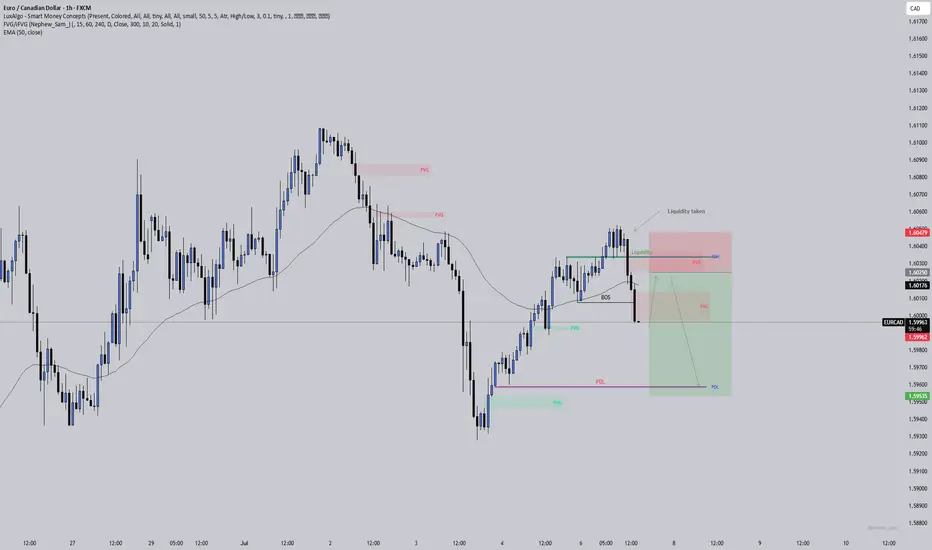
EURCAD: Liquidity taken, imbalance left behindPrice swept the liquidity above the previous day’s high and then broke structure to the downside. That’s often a sign that smart money was hunting stops before shifting direction. Now I’m watching for price to come back and fill the imbalance (FVG) it left after the break.
If that happens and price respects the FVG zone, we could see a continuation lower with the next target being the previous day’s low where more liquidity is likely sitting.
I’ve also added the 50 EMA here as confluence. It helps keep me trading in line with the broader market flow and stops me from fighting the trend.
This is one of those spots where patience is key . Let the market return to the zone on its own terms, wait for a reaction, and keep protecting your mindset just as carefully as your capital.
EURCAD Will Go Down!
HI,Traders !
EUR-CAD made a bearish
Breakout of the rising support
And is now consolidating
Below the line so we are
Bearish biased and we will
Be expecting a further
Bearish continuation !
Comment and subscribe to help us grow !

EURCAD - Overextended and Ready to Reverse?The EURCAD pair is showing clear signs of exhaustion in its bullish trend on the monthly chart, with an overextended price that has already liquidated a significant high. Futures market analysis confirms the accumulation of short positions, suggesting a potential bearish movement driven by institutional players. On the daily chart, the price has shifted to a clear downtrend.
Technical Analysis:
🔹 Monthly Chart:
The price has reached overextended levels, signaling a possible reversal.
A key high has been liquidated, indicating potential demand exhaustion.
🔹 Futures Market Data:
Short positions are accumulating, showing that major market participants are positioning for a bearish move.
Commercial market conditions reflect a weakening bullish sentiment.
🔹 Daily Chart:
Structural change confirms a bearish trend.
Possible selling opportunities on pullbacks to recent resistance levels.

EUR/CAD Best Place To Sell Very Clear , Ready For 250 Pips ?Here is my opinion on EUR/CAD , I See that the price will touch 1.59500 and then go down very hard cuz it`s a very good res area and forced the prices to go down very hard last time and prove that it`s a good res , so i will sell this pair when the price touch this area and give us a good bearish price action for confirmation .

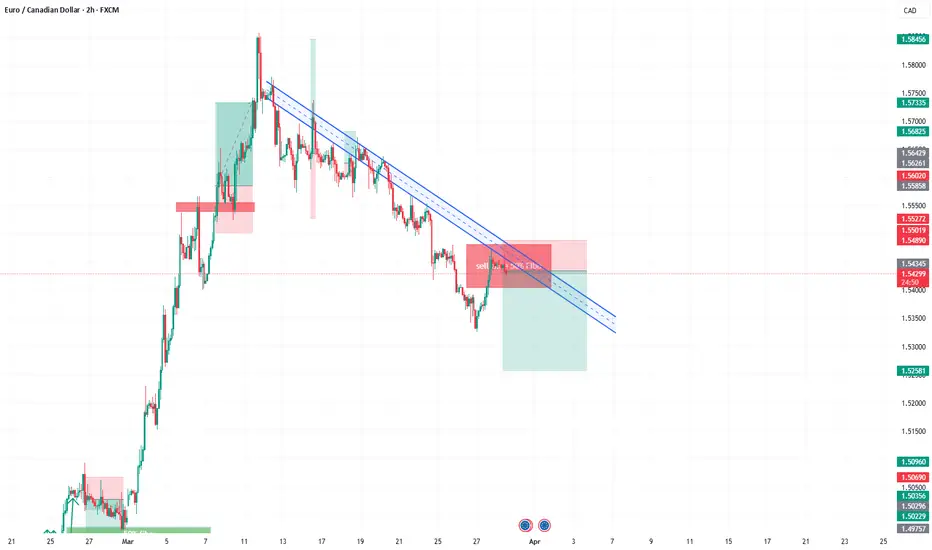
EURCAD's Triangle Hints Drop AheadThe correction looks like a contracting triangle, which is a common pattern in Elliott Wave theory. This kind of triangle usually forms during wave B or wave 4. It includes five smaller waves labeled A, B, C, D, and E, which move within two sloping lines that get closer together. There is also a demand zone marked in red on the chart.
Triangles often show a pause in the market before the price continues in the same direction as before. In this case, the triangle suggests that once wave E is complete, the price may drop again to finish wave C. The expected target area is between 1.54900 and 1.54320. This outlook remains valid as long as the price stays within the correction channel.

Will EURCAD rise from a strong Support LevelHello Traders
In This Chart EURCAD HOURLY Forex Forecast By FOREX PLANET
today Gold analysis 👆
🟢This Chart includes_ (EURCAD market update)
🟢What is The Next Opportunity on EURCAD Market
🟢how to Enter to the Valid Entry With Assurance Profit
This CHART is For Trader's that Want to Improve Their Technical Analysis Skills and Their Trading By Understanding How To Analyze The Market Using Multiple Timeframes and Understanding The Bigger Picture on the Charts

EUR/CAD Bearish Flag Breakdown Toward Fibonacci SuppAnalysis
1. **Trend Breakdown:**
* The chart shows a clear **bearish structure** developing after a strong rally to the 1.58800 area (Fibonacci 1.618 extension level).
* Two upward trendlines were broken successively, confirming bearish momentum.
2. **Fibonacci Levels:**
* The retracement from 1.58800 down to the 0.382 level (1.54586) has held significant importance.
* Price action is respecting the **Fibonacci retracement zones**, with rejection near the 0.786 and 1.0 levels (1.56915 - 1.57109).
3. **Bearish Flag Pattern:**
* A small **bearish flag/pennant** formed after a strong drop, which has now broken downward.
* This confirms the **continuation of the bearish move**.
4. **Volume Confirmation:**
* Volume spikes during the initial sell-off and again on recent bearish candles suggest **strong selling interest**.
5. **Trade Setup (Marked on Chart):**
* **Entry:** Near 1.56443
* **Stop-Loss:** Around 1.57109 (just above recent highs)
* **Target:** Around 1.54848–1.54500 zone, aligning with prior demand and 0.382 Fib level
---
**Conclusion:**
The chart signals a high-probability **short setup**, backed by a break of structure, Fibonacci confluence, bearish flag breakdown, and volume. A continued decline toward the 1.54500–1.54800 region is likely, provided the price stays below 1.57100.

EURCAD SELL.SHORTBy utilizing levels, historical patterns, , we can formulate a hypothesis that the market might follow a similar trajectory if bearish sentiment prevails.

EURCAD SELL/SHORTBy utilizing levels, historical patterns, , we can formulate a hypothesis that the market might follow a similar trajectory if bearish sentiment prevails.

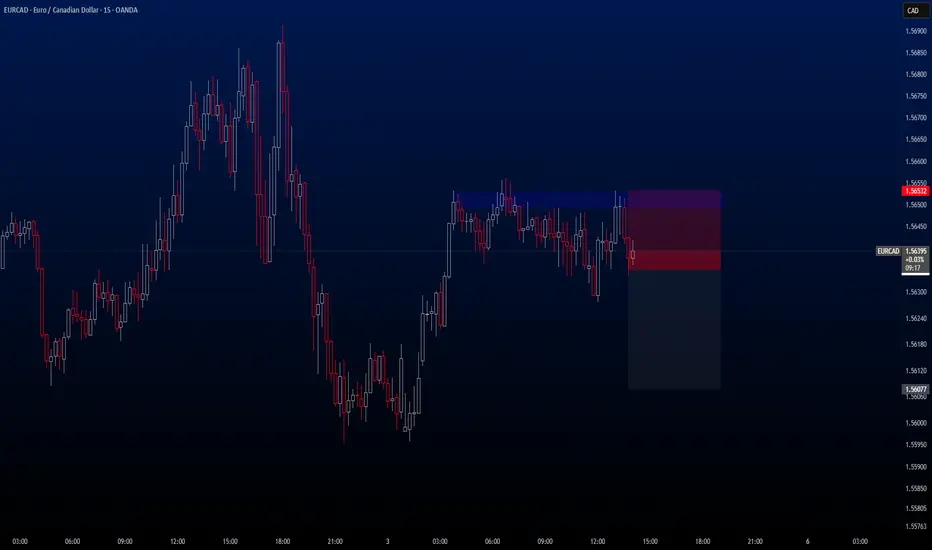
EURCADThere’s a solid opportunity for a sell trade on EURCAD. Although it's a relatively volatile pair, I'm planning to take the trade.
🔍 Criteria:
✔️ Timeframe: 15M
✔️ Risk-to-Reward Ratio: 1:1.50
✔️ Trade Direction: Sell
✔️ Entry Price: 1.56350
✔️ Take Profit: 1.56077
✔️ Stop Loss: 1.56532
🔔 Disclaimer: This is not financial advice. It's a trade I’m taking based on my own system, shared purely for educational purposes.
📌 If you're also interested in systematic and data-driven trading strategies:
💡 Don’t forget to follow the page and subscribe to stay updated on future analyses.
EUR/CAD Trying To Breakout Strong Support , Be Ready For Sell !Here is my opinion about EUR/CAD , The price at very strong support and can`t close below it , so if we have a clear closure below it we can enter a sell trade with the retest and targeting 150 pips at least . just wait for the breakout and for bearish Price Action and then we can go down hard with it ! if we have not a closure below so this idea should be canceled .

EURCAD at 2009 Highs – Is a Massive 1,000 Pip Sell-Off Imminent?It's been a while since my last idea! (Too busy traveling lately 😅)
Today, we're zeroing in on a high-probability short setup on EURCAD. This pair has surged strongly since the start of the year, fueled by all the Trump-related market chaos.
Once we smashed through 1.52—last year's key resistance (a level where we previously banked over 600 pips on a massive drop)—the market has been steaming towards the next major SELL zone between 1.58 and 1.615. This area has been rock-solid resistance since 2009, causing significant sell-offs each time we've tested it. Can history repeat itself? Let’s dive into the charts.
Weekly Chart:
After the initial spike into our key zone in early March, we saw an immediate 600-pip rejection, but buyers quickly regrouped and drove the pair to fresh highs near 1.60. Crucially, we're now seeing a lack of follow-through on recent highs, which is a classic sign of buyer exhaustion. Even more telling, this week's candle is a spinning top—a textbook reversal signal.
Daily Chart:
Zooming into the daily timeframe, price action is becoming increasingly choppy with multiple rejection candles at the highs—clear signs that sellers are starting to step in. Additionally, MACD divergence is glaringly obvious, reinforcing the bearish setup.
4-Hour Chart:
At the 4-hour level, the market is now trapped in a tight sideways range between 1.57 (floor) and just above 1.58 (ceiling). The MACD continues to signal divergence—another strong indication that the bullish momentum is losing steam and a reversal is likely imminent.
How I'm Trading It:
Given all these signals, I'm using my TRFX indicator to build a long-term short position, targeting sell signals on the 8-hour and daily charts. The daily chart alone has been flashing multiple sell signals already (see below):
One last thing: Don’t be surprised by a quick fake-out spike toward the upper bound at 1.615—it’s very common in setups like these. Any sharp spike up should get quickly rejected, giving us another great selling opportunity.
Targets:
First Target: Last year's major resistance at 1.52—expect a reaction and possibly a bounce here.
Second Target: Longer term, I'm eyeing a deeper move toward the major support level around 1.43, offering a huge profit potential if the reversal fully plays out.
That's my game plan—let me know your thoughts below! 😊

EURCAD SELL/SHORTBy utilizing Fibonacci retracement levels, historical patterns, , we can formulate a hypothesis that the market might follow a similar trajectory if bearish sentiment prevails.
EURCAD Breakdown: Major Reversal Incoming? Watch This Setup!In this video, we analyze a high-probability trade setup on EURCAD, breaking down key market structure shifts and potential reversal zones. 📊
🔹 Massive impulse move into key resistance – Is a pullback coming?
🔹 Breakdown of bullish structure – Signs of a trend shift?
🔹 Key entry & exit points mapped out – Waiting for confirmation at 1.5595
🔹 Targeting major liquidity zones – Potential downside to 1.5523, 1.5400, and 1.5155
If price rejects our marked resistance zone, we could see a strong move downward, stopping out euphoric buyers and creating new trading opportunities. But what if it breaks above? We discuss both scenarios and how to react accordingly.
📍 Watch until the end for a full breakdown and trade execution strategy!
💬 Drop your thoughts in the comments! Do you see something different in this setup? Let’s discuss.
🚀 Like, share, and follow for more market insights!

EURCAD - Weekly Forecast - Technical Analysis & Trading IdeasOANDA:EURCAD
💡 Daily Timeframe:
As forecasted by 4CastMachine AI, The Euro also reached our TP7 at 1.5777 by breaking the resistance at 1.5156.
The broken resistance area will serve as our new support area and Buy Zone.
As long as this area is not broken down, there is a possibility of a resumption of the uptrend.
If the price enters our new buy zone with a corrective wave and is rejected from it, we will enter with buy trades.
💡 H4 Timeframe:
The bearish wave is expected to continue as long as the price is below the strong resistance at 1.5857
💡 H1 Timeframe:
The uptrend is broken, and price is in an impulse wave.
1.5729 support is broken now. It will act as a Resistance now!
Forecast:
Correction wave toward the Sell Zone
Another Downward Impulse wave toward Lower TPs
__________________________________________________________________
❤️ If you find this helpful and want more FREE forecasts in TradingView,
. . . . . . . . Hit the 'BOOST' button 👍
. . . . . . . . . . . Drop some feedback in the comments below! (e.g., What did you find most useful? How can we improve?)
🙏 Your support is appreciated!
Now, it's your turn!
Be sure to leave a comment; let us know how you see this opportunity and forecast.
Have a successful week,
ForecastCity Support Team

EURCAD Daily Trade Setup – Targeting Buy-Side Liquidity! 🔹 Daily FVG Mitigation: Price is currently in a Fair Value Gap (FVG) on the daily timeframe, indicating potential institutional interest.
🔹 Change of Character (ChoCH) on Daily: A bullish shift in structure suggests that smart money may be accumulating positions for an upward move.
🔹 Liquidity Target: The next expected move is towards Buy-Side Liquidity, where stop-loss clusters and pending orders reside.
📊 Trade Plan:
✅ Entry Confirmation: Lower timeframe (H4/M15) Break of Structure (BOS) + Order Block (OB) Retest
✅ Stop Loss: Below the last swing low or OB for proper risk management
✅ Take Profit: Buy-side liquidity level / Key resistance zones
✅ Risk-to-Reward Ratio: Minimum 1:3 to maximize potential gains
🔍 Key Considerations:
📈 Volume Confirmation: Institutional volume alignment (POC, HVN) for strong confirmation
⏳ London & NY Sessions: Best execution timings for high-probability moves
📅 Upcoming News Events: Watch for high-impact events that may influence EUR or CAD
⚠️ Risk Disclaimer: This is for educational purposes only, not financial advice. Manage your risk accordingly!
📊 What’s your bias on EURCAD? Comment below! 👇💬
#EURCAD #SmartMoneyConcepts #SMC #ICT #ForexTrading #LiquidityHunt #OrderBlocks #FairValueGap #ForexAnalysis 🚀📉

EUR/CAD Technical Analysis – Price Rejection at Key ResistanceEUR/CAD has reached its highest level since August 2024, touching a major resistance zone. However, instead of breaking higher, the price has faced strong rejection, indicating that sellers have stepped in with force.
The pair tested a critical resistance level but failed to break through, signaling a potential shift in momentum.
The rejection suggests that buyers may be losing control, giving sellers an opportunity to push prices lower
Downside Targets:
The next potential target for sellers is 1.50000, a psychological and technical support level.
If selling pressure remains strong, the second downside target is 1.48800

EURCAD at Key Resistance Zone - Potential Drop to 1.50180OANDA:EURCAD has reached a significant resistance zone, marked by prior price rejections, suggesting strong selling interest. This area has previously acted as a key supply zone, increasing the likelihood of a bearish reversal if sellers regain control.
If the price confirms resistance within this zone through bearish price action (e.g., wicks or rejection candles), we could see a move toward 1.50180, which represents a logical target based on recent structure.
However, if the price breaks and holds above this resistance area, the bearish outlook may be invalidated, potentially opening the door for further upside.
Just my take on support and resistance zones—not financial advice. Always confirm your setups and trade with solid risk management.
Best of luck!

EURCAD Approaching Major Resistance — Potential Sell OpportunityOANDA:EURCAD is approaching a significant resistance zone, a level where sellers have consistently stepped in, leading to notable bearish reversals in the past. This area is marked by strong selling interest and historical price reactions, increasing the likelihood of bearish move if sellers regain control.
The current price action suggests that if the pair confirms resistance through signals like bearish engulfing candles, long upper wicks, or increased selling volume, we could see a downward move toward 1.49830 — a logical target based on previous price behavior and market structure.
However, if the price breaks above this zone and sustains, the bearish outlook may be invalidated, opening the door for further upside.
Just my take on support and resistance zones—not financial advice. Always confirm your setups and trade with solid risk management.
Best of luck!

EURCAD Sell setupOn EURCAD we are bearish for our next setup. Currently we are waiting for price to push till our areas of interest, where we will be looking to short this particular pair. Follow for more updates.

EUR/CAD - 1H Trade Setup Must Follow🔹 Pair: EUR/CAD
🔹 Timeframe: 1H
🔹 Analysis Type: Break & Retest
📊 Market Structure:
The price was respecting an ascending trendline but has now broken below it, indicating a possible trend reversal.
A bearish break of structure has occurred, confirming a shift to the downside.
Key Supply Zone around 1.48775, acting as resistance.
Key Demand Zone around 1.47516, a potential target area.
📉 Trade Setup (Short Position):
✅ Entry: After the break of the trendline and a bearish retest near 1.48400 - 1.48775.
📍 Stop Loss: Above the recent high (1.48775).
🎯 Take Profit: 1.47516, aligning with the next demand zone.
📏 Risk-Reward Ratio: 1:2
⚠️ Confirmation Checklist:
✅ Break & Retest of trendline
✅ Rejection from Supply Zone
✅ Momentum shift to bearish
📌 Keep an eye on price action around 1.48400; if price shows rejection with bearish confirmations, this setup remains valid.
🚀 Good luck & trade safe!
