EURCAD is approaching resistance, potential reversal |1 Apr2021
Prices are approaching resistance in line with our descending trend line where we could see a reversal below this level. Ichimoku cloud is showing signs of bearish pressure as well, in line with our bearish bias.
Eurcadshort

Bearish on EURCADClean bearish channel forming.
Price was able to break previous support level, wait to sell on the retest.
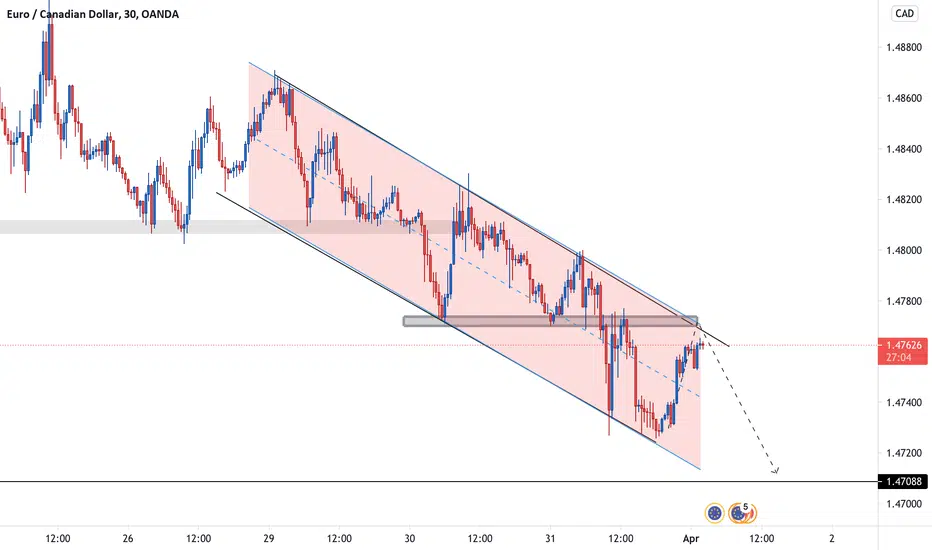
EURCAD approaching 1st resistance, potential for reversal!Price is approaching our 1st resistance, which is in line with our 50%, 61.8% Fibonacci retracement, 78.6% Fibonacci extension and horizontal overlap resistance. We could potentially see a reversal at this level and further downside towards our 1st support, in line with our 61.8% Fibonacci extension and horizontal swing low support. Price is also holding below the Ichimoku cloud and descending trendline resistance, showing bearish pressure in line with our bearish bias.
Trading CFDs on margin carries high risk.
Losses can exceed the initial investment so please ensure you fully understand the risks.

EUR/CAD Running In 60 Pips And New Entry Avialbe This is an educational + analytic content that will teach why and how to enter a trade
Make sure you watch the price action closely in each analysis as this is a very important part of our method
Disclaimer : this analysis can change at anytime without notice and it is only for the purpose of assisting traders to make independent investments decisions

EURCAD approaching descending trendline, potential for reversalPrice is holding below the Ichimoku cloud and descending trendline resistance, showing bearish pressure in line with our bearish bias. We could potentially see a reversal at 1st resistance, in line with our 61.8% Fibonacci retracement, 100% Fibonacci extension and horizontal swing high resistance, and further downside towards 1st support, in line with our 100% Fibonacci extension and horizontal swing low support.
Trading CFDs on margin carries high risk.
Losses can exceed the initial investment so please ensure you fully understand the risks.

EUR/CAD At Very Important Area Now , It Will Break It ?This is an educational + analytic content that will teach why and how to enter a trade
Make sure you watch the price action closely in each analysis as this is a very important part of our method
Disclaimer : this analysis can change at anytime without notice and it is only for the purpose of assisting traders to make independent investments decisions

Breakout setting up EURCAD The pair is in a downtrend and an opportunity to join is likely to present itself this week (starting 29 Mar, 2021).
My chart shows what I am seeing, just pure price action supported by 20 EMA.
If you like my analysis please give it a “thumbs up” and follow me to get immediate notifications.
As always, please use sound money and risk management in all your trades.


EurCad SellEurCad having been bearish since the beginning of the week, gave an impulsive bearish move followed by a bullish corrective structure, I couldn't find an entry at the top of the channel, but right now, I think the corrective structure has come to an end, hence, a sell continues

EURCAD: short opportunity on h4Hi Traders,
This is my view on this cross for the next few days.
#EURCAD
SELL 1.48550
SL 1.4904
TP 1.473
I remind you that this is only a forecast based on what current data are.
Therefore the following signal will be activated only if specific rules are strictly respected.
If you follow my strategy you will be able to identify the right filters and triggers to enter correctly the market and avoid fake signals.
I really hope you liked this video and I would like to know what do you think about this analysis, so please use the comment section below this video to give me your point of view.
Thank You
———————————
Trading Kitchen

EUR/CAD Technical Analysis.Hello traders, EUR/CAD is trading at 1.4850. The Pair is trading in ascending resistance and support wedges from some time and the price just touched support level. As the price has touched support level it will give a small pull back and then it can come down to break the support level. If the price breaks the support level then its target price will be at 1.4721.
Follow proper risk management strategy to avoid unnecessary losses and to increase profitability, don't risk more than 2% of your capital on each trade.
Do follow us for future Forex trend analysis and Ideas.
Thank you,
Rishikesh Lilawat


EURCAD short trade ideaPlan: wait for the price to bounce off from resistance level --> wait for the rejection candle pattern to form e.g. bearish engulfing, pinbar, etc --> SELL
**Disclaimer** the content on this analysis is subject to change at any time without notice, and is provided for the sole purpose of assisting traders to make independent investment decisions.
Traders!! if you like my ideas and do take the same trade as I do, please write it in a comment so we can manage the trade together.
_____________________________________________________________________________________________________________________
Thank you for your support ;)
GWBFX

possible day trading setup for EURCADDay trading setup to enter the sell on EURCAD. Sell at rejection of resistance with clear reversal candlestick pattern only.

EUR/CAD | Potential Downward Movement 🔨🔨🔨Technical Analysis:
The price on the higher time is showing lower lows and highs where it is smashing all the daily supports. Recently, the price posted a correction count toward the resistance (previously support) at 1.4914 USD level. On the lower time frame, the price is forming a bearish pennant, where we expect a breakout to the downside and then a move downward toward the 1.4852 USD mark.
-------------------------------------------------------------------------------------
Trade Idea:
Sell Limit Order @ 1.4914
Take Profit @ 1.4852
Stop Loss @ 1.4940
Trade Safely 🙂

EURCAD TP1 HIT FOR +60 PIPS! LAST WEEKS RECAP FRIDAYSo our final trade placed on early friday morning was the EURCAD pair. We've watched this position for weeks lining up and we knew it was going to be a big one. We secured huge capital gains in this trade and was very confident that the trade would play into our favour. The pair fell nicely into profits within the first 20 minutes of entering and continued to fall deeper and deeper. Around 3 hours later and our first Take profit target was reached for a total of +65 Pips. We then allowed TP2 to run further until eventually we manually closed out and secured a further +80 Pips before the market closure on friday.
This week we have had wining trades and loosing trades but all together we are up roughly +245 Pips for a total of 3 days trading. Last week was a massive week for us here at forexinsihgtsuk and we are now back on the grind this morning looking to continue analysing the markets for the best setups.
We stay humble and we move forward.
Happy Monday traders. Good luck!

EUR/CAD New Trade And 400 Pips Avialbe This is an educational + analytic content that will teach why and how to enter a trade
Make sure you watch the price action closely in each analysis as this is a very important part of our method
Disclaimer : this analysis can change at anytime without notice and it is only for the purpose of assisting traders to make independent investments decisions

Eur/CadLooking to place a sell limit @ 1.49279
Stop Loss @ 1.49699 (42 pips)
Take Profit @ 1.48423 (85 pips)

EURCAD will fly any moment EURCAD bullish pattern ready to a spike up next months
Watch lower timeframes for the best entries for the up movement
Good luck

EURCAD is facing bearish pressure | 12 Mar 2021Price is facing bearish pressure from our resistance and descending trend line, Ichimoku cloud is showing signs of bearish pressure as well in line with our bearish pressure.

EURCAD is facing bearish pressure | 12 Mar 2021Price is facing bearish pressure from our resistance and descending trend line, Ichimoku cloud is showing signs of bearish pressure as well in line with our bearish pressure.

💡 EUR/CAD Swing Short potential Hey traders👨💻 This pair looks like it will eventually melt down. Keeping a close eye on this pair. As soon as I see confirmation I'll be riding it down 🌊 If you like the content leave a like and comment it's all appreciated 🤍
