EURCAD ANALYSISEURCAD ANALYSIS
Please consider to put a like to my idea for supporting me & subscribe for more ideas.
Idea is not the financial advice!
Eurcadshort

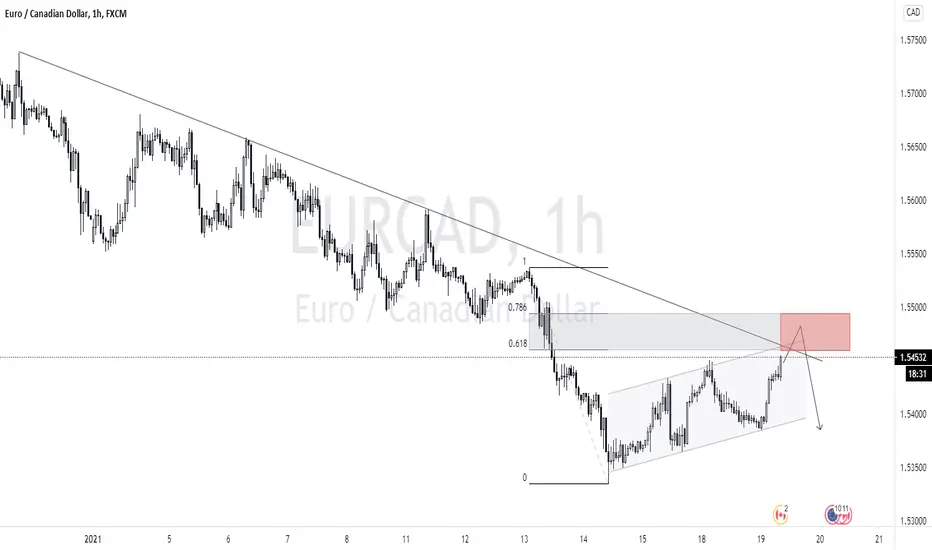
EURCAD bullish flagAs we can see a regular bullish flag in H1 chart. and upper trendline.
So we expect a fakeout near trendline before short term fall.
EURCAD H4 ANALYSIS (SELL) 5R TARGETWe chose to sell hard this pair because the price is hardly failing to maintain an upward move every moment it tries to do so. We target a 5R on this pair.

EURCAD Sell,Good Luck traders,join and earnHello Traders, here is the full analysis for this pair
Watch strong price action at the current levels for Buy. GOOD LUCK! Great SELL opportunity in EURCAD ..
I still did my best and this is the most likely count for me at the moment.

EURCAD HammerEURCAD has arrived to a support zone at 1.535, and formed the hammer pattern on the daily chart on the last day of the week. Here the price can break this support and fall to the next support around 1.5, or the price will turn around and continue the sideway moves between 1.535 and 1.575


EURCAD: Will the price COLLAPSE on this PULLBACK?Hi traders and welcome to my channel, if you enjoy my FREE Technical Analysis 📈 and Trading Tips 📉, support the idea hitting the LIKE 👍 button and don't forget to SUBSCRIBE ✔️ my channel, you won't miss anything !
🟢 Forex Pair :
EUR/CAD
⚪ Technical Analysis :
In the weekly perspective, since March 2020, the price has been moving creating a nice ascending channel, getting many rejections on the resistance zone at about 1.57953 and bouncing on the dynamic support on the main trendline.
In the daily chart, since May 2020, the price has been following the main weekly trendline and only few days ago it broke that for the first time.
In the h4 chart, since the end of December, after a clear rejection on the main resistance level, a strong impulse moved the price down starting a falling wedge pattern, breaking it on the 13th of January. (Many rejections on the dynamic S/R Level are an extra confirmation of the validity of that pattern).
During the last session the price reached the same level and the next price action around this zone will be essential to understand the next market movement.
🔴 Conclusion : ✔️
The price broke an important weekly trendline and it's actually pullback on the dynamic S/R level of the falling wedge.
I'm confident to see the price falling down trying to reach the next secondary trendline and my next target would be the level at 1.52805.
Stay tuned for Updates and Trading Signals !
What's your opinion? Share your idea writing a comment!
Please note the views are not investment advice and should be used only for educational purposes
Trade Safe and Responsibly ,
Gianni

EURCAD ( LET'S OPEN THE NEXT WEEK WITH EURCAD)looking for buying as long as price has tested the support

EURCAD SELL Trade IdeaLooking For A Downward Continuation With EURCAD
First Possible TP: 1.5337 Area
Second Possible TP: 1.53274 Area
Third Possible TP: 1.53108 Area

EURCAD - Bearish BiasEUR - BEARISH
1️⃣ Concerns over rising COVID-19 cases, fresh lockdowns and the slow pace of vaccination.
2️⃣ EUR slid after ECB President Lagarde said earlier on Wednesday that the central bank is closely following the performance of the exchange rate.
CAD - BULLISH
1️⃣ Rallied in oil prices support the commodity-linked currency the CAD.
=====
Technical
=====
We are looking to sell the EURCAD at SBR + below SMA 50 on the H1 chart.

EURCAD - Bearish BiasEUR - BEARISH
1️⃣ Concerns over rising COVID-19 cases, fresh lockdowns and the slow pace of vaccination.
2️⃣ The European Central Bank's economic bulletin showed that Euro Area economic indicators pointed to a fourth-quarter economic contraction.
3️⃣ The bloc's consumer prices remained in deflationary territory in December, while retail trade in November fell more than expected.
CAD - BULLISH
1️⃣ Coronavirus vaccination rollout is raising prospects of a swift economic recovery in the new year, although the pandemic is still far from controlled.
2️⃣ The Canadian economy advanced 0.4% in October, the 6th straight month of growth and the Manufacturing PMI for December was the strongest on record.
3️⃣ Rallied in oil prices boosted the CAD.
=====
Technical
=====
We are looking to sell the EURCAD below the resistance of 1.56200 + around SMA 50 on the H1 chart.

EURCAD Analysis/PatternEURCAD has rejected this resistance level several times these past few weeks. We can expect another rejection from level 1.57400. However, if price continues to act volatile at this key level there can be a possibility for a breakthrough. thoughts below


EURCAD LONGS & SHORTSI will be looking to trade this pair on its intra day bullish structure break to the upside with a limit set for shorts at point of TP and trading AFP from there.
Longs R:R 1:4
Shorts R:R 1:6
Total 10-20% based on risk.

EURO / CANADIAN DOLLAR ( SELL ) EUR/CAD SELL
Hello Traders 👋If you find this analysis useful, please support me with your likes and comments.
SL 1.55955
TP1 1.54646
TP2 1.53524
If you have another analysis at this pair, please share in comments, I will be glad to discuss with you.


EUR/CAD Technical Analysis
The counter has broken its near-term bullish trendline.
Then it formed a head and shoulder pattern and has broken down the neckline as well.
Hence, we expect the pair to be bearish in the near-term.

EURCAD Moving Towards The Support Level...We managed to see price level retesting the 23.6% fib level and now showing signs of BEARISH continuation. I will be expecting EURCAD to move towards the support level where 38.2% fib lies. Further confirmation will be determined after this movement. As of now, this is a good short term trade opportunity.
Kindly hit the LIKE Button if you agree with my analysis and feel free to COMMENT your idea below. As for those who are keen to get daily updates and analysis from me feel free to FOLLOW me. Cheers and Happy Trading!!

eurcad sell good lucklazy to explain just look if u know the strat and take it if u would like to , 1-3% risk per trade

EURCAD - Alternate Bat - Harmonic PatternHarmonic Pattern - Short
Large bearish engulfing candle confirming the pattern validity.
Classical approach take profit at 38.2 & 61.8 AD retracement.
Alternatively you can use resistance levels and/or moving averages as TP

EURCAD: Wolfe Waves PatternNice Sell opportunity on EURCAD, Daily Chart.
We have a Wolfe Wave pattern with a good Risk / Reward


EURCAD FOR SHORT SELL EURCAD
STOP : 1.57958
TAKE PROFIT : 1.55729
IF YOU using trailing stop use 810
have nice day my friends
cheeer
thomas
