EURCADBullish indicators:
1) Trading near major support area of 1.46100
2) Bullish Harami candle
3) Falling wedge
Bearish Indicators:
1) LL LH
2) Currently trading in downward trend
Plan A: On the bounce from the support area one can buy for the target 1.47733 first and then for the 1.48075.
Plan B: On the breaking of trendline and support one can sell for the target of 1.45826 where the major support lies.
Eurcadtrade

EURCAD: Don't Miss 400 PIPS Opportunity Till the end OctoberEURCAD
Duration 30-45 Days
Terms: Long Term / Swing Trade
Target: 400 PIPS
GOOD LUCK


EUR/CAD SHIRT TRADE IDEAEUR/CAD Signal
Market Sell: 1.50940
Stop-Loss: 1.51600
Target 1: 1.50000
Target 2: 1.48720
Stop-Loss: 66 pips
Risk: 0,5%
Risk-Reward: 3,35

EURCAD: SIGNAL ENTRY BUYbuy now EURCAD, with SUPER tiny stop loss, but good risk reward ratio.
Do your own risk and Good Luck.

✅✅ EURCAD LONG ✅✅What we see on EURCAD is quite clear and nice, price bouncing between two trendlines,
And for now we are in really strong area which you can see as gray rectangle
❗️ 1st lets wait for price to close above our support then set this order ❗️
2nd: set our 1:5 order and fly with the price
⚠️Take Max 1% of your capital on this trade⚠️
Lets see how price respects our each scenario
👇🏻👇🏻👇🏻 Any question comment bellow 👇🏻👇🏻👇🏻
GOOD-LUCK EVERYONE

eurcad selleurcad sell :
Reasons :
1)my ema lines confirmation(dont ask guys its secret)
2)nice pattern trend
3)naked candles will be appearing
but wait for more confirmations until we update here
take profit : green line
stop loss : red line

EURCAD LONG AT THE NEXT HALF YEAR.I think FX:EURCAD has a good long trend for the next 6-9 months.
We have now crossed the strong support line at 1.47320 and are consolidating at this level.
I indicated the points where you can fix the profit:
* TP1 = 1.52600 (November 2021)
* TP2 = 1.55840 (May 2022) << near border of flag


EURCAD Bull Start SoonWe expect EURCAD to move forward upside as it's consolidating a major support area last couple of weeks. Also, the Eurozone covid situation is under control, and most of the tourist spots will open soon.

EURCAD Seems to me Bulish Run Ahead!EURCAD daily time frame I can see it will create a W shape pattern and recover its gaining. On the other hand, we can also check the ABC pattern clearly. I'm expecting a strong Bull run.


EUR/CAD Multi-Time frame analysisHi Traders
EUR/CAD Multi-Timeframe analysis
H1 Chart (Bearish)
A medium probability, entry signal to go SHORT will be given after the completion of a bearish trend reversal on the lower time frame at 1.46867 after the market found resistance at 1.47157 . Only the upward break of 1.47157 would cancel the bearish scenario.
Support & Resistance
1.46686 1.47146
1.46415 1.47270
1.45955 1.47431
H4 Chart (Bullish)
The completion of a trend reversal formation at 1.47288 has forced us to close our position earlier than we had planned. Now we are looking for the next opportunity to enter the market.
Support & Resistance
1.47410 1.47757
1.46415 1.47997
1.45810 1.48992
Daily Chart (Bearish)
The completion of a trend reversal formation at 1.47607 has forced us to close our position earlier than we had planned. Now we are looking for the next opportunity to enter the market.
Support & Resistance
1.47237 1.48156
1.45810 1.52092
1.44426 1.53833
Weekly Chart (Strong Up)
Waiting for a retracement higher towards the 1.47237 resistance level in order to reinstate SHORT positions. Next important resistance is the 1.50518 level.
Support & Resistance
1.45810 1.47237
1.44478 1.50518
1.42626 1.51914

EURCAD; Short, for now.This is dropping strait onto the 200 Months Ema. (In conjunction with a final Equities Blow-off Top ). - After which, this should be a one-way Long for the better part of "forever". (EUR positive account balance vs. CAD, a purely speculative bubble - in no small part where the Wilshire5000 / GDP having just hit 200%!)
The Weekly;

EURCAD - BUY to the targetOne more Drop to the 0.5
then BUY to the 0.618 target
LIKE - COMMENT - SHARE , the best analysis on the tradingview
I NEED YOU SUPPORT TO GROW!

EUR CAD SHORT ENTRY IM GOING SHORT ON THIS MARKET , DUE :
- RSI DIVERGNCE ON 15 MIN
- BROKEN RESSISTANCE
- 0,61 FIB RETRACEMENT
CONCULSION :
BETTER TO YOU TO FIND SHORT ENTRY BUT KEEP ON MIND THE REVERSAL , DUE THE SOLID TREND & THE H&S PATTERN !

#EURCAD creating a SHS pattern, wait for confirmation!#EURCAD creating a SHS pattern, wait for confirmation!


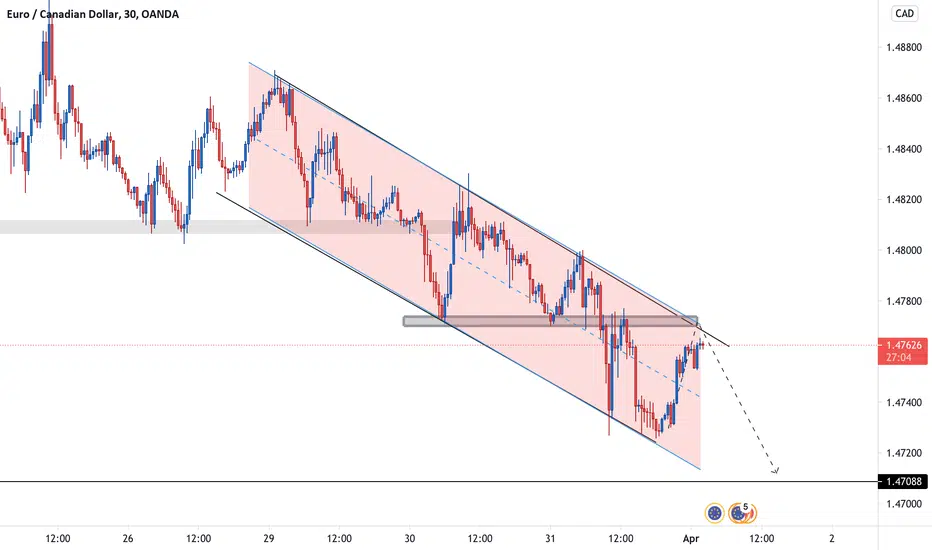
Bearish on EURCADClean bearish channel forming.
Price was able to break previous support level, wait to sell on the retest.
EURCAD will fly any moment EURCAD bullish pattern ready to a spike up next months
Watch lower timeframes for the best entries for the up movement
Good luck

