EURCHF LONG IDEAHey guys, this pair bounced from the daily support. i expect it to continue with it's bullish momentum until it takes out the highs on 1.05066
Eurchfanalysis

EUR/CHF New Long Entry To Get Easy 200 Pips !This is an educational + analytic content that will teach why and how to enter a trade
Make sure you watch the price action closely in each analysis as this is a very important part of our method
Disclaimer : this analysis can change at anytime without notice and it is only for the purpose of assisting traders to make independent investments decisions

EURCHFHello Guys, it's from HitProfit Trading Club.
as you guys can see, the price made a bullish pattern and rejected from POI level.
price is heavy bullish now.
we are buying this pair and our main target is TP level 2

EUR/CHF SELL IDEA
Hey tradomaniacs,
welcome to a new free trading-setup!
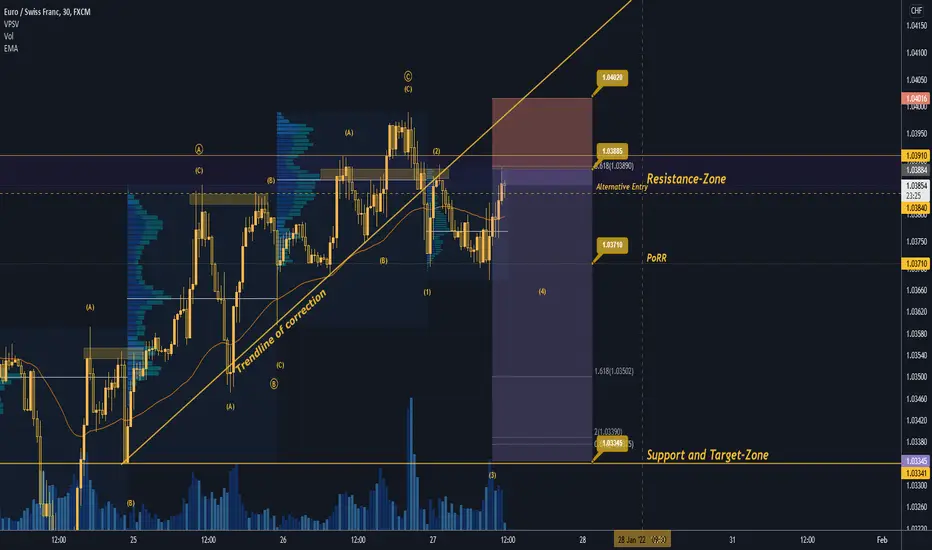
EUR/CHF: Daytrade-Preparation
Notice: Waiting for retracement and confirmation!
Market-Sell: 1.03885
Stop-Loss: 1.04020
Point of Risk-Reduction: 1.03710
Take-Profit: 1.03345
Stop-Loss: 13 pips
Risk: 0,5% -1%
Risk-Reward: 4,0
LEAVE A LIKE AND A COMMENT - I appreciate every support! =)
Peace and good trades
Irasor
Wanna see more? Don`t forget to follow me
EURCHF weekly tradethe correction is over and it's back to trend
don't forget money management
only risk 1% of your balance

EURCHF RISK LONGS📉📉📉📉 Expecting bullish price action on this pair as price takes out liquidity below the weekly lows + sell side liquidity (old low) i think we will go higher to fill bearish imbalance and also the possibility to go higher than weekly high.
What do you think ? Comment below..

EURCHF 4HR PRICE-ACTION LONG!
Two zones have setup Long Entry opportunities:
1st zone:
1.03921 | 1.04204 | 1.04191 zone for targets 1.04748 | 1.05554 | 1.06262
2nd Zone:
1.02934 | 1.02399 zone for targets 1.03966 and potentially 1.05554 | 1.06262.
Both zones are inline with Major Monthly Price Levels.
Note: Idea is to complement your research.
Check comments section for future updates on idea.
Like this idea? Like, Share, Comment, Follow, (...)
Thank you. Happy Trading.

EURCHFHello Guys, it's from HitProfit Trading Club.
as you guys can see price wipeout the liquidity from the strong support level which was 1.032850 level.
we are expecting a log and swing trade from the current level which is 1.03450 level.
so we are buying the pair right now.
thank you

Wait for a buy signal with EURCHFH4 time frame.
Structure: The downtrend ended when the price broke the Key Level at 1.04600.
Currently, the price is moving to retest and there is a possibility of forming a bullish pattern here.
Wait for the bullish pattern to appear, then you can look for buying opportunities.
Profit target is 1.05600 price zone.
-----------------------------------------------------------------------------------------------
Wish you all have a good trading day!

EUR/CHF Multi-Timeframe analysis - update !!!Hello Traders, here is the full analysis for this pair, let me know in the comment section below if you have any questions, the entry will be taken only if all rules of the strategies will be satisfied. I suggest you keep this pair on your watchlist and see if the rules of your strategy are satisfied.

EURCHF #EURCHF Hello everyone, and welcome to my TradingView profile, my name is TRADiNG_Club_ and today I am going to analyze #EURCHF a full technical analysis on different time frames using a translation of market information While doing so, let me give you a personal opinion about it. The next most likely market movement and helps you find and manage market opportunities.
My thoughts are for those who are interested in improving their financial education.
Thank You ❤

EURCHF - RESTESTING STRONG SUPPORT ZONEFX:EURCHF is again at the same level as of the month of January 2015.
Retesting the Support Zone. Time for Long trade
Happy Trading :)

EURCHF Mr. King: Hello everyone, and welcome to my TradingView profile, my name is TRADiNG_Club_ and today I am going to analyze EUR/CHF a full technical analysis on different time frames using a translation of market information While doing so, let me give you a personal opinion about it. The next most likely market movement and helps you find and manage market opportunities.
My thoughts are for those who are interested in improving their financial education.
Thank You..❤

EURCHF LongDetails can be seen on chart.
Price hitting channel bottom. No OB found and prices are in heavy down trend so little risky trade.

EURCHF top-down analysisHello traders, this is the full breakdown of this pair. We will take this trade if all the conditions are satisfied as discussed in the analysis. Smash the like button if you find value in this analysis and drop a comment if you have any questions or let me know which pair to cover in my next analysis.

A glance into CHF crosses (The ultimate safe heaven)Hi traders, in this post let's take a look into the CHF crosses which not only I think presents good trading opportunities, but also will give us a " feeling" about the risk in the markets at this moment.
EurChf:
As you can see in the main chart (weekly) EurChf is in a clear downtrend since the beginning of the 2007-2008 financial crisis and in the past 7 years, the pair has formed a pattern that resembles an H&S. More importantly though is that the pair is trading at this moment exactly in a strong support above 1 very important figure(We don't care about 3% difference looking at a longer TF)
Going to daily
Here we can see that since March's top above 1.1, the pair has started to drop, and since September, this drop is accelerating, but more importantly, in the past 2 months, EurChf has broken under 3 important daily support levels.
The month of December is marked by consolidation with the pair trading in a tight range. However, last week can give us a clue, with the strong selling and reversal before the 1.05 figure.
In conclusion, I expect EurChf to continue its descent at the beginning of 2022 and to reach at least parity figure.
GbpChf:
Similar to EurChf, here also we have a multi-year downtrend, and going to the daily chart, we can see that the pair is accelerating down since late October also here.
December, in GbpChf's case, is marked by a flag, which can lead to continuation, and, very important in my opinion, the BoE rate rise did nothing but a spike up, strongly reversed, leaving a Pin Bar on our chart.
1..2150-1.22 is the support zone, and a break here could accelerate losses to the next important support under 1.17. Such a trade would have a 1:3 risk: reward ratio and, in my opinion, GbpChf needs to be on our watch list in the next weeks.
AudChf:
We can see something similar in AudChf, a pair very sensitive to risk... The pair is accelerating its loss in late October and we have a break under very important 0.67 support, with this break confirmed as genuine last week.
The next support for this pair is 0.64 zone, but once this is cleared, AudChf can spiral down to at least 0.6

EURCHFEURCHF: Expecting a liquidity grab before Bearish sentiments.
wait for price to pul back to the entry zone, then you can sell this pair.

EURCHF SHORTS 📉📉📉Expect the price to start the selloff from this area, we are in a huge bearish market structure on a HTF premise. Price is being in a premium area market on fibonaci rejecting a h1 orderblock and taking out buy stops on its way.
I want to see another leg to the downside for the ECHF, retail heard are LONG there.
What do you think ? Comment below..

EUR/CHF Looking For Longing Opportunity EURCHFEURCHF reached a weekly and monthly major support level and retested the trendline after a strong impulse to the downside without any correction. We can expect growth from here before continuing the move to the downside or break of the bearish movement.
The EUR is very weak at the moment as the covid-19 spread over Europe which weakening the euro, but since the new variant arrived the other currencies will be affected by it and it can cause a downtrend of these currencies as well which will cause a short term longing opportunity the EURCHF and other EUR pairs as the EUR is currently overextended to the downside.
This post does not provide financial advice. It is for educational purposes only! You can use the information from the post to make your own trading plan for the market. But you must do your own research and use it as the priority. Trading is risky, and it is not suitable for everyone. Only you can be responsible for your trading.

EURCHF SHORTS PENDING 📉📉📉Expect short opportunities around 1.04800 area, bearish market structure on a HTF orderblock h4 + imbalance fill, right now price took out liquidity from the retail trendline and should reverse. I will announce you when i will entry there !
What do you think ? Comment below..

EURCHF: Short Opportunity EURCHF is around an important level (Resistance), also a Fibonacci key level (0.618), going into a bearish trend since many weeks.
Will our short sell get activated ?
Time will tell
~ Cyril

EURCHFTF: H4
Details on chart:
Last week, price aggressively broke the Weekly Support Zone.
currently, price is going to this level for a possible short trade

EURCHF longEURCHF with a falling wedge gathering bulls strenght to go up
Price breaking the wedge will breakout
