EUR/CHF Bullish Vault Raid – The Franc Robbery Begins!💣EUR/CHF Bullish Heist: Thief's Franc Escape Plan 🚨💰
🚨Asset: EUR/CHF "Euro-Franc" Forex Market
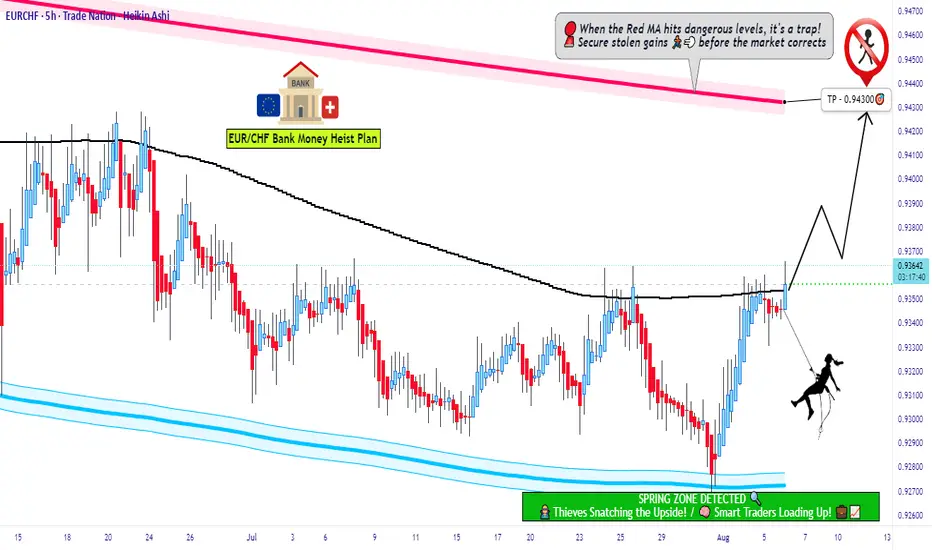
📈Plan: Bullish
🎯Entry: Any price level (No breakout entry nonsense – we're stealthy robbers)
🛑Stop Loss: 0.93200
🏆Target: 0.94300
👑Thief's Statement:
Hey Money Muggers & Market Marauders! 🥷💰
Today, we strike the Euro-Franc vault with a clean bullish heist plan. No noise, no breakout bait — just silent limit orders stacked like layers on a cake 🍰.
🎭We ain’t chasing price… we let price chase us! Smart thieves wait. Pullbacks? That’s our entry door 🧨🚪.
🔑Gameplan:
📦 Entry:
🕵️♂️Layer up your Buy Limit orders near recent pullbacks or swing lows.
⏳Wait on the 15M or 30M timeframe for the cleanest setups.
📉No breakout entries – thieves don’t chase, we trap.
🛡️Stop Loss (SL):
🧱Set at 0.93200 — hidden just below the thief's last cover zone.
🎲Risk based on your position size & how many orders you layer.
🎯Keep it tactical. One mistake and the vault closes!
🏁Target (TP):
💎0.94300 is the escape tunnel.
💨Exit fast if heat rises before the target hits. Smart thieves know when to run!
👊Scalpers’ Note:
🪝Only ride long waves — don’t swim against the current.
💣Use trailing SL to secure the loot as price climbs.
👑Big pockets? Dive in. Small pockets? Swing with precision.
🧠Why We Rob Here:
EUR/CHF fundamentals align with the bulls. We're riding sentiment, intermarket flow, and positioning from big money. COT, macro signals, and FX momentum all say: Thieves, it's go time! 🚨
📢News Alert:
❌ Avoid entries during high-impact news – it ain’t worth jail time (or stop hunts).
🎯Use a trailing SL to protect gains if caught mid-heist during volatility.
🔥Like the Plan? Hit that Boost Button 💥
Join the Thief Squad and let’s rob the FX banks together 💵💎
Catch you in the next heist drop 🐱👤🚀
Eurchfsignals
EURCHF Bullish break-out signal above the 1W MA50.The EURCHF pair has rebounded on its 1.5-year Support Zone. A break above its 1W MA50 (blue trend-line) is a bullish break-out signal that would target Resistance 1 at 0.96650. That is where it can potentially make contact with the 1W MA200 (orange trend-line) for the first time since March 01 2021.
-------------------------------------------------------------------------------
** Please LIKE 👍, FOLLOW ✅, SHARE 🙌 and COMMENT ✍ if you enjoy this idea! Also share your ideas and charts in the comments section below! This is best way to keep it relevant, support us, keep the content here free and allow the idea to reach as many people as possible. **
-------------------------------------------------------------------------------
💸💸💸💸💸💸
👇 👇 👇 👇 👇 👇

EURCHF LONG/BUYBy utilizing Fibonacci retracement levels, historical patterns, , we can formulate a hypothesis that the market might follow a similar trajectory if bullish sentiment prevails.
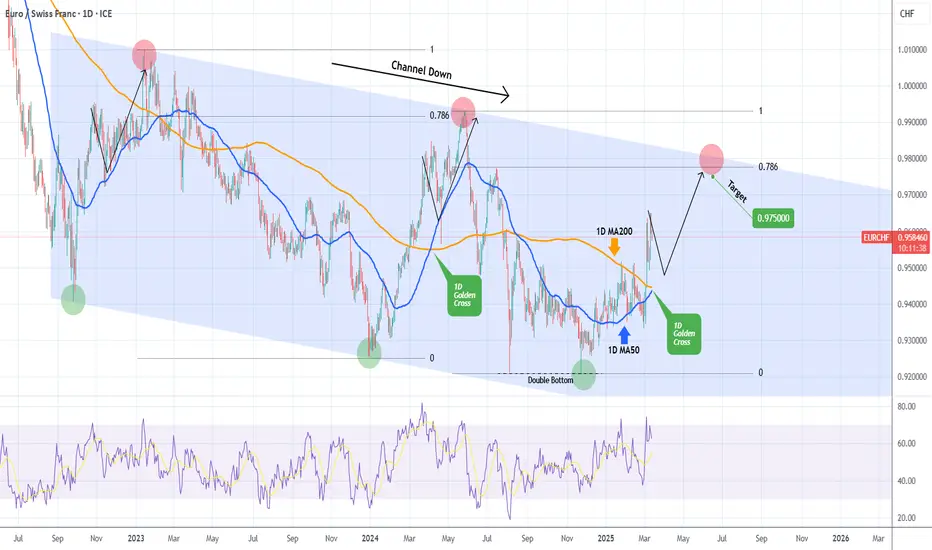
EURCHF 1D Golden Cross for one final push.The EURCHF pair has been trading within a 2.5-year Channel Down pattern and is currently on the latest Bullish Leg that is about to complete a 1D Golden Cross. The last Golden Cross was also during the previous Bullish Leg and caused an initial pull-back that was followed by the pricing of the Channel's Top on the 0.786 Fibonacci level.
As a result, be ready to buy on the next 1D MA50 (blue trend-line) contact and target 0.97500 (just below the 0.786 Fib).
-------------------------------------------------------------------------------
** Please LIKE 👍, FOLLOW ✅, SHARE 🙌 and COMMENT ✍ if you enjoy this idea! Also share your ideas and charts in the comments section below! This is best way to keep it relevant, support us, keep the content here free and allow the idea to reach as many people as possible. **
-------------------------------------------------------------------------------
💸💸💸💸💸💸
👇 👇 👇 👇 👇 👇
EUR/CHF "Euro vs Swissy" Forex Market Heist Plan🌟Hi! Hola! Ola! Bonjour! Hallo! Marhaba!🌟
Dear Money Makers & Robbers, 🤑 💰💸✈️
Based on 🔥Thief Trading style technical and fundamental analysis🔥, here is our master plan to heist the EUR/CHF "Euro vs Swissy" Forex market. Please adhere to the strategy I've outlined in the chart, which emphasizes long entry. Our aim is the high-risk Red Zone. Risky level, overbought market, consolidation, trend reversal, trap at the level where traders and bearish robbers are stronger. 🏆💸Book Profits Be wealthy and safe trade.💪🏆🎉
Entry 📈 : "The vault is wide open! Swipe the Bullish loot at any price - the heist is on!
however I advise to Place buy limit orders within a 15 or 30 minute timeframe most recent or swing, low or high level. I Highly recommended you to put alert in your chart.
Stop Loss 🛑:
Thief SL placed at the recent / nearest low level Using the 4H timeframe (2.04000) swing trade basis.
SL is based on your risk of the trade, lot size and how many multiple orders you have to take.
Target 🎯: 2.08000 (or) Escape Before the Target
🧲Scalpers, take note 👀 : only scalp on the Long side. If you have a lot of money, you can go straight away; if not, you can join swing traders and carry out the robbery plan. Use trailing SL to safeguard your money 💰.
📰🗞️Read the Fundamental, Macro, COT Report, Quantitative Analysis, Intermarket Analysis, Sentimental Outlook:
EUR/CHF "Euro vs Swissy" Forex Market market is currently experiencing a bullish trend,., driven by several key factors.
💸💲🧠 Fundamental Analysis
Interest Rates: The European Central Bank (ECB) is expected to maintain a hawkish stance, which could lead to a stronger euro and support the EUR/CHF.
Inflation: Eurozone inflation is expected to rise, which could lead to higher interest rates and support the EUR/CHF.
GDP Growth: Eurozone GDP growth is expected to accelerate, which could lead to a stronger euro and support the EUR/CHF.
Trade Balance: The Eurozone's trade surplus is expected to widen, which could support the EUR/CHF.
💸💲🧠 Macroeconomic Analysis
Unemployment Rates: Eurozone unemployment is expected to decline, which could lead to higher consumer spending and support the EUR/CHF.
Consumer Confidence: Eurozone consumer confidence is expected to rise, which could lead to higher consumer spending and support the EUR/CHF.
Manufacturing PMI: Eurozone manufacturing PMI is expected to rise, which could lead to higher economic growth and support the EUR/CHF.
💸💲🧠 Global Market Analysis
Risk Appetite: Global risk appetite is expected to rise, which could lead to a stronger euro and support the EUR/CHF.
Commodity Prices: Commodity prices are expected to rise, which could lead to higher inflation and support the EUR/CHF.
Global Economic Growth: Global economic growth is expected to accelerate, which could lead to a stronger euro and support the EUR/CHF.
💸💲🧠 COT Data Analysis
Non-Commercial Traders: Non-commercial traders are net long the EUR/CHF, indicating a bullish sentiment.
Commercial Traders: Commercial traders are net short the EUR/CHF, but the position is decreasing, indicating a potential bullish reversal.
Open Interest: Open interest in the EUR/CHF is increasing, indicating a rising bullish sentiment.
💸💲🧠 Intermarket Analysis
EUR/USD Correlation: The EUR/CHF has a strong positive correlation with the EUR/USD, indicating that the EUR/CHF tends to move in the same direction as the EUR/USD.
CHF/JPY Correlation: The EUR/CHF has a moderate negative correlation with the CHF/JPY, indicating that the EUR/CHF tends to move in the opposite direction of the CHF/JPY.
💸💲🧠 Quantitative Analysis
Moving Averages: The EUR/CHF has broken above its 200-day moving average, indicating a bullish trend.
Relative Strength Index (RSI): The RSI for the EUR/CHF has broken above 50, indicating a bullish momentum.
Bollinger Bands: The EUR/CHF has broken above the upper band of its Bollinger Bands, indicating a strong bullish momentum.
💸💲🧠 Market Sentiment Analysis
Sentiment Indicators: Sentiment indicators, such as the EUR/CHF sentiment index, are indicating a bullish sentiment.
Institutional Traders: Institutional traders, such as hedge funds and banks, are net long the EUR/CHF, indicating a bullish sentiment.
Retail Traders: Retail traders, such as individual investors, are also net long the EUR/CHF, indicating a bullish sentiment.
Positioning: Market participants are net long the EUR/CHF, indicating a bullish sentiment.
💸💲🧠Positioning and Trend Analysis
Short-Term Trend: The short-term trend for the EUR/CHF is bullish, with a potential target of 0.9800.
Medium-Term Trend: The medium-term trend for the EUR/CHF is bullish, with a potential target of 1.0000.
Long-Term Trend: The long-term trend for the EUR/CHF is bullish, with a potential target of 1.0500.
💸💲🧠 Overall Summary Outlook
Based on the analysis, the EUR/CHF is expected to trade with a bullish bias in the short, medium, and long term, with potential targets of 0.9800, 1.0000, and 1.0500 respectively.
💸💲🧠 Future Prediction
Based on the analysis, here are some potential future price levels for the EUR/CHF:
Bullish Targets:
Short-term: 0.9800
Medium-term: 1.0000
Long-term: 1.0500
Bearish Targets:
Short-term: 0.9400
Medium-term: 0.9200
Long-term: 0.9000
📌Keep in mind that these factors can change rapidly, and it's essential to stay up-to-date with market developments and adjust your analysis accordingly.
⚠️Trading Alert : News Releases and Position Management 📰 🗞️ 🚫🚏
As a reminder, news releases can have a significant impact on market prices and volatility. To minimize potential losses and protect your running positions,
we recommend the following:
Avoid taking new trades during news releases
Use trailing stop-loss orders to protect your running positions and lock in profits
💖Supporting our robbery plan 💥Hit the Boost Button💥 will enable us to effortlessly make and steal money 💰💵. Boost the strength of our robbery team. Every day in this market make money with ease by using the Thief Trading Style.🏆💪🤝❤️🎉🚀
I'll see you soon with another heist plan, so stay tuned 🤑🐱👤🤗🤩

EURCHF Last bearish sequence of the Channel Down.The EURCHF pair has been trading within a +2 year Channel Down pattern since the September 26 2022 Low and has lately found its price action ranging within the 1D MA200 (orange trend-line) and 1D MA50 (blue trend-line).
We are currently on the pattern's 2nd Bearish Leg and based on the 1D RSI's Higher Highs, we are in symmetrical terms on a High like November 17 2023. That was the price's last Lower High before the Bearish Leg bottomed on the 1.236 Fibonacci extension.
As a result, we remain bearish on EURCHF, targeting 0.91000 (Fib 1.236 ext).
-------------------------------------------------------------------------------
** Please LIKE 👍, FOLLOW ✅, SHARE 🙌 and COMMENT ✍ if you enjoy this idea! Also share your ideas and charts in the comments section below! This is best way to keep it relevant, support us, keep the content here free and allow the idea to reach as many people as possible. **
-------------------------------------------------------------------------------
💸💸💸💸💸💸
👇 👇 👇 👇 👇 👇

EUR/CHF "Swiss Franc Cross" Forex Market Bullish Heist Plan🌟Hi! Hola! Ola! Bonjour! Hallo!🌟
Dear Money Makers & Robbers, 🤑 💰
Based on 🔥Thief Trading style technical analysis🔥, here is our master plan to heist the EUR/CHF "Swiss Franc Cross" Forex market. Please adhere to the strategy I've outlined in the chart, which emphasizes long entry. Our aim is the high-risk Red Zone. Risky level, overbought market, consolidation, trend reversal, trap at the level where traders and bearish robbers are stronger. 👀 So Be Careful, wealthy and safe trade.💪🏆🎉
Entry 📈 : You can enter a Bull trade at any point,
however I advise placing Buy limit orders within a 15 or 30 minute timeframe. Entry from the most recent or closest low or high level should be in retest.
Stop Loss 🛑: Using the 4H period, the recent / nearest low or high level.
Goal 🎯: 0.94800
Scalpers, take note : only scalp on the Short side. If you have a lot of money, you can go straight away; if not, you can join swing traders and carry out the robbery plan. Use trailing SL to safeguard your money 💰.
Warning⚠️ : Our heist strategy is incompatible with Fundamental Analysis news 📰 🗞️. We'll wreck our plan by smashing the Stop Loss 🚫🚏. Avoid entering the market right after the news release.
Take advantage of the target and get away 🎯 Swing Traders Please reserve the half amount of money and watch for the next dynamic level or order block breakout. Once it is resolved, we can go on to the next new target in our heist plan.
💖Supporting our robbery plan will enable us to effortlessly make and steal money 💰💵 Tell your friends, Colleagues and family to follow, like, and share. Boost the strength of our robbery team. Every day in this market make money with ease by using the Thief Trading Style.🏆💪🤝❤️🎉🚀
I'll see you soon with another heist plan, so stay tuned 🫂

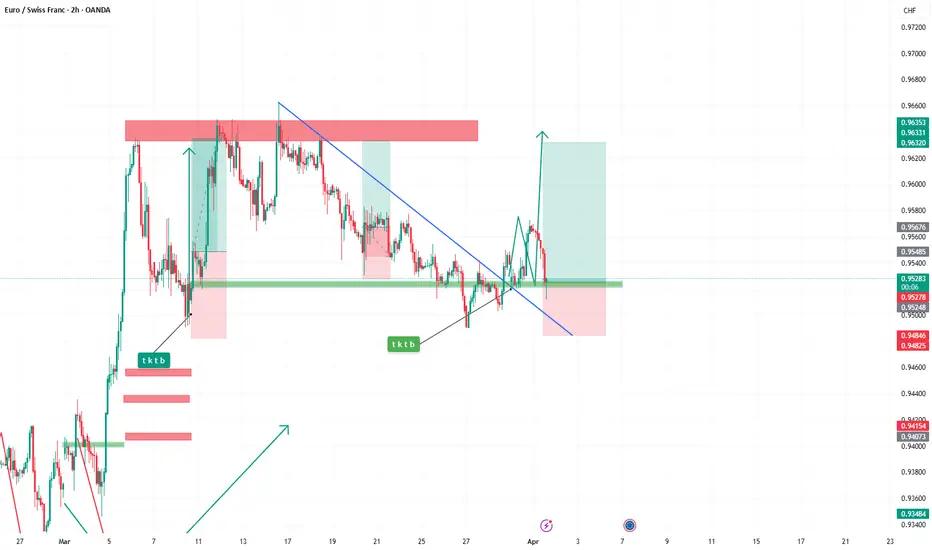
EURCHF Channel Down bottoming and giving a buy opportunity.The EURCHF pair has been trading within a Channel Down pattern on the 4H time-frame and is on its second Bearish Leg, pressured below the 4H MA50 (blue trend-line) since November 08.
Having hit the 0.236 Channel Fib, the current forming of Lower Lows is similar to the bottom pattern formed on October 01. Even the 4H RSI sequences between the two fractals are identical, both on a Double Bottom that was the signal to buy at that time.
Our Target is 0.93500, still below the 0.5 Fibonacci retracement (blue), which was broken during the October rebound.
-------------------------------------------------------------------------------
** Please LIKE 👍, FOLLOW ✅, SHARE 🙌 and COMMENT ✍ if you enjoy this idea! Also share your ideas and charts in the comments section below! This is best way to keep it relevant, support us, keep the content here free and allow the idea to reach as many people as possible. **
-------------------------------------------------------------------------------
💸💸💸💸💸💸
👇 👇 👇 👇 👇 👇

EURCHF Sell signal on the 1D MA200 rejection.The EURCHF pair gave us a great buy-low-sell-high double trading opportunity last time we gave a call on it (June 28, see chart below) as not only did it initially rise to the 1.236 Fibonacci extension, but straight after it dropped to the 0.618, reaching our 0.95500 Target:
The sell-off was in fact that aggressive that it reached as low as the bottom of the 2-year Channel Down, making a new Lower Low. The instant rise and rejection on the 1D MA200 (orange trend-line) confirms bearish extension bias similar to the June 22 2023 rejection.
We remain bearish on this pair, targeting 0.926500 and then after a new bounce, make a final sell for a new Lower Low.
-------------------------------------------------------------------------------
** Please LIKE 👍, FOLLOW ✅, SHARE 🙌 and COMMENT ✍ if you enjoy this idea! Also share your ideas and charts in the comments section below! This is best way to keep it relevant, support us, keep the content here free and allow the idea to reach as many people as possible. **
-------------------------------------------------------------------------------
💸💸💸💸💸💸
👇 👇 👇 👇 👇 👇

EURCHF Pump and dump in process.The EURCHF pair quickly delivered both of our Sell Targets that we set on our last analysis (May 22, see chart below) with a brutal sell-off that sharply broke even below the 0.618 Fibonacci retracement level:
Since last time we saw striking similarities between the Legs of this 2-year Channel Down, we have to make clear that the 0.618 Fib was where the March 15 2023 Low was formed and then rebounded to the 1.236 Fib only to get rejected again in the expansion process of the Bearish Leg.
As a result, we expect a short-term pump to that level, which we will short and target 0.95500 (middle level of the Channel Down as on May 22 2023).
-------------------------------------------------------------------------------
** Please LIKE 👍, FOLLOW ✅, SHARE 🙌 and COMMENT ✍ if you enjoy this idea! Also share your ideas and charts in the comments section below! This is best way to keep it relevant, support us, keep the content here free and allow the idea to reach as many people as possible. **
-------------------------------------------------------------------------------
💸💸💸💸💸💸
👇 👇 👇 👇 👇 👇

EURCHF Sell signal at the top of Channel Down.The EURCHF pair has been trading within a long-term Channel Down since the September 26 2022 Low. Today it hit the 1.5 Fibonacci extension level which on January 13 2023 formed the last Lower High at the top of the Channel Down.
As a result, this is the first long-term sell signal that has emerged since that date. We want to keep a safer, short-term perspective though and will only short towards the bottom of the current Channel Up (which is the Bullish Leg of the long-term Channel Down) and target 0.977500.
If then EURCHF closes a 1W candle below the Channel Up, we will re-sell and target Support 1 at 0.95700, similar to the March 13 2023 Low.
-------------------------------------------------------------------------------
** Please LIKE 👍, FOLLOW ✅, SHARE 🙌 and COMMENT ✍ if you enjoy this idea! Also share your ideas and charts in the comments section below! This is best way to keep it relevant, support us, keep the content here free and allow the idea to reach as many people as possible. **
-------------------------------------------------------------------------------
💸💸💸💸💸💸
👇 👇 👇 👇 👇 👇

EUR/CHF - Bearish Bat Harmonic Pattern Signals Bearish TrendThe EUR/CHF currency pair is currently exhibiting a Bearish Bat Harmonic Pattern (XABCD) on the 4-hour chart. Point D, identified as the Potential Reversal Zone (PRZ), aligns with a critical Key Resistance area and intersects with a significant 4-hour Trend Line. This confluence of factors strengthens our bearish bias and suggests a potential bullish trend reversal from Point D.
Bearish Bat Harmonic Pattern:
The Bearish Bat Harmonic Pattern is a reliable technical indicator that signals potential reversal points in the market. In this case, the pattern's completion at Point D indicates a high probability of a trend reversal from bearish to bullish. This is supported by the alignment of Point D with a Key Resistance area and a 4-hour Trend Line, providing additional validation for this setup.
Confluence Factors:
Key Resistance Area: Point D coincides with a significant resistance level that has historically impeded upward price movement.
4-hour Trend Line: The intersection of Point D with the 4-hour Trend Line further confirms the likelihood of a bearish-to-bullish reversal.
Trade Setup:
Entry Point: 0.98030
Stop Loss: 0.98400
Take Profit Levels
TP-1: 0.97655
TP-2: 0.97280
TP-3: 0.96900
Conclusion:
The confluence of the Bearish Bat Harmonic Pattern, Key Resistance area, and 4-hour Trend Line suggests a high probability of a bullish trend reversal from Point D. Traders should consider entering at 0.98030, with a stop loss at 0.98400, and aim for the specified take profit levels. This setup offers a strategic opportunity to capitalize on the anticipated market reversal.

EURCHF Technical Analysis and Trade IdeaThe EURCHF has reached a crucial support level. On the 4-hour chart, there has been a significant downward price swing resulting in an imbalance. This imbalance could serve as a target for price correction. Currently, we observe a higher low on the 4-hour timeframe, and I'm actively seeking a buying opportunity if the setup described in the video materializes. Should we witness a break, retest, and subsequent failure of the current range high, I will consider a buy position. However, if price fails to exhibit this bullish setup, we will abandon this idea. As always, please note that this information is for educational purposes only and should not be construed as financial advice.

EURCHF Wait for the perfect long-term Sell.The EURCHF pair is trading within a Channel Down pattern since the September 26 2023 Low. The current Bullish Leg is approaching the first 1D Golden Cross since February 06 2023, which was formed after the last Lower High on the 1.5 Fibonacci extension.
That (Fib 1.5 ext) is the ideal sell entry, which is currently at 0.9900 but the Risk/ Reward Ratio is good enough for a long-term sell even on the current levels. Our Target is the Channel's median at 0.95650, a little over the 0.618 Fibonacci level.
-------------------------------------------------------------------------------
** Please LIKE 👍, FOLLOW ✅, SHARE 🙌 and COMMENT ✍ if you enjoy this idea! Also share your ideas and charts in the comments section below! This is best way to keep it relevant, support us, keep the content here free and allow the idea to reach as many people as possible. **
-------------------------------------------------------------------------------
💸💸💸💸💸💸
👇 👇 👇 👇 👇 👇

EURCHF Rebound expected.The EURCHF pair stayed within the long-term Channel Down, got rejected on its top after our November 02 sell call (see chart below) and effectively hit our 0.941850 target:
Despite having more downside to drop it below Support 2, we expect a medium-term rebound as the 1D MACD is very close to posting a Bullish Cross, which within this Channel Down has been a buy signal that always sends the price back to at least the 0.5 Fibonacci retracement level. As a result we have an immediate target at 0.9545.
We can't overlook the potential for a Rectangle pattern emerging, with the price targeting Resistance 1, if it breaks above the 1D MA200 (orange trend-line).
-------------------------------------------------------------------------------
** Please LIKE 👍, FOLLOW ✅, SHARE 🙌 and COMMENT ✍ if you enjoy this idea! Also share your ideas and charts in the comments section below! This is best way to keep it relevant, support us, keep the content here free and allow the idea to reach as many people as possible. **
-------------------------------------------------------------------------------
💸💸💸💸💸💸
👇 👇 👇 👇 👇 👇

EURCHF Sell opportunity near the top of the Channel Down.More than a month ago (September 19) we gave a short-term buy signal on the EURCHF pair (see chart below) that quickly hit its target:
The price is now ranged within the 1D MA50 (blue trend-line) and the 1D MA100 (green trend-line) near not only the top of the 10-month Channel Down but also the Lower Highs trend-line from September 20 2021. The MACD is on a similar pattern as March 02. We are taking this as a sell signal, targeting Support 1 at 0.941850.
-------------------------------------------------------------------------------
** Please LIKE 👍, FOLLOW ✅, SHARE 🙌 and COMMENT ✍ if you enjoy this idea! Also share your ideas and charts in the comments section below! This is best way to keep it relevant, support us, keep the content here free and allow the idea to reach as many people as possible. **
-------------------------------------------------------------------------------
💸💸💸💸💸💸
👇 👇 👇 👇 👇 👇

EURCHF broke above the 1D MA50. Bullish signal.The EURCHF pair broke above the 1D MA50 (blue trend-line) and closed yesterday's 1D candle exactly on it. This is the first bullish signal we encounter since the June 12 1D MA50 break-out. The long-term pattern is a Channel Down but since July 27, the price has been holding the 0.952250 level (Support 1) as well as the 0.96510 (Resistance 1).
As a result, we have the opportunity for a short-term buy if a 1D candle closes above the 1D MA50. Our target will be Resistance 1 (0.965100), which is also where contact with the 1D MA100 (green trend-line) is expected to be made. The 1D MA100 has been the target during the previous Lower High formation (June 22 2023).
-------------------------------------------------------------------------------
** Please LIKE 👍, FOLLOW ✅, SHARE 🙌 and COMMENT ✍ if you enjoy this idea! Also share your ideas and charts in the comments section below! **
-------------------------------------------------------------------------------
💸💸💸💸💸💸
👇 👇 👇 👇 👇 👇

EURCHF Buy opportunity on a MACD Bullish Cross.The EURCHF pair eventually hit our 0.95555 bearish target as set by our sell signal in June (see chart below):
The price is now past a 1D MACD Bullish Cross and on the bullish wave of the 7 month Channel Down. We therefore go long again targeting Resistance 1 at 0.96510 on the short-term and if a 1D candle closes above it, we will extend it towards the 1D MA100 (green trend-line) at 0.97100.
-------------------------------------------------------------------------------
** Please LIKE 👍, FOLLOW ✅, SHARE 🙌 and COMMENT ✍ if you enjoy this idea! Also share your ideas and charts in the comments section below! **
-------------------------------------------------------------------------------
💸💸💸💸💸💸
👇 👇 👇 👇 👇 👇

EURCHF Breakout TradeEURCHF moving in parallel channel waiting for breakout to trade.
Manage your risk according to account size!

EURCHF Bearish signal targeting 0.9555.The EURCHF pair is trading within a Channel Up since the March 23 High, below both the 1D MA50 (blue trend-line) and 1D MA200 (orange trend-line), which formed a Death Cross a few days ago, the first such bearish pattern since August 02 2021.
The emerging MACD Bearish Cross will be the final confirmation signal ahead of the next downside target, as every Bearish Cross delivered considerable downside after its formation. You can set an immediate target at 0.964500 (Support 1). Our medium-term target is Support 2 at 0.955500.
-------------------------------------------------------------------------------
** Please LIKE 👍, FOLLOW ✅, SHARE 🙌 and COMMENT ✍ if you enjoy this idea! Also share your ideas and charts in the comments section below! **
-------------------------------------------------------------------------------
💸💸💸💸💸💸
👇 👇 👇 👇 👇 👇

EURCHF Buy opportunity a little lower.The EURCHF pair is now trading below the 1D MA200 (orange trend-line) for the 5th straight day. This is a downtrend that started after the March 23 High. We are looking to buy lower near Support 1 (0.972500) assuming the 1D candle closes above it and target the September 2021 Lower Highs trend-line at 0.99000.
If it closes a 1D candle under Support 1, we will book the loss and take a sell position instead targeting Support 2 at 0.966500.
-------------------------------------------------------------------------------
** Please LIKE 👍, FOLLOW ✅, SHARE 🙌 and COMMENT ✍ if you enjoy this idea! Also share your ideas and charts in the comments section below! **
-------------------------------------------------------------------------------
💸💸💸💸💸💸
👇 👇 👇 👇 👇 👇

EURCHF News H4Here is my view for EURCHF on H4. The price could go bearish, you can put a pending order on the Order block or find an entry on LTF within OB Zone. Trade Safe!

EURCHF top-down analysis Hello traders, this is a complete multiple timeframe analysis of this pair. We see could find significant trading opportunities as per analysis upon price action confirmation we may take this trade. Smash the like button if you find value in this analysis and drop a comment if you have any questions or let me know which pair to cover in my next analysis.
