Ready to Raid the Chunnel? EUR/GBP Bullish Strategy Unveiled!🔐💸"The Chunnel Heist: EUR/GBP Bank Job with Thief Trading Style"💸🔐
Master Plan for Smart Money Robbers, Scalpers, and Swing Traders – Chart Ready Strategy to Boost Your TradingView Clout
🌍 Greetings, Global Hustlers & Strategic Traders!
Hola! Ola! Bonjour! Hallo! Marhaba! Ni Hao! Ciao! 👋🌟
Welcome to Thief Trading Style, where we treat the market like a high-stakes heist and every pip is precious loot! 🏦💰
This time, the target is the EUR/GBP Forex Vault – nicknamed "The Chunnel". It’s time to outsmart the system and execute a calculated plan that balances technical setups with a thief’s precision. 🐱👤🔥
🧠 Heist Blueprint: EUR/GBP Bullish Setup
🔍 Concept:
We're spotting a bullish bias with underlying momentum for a breakout heist.
This move is not for the faint-hearted – police traps (resistance zones) and bearish defenders are guarding the top, but our tools (TA + FA) suggest a strong breakout is brewing. ⚠️📊
🚀 Thief Strategy at a Glance:
🟢 Entry (Stealth Mode)
💥 "The vault is wide open – grab the bullish loot!"
Initiate BUY positions on pullbacks, using a layering/DCA style entry system.
📅 Recommended on 15m or 30m charts for precision.
🎯 Key Entry Zone: Recent swing lows/highs – the quieter, unguarded door into the vault.
🛑 Stop Loss (Silent Exit Strategy)
Set SL near the most recent 1D timeframe wick low – smart risk management is key.
Adjust size based on your risk tolerance, lot sizes, and how deep you’ve stacked the entries.
🏁 Target (Escape Route)
🎯 Main Target: 0.88000
But remember – sometimes it’s safer to exit early if things get hot. Use trailing SLs to secure your loot and dodge the heat. 🔥🚓
💸 Scalper Advisory – Quick Snatch & Run
Scalpers should only ride the bullish momentum.
If your wallet's heavy, jump in early. If not, trail the swing traders and plan your entry like a pro.
🛡 Use tight trailing SLs to keep your gains in the bag.
📈 Why the Chunnel Heist Now?
The market is shifting:
🔹 Overbought conditions
🔹 Signs of trend reversal
🔹 Bullish divergence + liquidity grab setups
🔹 Positioning based on COT reports, sentiment analysis, macroeconomic shifts, and intermarket flow
👉 Full FA/TA/COT breakdown liinkedd in the Klick 🔗🔗
📢 Heads-Up: News Alert 🚨
📰 Major news events ahead – stay sharp.
❌ Avoid fresh entries during high-impact announcements.
✅ Use trailing SLs to lock profits and reduce emotional exposure.
❤️ Support the Heist, Boost the Team
🔥 Smash the "Boost" button if you're down with the Thief Trading Style
– it powers our next robbery and keeps the strategy alive!
Each boost strengthens the team and spreads the loot. Let’s out-trade the market, not just survive it. 🚀💰
⚠️ Disclaimer (The Clean Getaway)
📌 This is an educational, entertainment-based strategic overview – not financial advice.
📌 Always do your own due diligence and trade based on your personal risk profile.
📌 Markets shift quickly – adapt, adjust, and don’t marry your trades.
💬 Leave a comment if you’re riding this plan or if you’ve got your eyes on the next target.
🎯 Follow for more Thief Trading Heists – the next plan drops soon!
Stay stealthy, stay profitable. See you at the vault! 🏦🐱👤💸
Eurgbp!

EURGBP Perfect Channel Up giving one more buy opportunity.Last time we looked at the EURGBP pair (May 30, see chart below) we gave the most timely buy signal right at the bottom (Higher Lows trend-line) of the Bullish Megaphone, and the price is only a few candles away from the 0.87400 Target:
If we look at the price action from a 4H perspective we can see that it is a Channel Up that has been driving the pair upwards since the May 28 bottom and today's rebound is taking place after a direct hit on the 4H MA50 (blue trend-line).
This is the start of the new Bullish Leg. Since the previous two have increased by +1.90%, this rally has the potential to even exceed our 0.87400 Target marginally. Still, this is a perfect bullish set-up.
-------------------------------------------------------------------------------
** Please LIKE 👍, FOLLOW ✅, SHARE 🙌 and COMMENT ✍ if you enjoy this idea! Also share your ideas and charts in the comments section below! This is best way to keep it relevant, support us, keep the content here free and allow the idea to reach as many people as possible. **
-------------------------------------------------------------------------------
Disclosure: I am part of Trade Nation's Influencer program and receive a monthly fee for using their TradingView charts in my analysis.
💸💸💸💸💸💸
👇 👇 👇 👇 👇 👇

EURGBP SHORT DAILY FORECAST Q3 D11 W28 Y25EURGBP SHORT DAILY FORECAST Q3 D11 W28 Y25
It’s Fun Coupon Friday! 💸🔥
Professional Risk Managers👋
Welcome back to another FRGNT chart update📈
Diving into some Forex setups using predominantly higher time frame order blocks alongside confirmation breaks of structure.
Let’s see what price action is telling us today! 👀
💡Here are some trade confluences📝
✅Daily Order block identified
✅4H Order Block identified
✅1H Order Block identified
🔑 Remember, to participate in trading comes always with a degree of risk, therefore as professional risk managers it remains vital that we stick to our risk management plan as well as our trading strategies.
📈The rest, we leave to the balance of probabilities.
💡Fail to plan. Plan to fail.
🏆It has always been that simple.
❤️Good luck with your trading journey, I shall see you at the very top.
🎯Trade consistent, FRGNT X

Bullish bounce off overlap support?EUR/GBP is falling towards the pivot, which has been identified as an overlap support and could bounce to the 1st resistance, which acts as a pullback resistance.
Pivot: 0.8569
1st Support: 0.8538
1st Resistance: 0.8640
Risk Warning:
Trading Forex and CFDs carries a high level of risk to your capital and you should only trade with money you can afford to lose. Trading Forex and CFDs may not be suitable for all investors, so please ensure that you fully understand the risks involved and seek independent advice if necessary.
Disclaimer:
The above opinions given constitute general market commentary, and do not constitute the opinion or advice of IC Markets or any form of personal or investment advice.
Any opinions, news, research, analyses, prices, other information, or links to third-party sites contained on this website are provided on an "as-is" basis, are intended only to be informative, is not an advice nor a recommendation, nor research, or a record of our trading prices, or an offer of, or solicitation for a transaction in any financial instrument and thus should not be treated as such. The information provided does not involve any specific investment objectives, financial situation and needs of any specific person who may receive it. Please be aware, that past performance is not a reliable indicator of future performance and/or results. Past Performance or Forward-looking scenarios based upon the reasonable beliefs of the third-party provider are not a guarantee of future performance. Actual results may differ materially from those anticipated in forward-looking or past performance statements. IC Markets makes no representation or warranty and assumes no liability as to the accuracy or completeness of the information provided, nor any loss arising from any investment based on a recommendation, forecast or any information supplied by any third-party.

EURGBP: Is This The End Of The Bulls? The GBP/USD pair has exhibited a consistent bullish trend, driven by a remarkable price momentum that is unprecedented in recent history. However, we anticipate a potential bearish reversal, as the market is witnessing a confluence of bearish indicators and increasing volume. Historically, the British pound has held a dominant position in this market, and long-term bears are likely to gain control.
Therefore, it is crucial to closely monitor the incoming market volume and, most importantly, the prevailing market sentiment. Your continued support throughout this journey is greatly appreciated. If you wish to encourage us, kindly like and comment on our ideas.
Team Setupsfx_
❤️❤️🚀🚀

EURGBP Uptrend continuation breakout?The EURGBP remains in a bullish trend, with recent price action showing signs of a corrective pullback within the broader uptrend.
Support Zone: 0.8600 – a key level from previous consolidation. Price is currently testing or approaching this level.
A bullish rebound from 0.8600 would confirm ongoing upside momentum, with potential targets at:
0.8670 – initial resistance
0.8700 – psychological and structural level
0.8720 – extended resistance on the longer-term chart
Bearish Scenario:
A confirmed break and daily close below 0.8600 would weaken the bullish outlook and suggest deeper downside risk toward:
0.8590 – minor support
0.8570 – stronger support and potential demand zone
Outlook:
Bullish bias remains intact while the EURGBP holds above 0.8600. A sustained break below this level could shift momentum to the downside in the short term.
This communication is for informational purposes only and should not be viewed as any form of recommendation as to a particular course of action or as investment advice. It is not intended as an offer or solicitation for the purchase or sale of any financial instrument or as an official confirmation of any transaction. Opinions, estimates and assumptions expressed herein are made as of the date of this communication and are subject to change without notice. This communication has been prepared based upon information, including market prices, data and other information, believed to be reliable; however, Trade Nation does not warrant its completeness or accuracy. All market prices and market data contained in or attached to this communication are indicative and subject to change without notice.

EURGBP SHORT DAILY FORECAST Q3 D10 W28 Y25EURGBP SHORT DAILY FORECAST Q3 D10 W28 Y25
Professional Risk Managers👋
Welcome back to another FRGNT chart update📈
Diving into some Forex setups using predominantly higher time frame order blocks alongside confirmation breaks of structure.
Let’s see what price action is telling us today! 👀
💡Here are some trade confluences📝
✅Daily Order block identified
✅4H Order Block identified
✅1H Order Block identified
🔑 Remember, to participate in trading comes always with a degree of risk, therefore as professional risk managers it remains vital that we stick to our risk management plan as well as our trading strategies.
📈The rest, we leave to the balance of probabilities.
💡Fail to plan. Plan to fail.
🏆It has always been that simple.
❤️Good luck with your trading journey, I shall see you at the very top.
🎯Trade consistent, FRGNT X

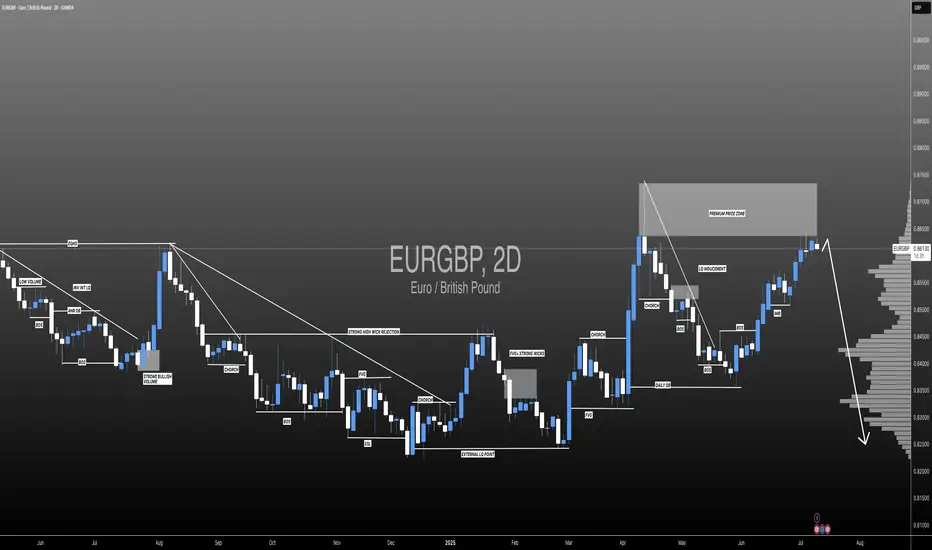
EURGBP 1D: This isn't a breakoutEURGBP 1D: This isn't a breakout — it's a deep reaction before the real move
EURGBP continues to form a textbook bullish megaphone, a structure designed not to trend, but to destabilize — forcing liquidity on both sides while smart money quietly positions. Two touches above (January and April), two below (February and May) — clean geometry, expanding volatility. Price is now reacting from the lower boundary, but we are still inside the pattern — and that matters.
The reaction zone sits right on the 0.786 Fibonacci level, near 0.8350, precisely where price meets the lower trendline and the 200-day moving average. The bounce didn’t come from noise — it came from confluence. Candle structure is clean, volume slightly expands — not panic, but controlled demand. As long as price holds above the MA200, the scenario remains intact. A break below kills the setup — but that hasn’t happened.
We’re not in breakout mode — yet. But price action is shifting. Pullbacks are weak, candles are full-bodied, and sellers don’t press. Momentum indicators confirm early recovery, but the real signal lies in how price holds its ground at key structure without struggle. Buyers aren’t running — they’re holding position.
If the market pushes above 0.8430–0.8480 and confirms — acceleration begins. Until then, we remain in balance. Every candle is a stress test — and so far, the structure is holding strong. If smart money controls 0.8350, the breakout won’t just be bullish — it’ll be aggressive.

EURGBP SHORT DAILY FORECAST Q3 D8 W28 Y25EURGBP SHORT DAILY FORECAST Q3 D8 W28 Y25
Professional Risk Managers👋
Welcome back to another FRGNT chart update📈
Diving into some Forex setups using predominantly higher time frame order blocks alongside confirmation breaks of structure.
Let’s see what price action is telling us today! 👀
💡Here are some trade confluences📝
✅Daily Order block identified
✅4H Order Block identified
✅1H Order Block identified
🔑 Remember, to participate in trading comes always with a degree of risk, therefore as professional risk managers it remains vital that we stick to our risk management plan as well as our trading strategies.
📈The rest, we leave to the balance of probabilities.
💡Fail to plan. Plan to fail.
🏆It has always been that simple.
❤️Good luck with your trading journey, I shall see you at the very top.
🎯Trade consistent, FRGNT X

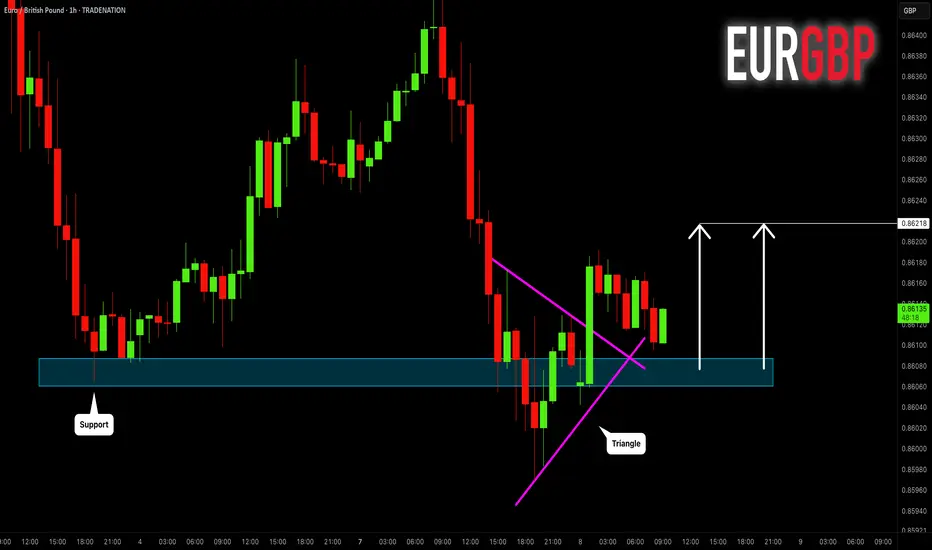
EURGBP: Bullish Move After False Breakout 🇪🇺🇬🇧
EURGBP will likely go up from a key daily/intraday support,
following a bullish breakout of a resistance line
of a bullish triangle on an hourly time frame.
The price may go up to 0.86218 level then.
❤️Please, support my work with like, thank you!❤️
I am part of Trade Nation's Influencer program and receive a monthly fee for using their TradingView charts in my analysis.
Bulls Could "Wedge" Their Way Into Higher Prices On EGOANDA:EURGBP has made some impressive moves up since the Low from May 29th and Price just fell short of the Highs of April 11th before falling into a very familiar Bullish Pattern, the Falling Wedge!
The Falling Wedge is typically a Bullish Pattern where we expect Price to give us a Bullish Break of the Falling Resistance and Successful Retest of the Break before Price heads Higher!
Wedge Patterns can play both Reversal and Continuation Patterns dependent upon the location they form and surrounding Major Support/Resistance or Highs/Lows. In this case, we will be looking for a Continuation with Price being in an Uptrend before pausing slightly for a Consolidation Phase to form the "Triangle" of the Pattern.
*It is important to note that both the Falling Resistance and Falling Support have only been tested twice where three tests of both Trendlines should point to a strong equilibrium from both Bears and Bulls, validating the legs of the Triangle and strengthening the Consolidation Bias. ( So we could see Price test the Falling Resistance one last time before falling down to the Falling Support for a 3rd test! )
Lastly, when it comes to a Wedge Pattern, we should suspect that once Price makes a 3rd Test of the Falling Support and Retraces to the 50% Fibonacci Level @ .85887, this will signal the End of the Consolidation Phase!
- And this will be the time to enter!
**Once the Pattern is Confirmed and Breakout is Validated, based on the "Flagpole" or Rally prior to Price falling into the Consolidation Phase we can anticipate Price to potentially rise to the most recent High on April 11th of .87374 and give the next Previous High on November 16th 2023 of .87657 a try!
Fundamentally, news is light this week for both currencies in the pair with GDP m/m releasing for GBP on Friday, July 11th with a Forecast of .1%, a .4% increase from June's -.3%
Also, CPI y/y for GBP will be released the following week on Wednesday, July 16th.

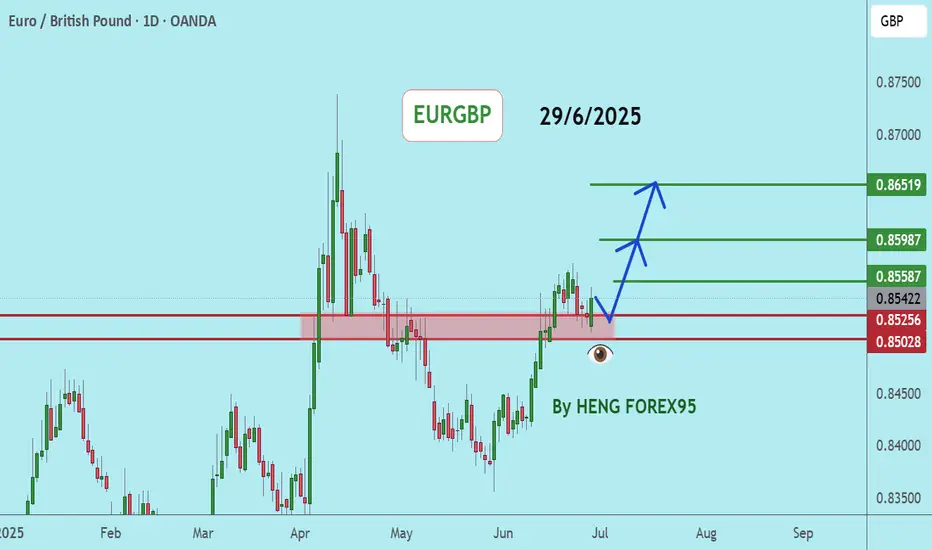
EURGBP uptrend support retest at 0.8600The EURGBP remains in a bullish trend, with recent price action showing signs of a corrective pullback within the broader uptrend.
Support Zone: 0.8600 – a key level from previous consolidation. Price is currently testing or approaching this level.
A bullish rebound from 0.8600 would confirm ongoing upside momentum, with potential targets at:
0.8670 – initial resistance
0.8700 – psychological and structural level
0.8720 – extended resistance on the longer-term chart
Bearish Scenario:
A confirmed break and daily close below 0.8600 would weaken the bullish outlook and suggest deeper downside risk toward:
0.8590 – minor support
0.8570 – stronger support and potential demand zone
Outlook:
Bullish bias remains intact while the EURGBP holds above 0.8600. A sustained break below this level could shift momentum to the downside in the short term.
This communication is for informational purposes only and should not be viewed as any form of recommendation as to a particular course of action or as investment advice. It is not intended as an offer or solicitation for the purchase or sale of any financial instrument or as an official confirmation of any transaction. Opinions, estimates and assumptions expressed herein are made as of the date of this communication and are subject to change without notice. This communication has been prepared based upon information, including market prices, data and other information, believed to be reliable; however, Trade Nation does not warrant its completeness or accuracy. All market prices and market data contained in or attached to this communication are indicative and subject to change without notice.
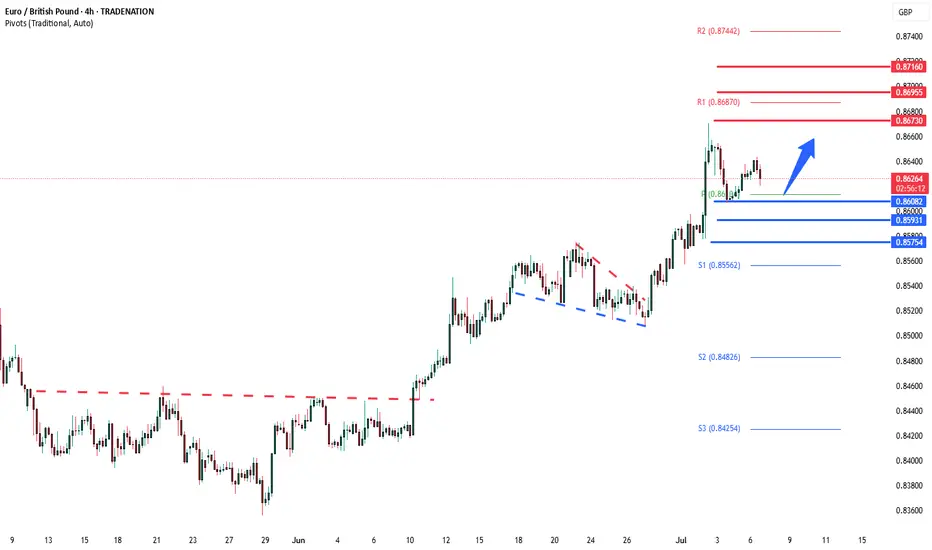
Market Analysis: EUR/GBP Accelerates HigherMarket Analysis: EUR/GBP Accelerates Higher
EUR/GBP is rising and might climb above the 0.8670 resistance.
Important Takeaways for EUR/GBP Analysis Today
- EUR/GBP is gaining pace and trading above the 0.8600 zone.
- There was a break above a contracting triangle with resistance at 0.8630 on the hourly chart at FXOpen.
EUR/GBP Technical Analysis
On the hourly chart of EUR/GBP at FXOpen, the pair started a decent increase from the 0.8500 zone. The Euro traded above the 0.8580 resistance level to enter a positive zone against the British Pound.
The pair settled above the 50-hour simple moving average and 0.8620. It traded as high as 0.8670 before a downside correction. There was a move below the 23.6% Fib retracement level of the upward move from the 0.8507 swing low to the 0.8670 high.
However, the pair is stable above the 0.8600 support zone. The next major support is near the 50% Fib retracement level of the upward move from the 0.8507 swing low to the 0.8670 high at 0.8590.
A downside break below 0.8590 might call for more downsides. In the stated case, the pair could drop toward the 0.8545 support level. Any more losses might call for an extended drop toward the 0.8505 pivot zone.
The EUR/GBP chart suggests that the pair is facing resistance near the 0.8635 zone. A close above the 0.8635 level might accelerate gains. In the stated case, the bulls may perhaps aim for a test of 0.8670. Any more gains might send the pair toward the 0.8700 level.
This article represents the opinion of the Companies operating under the FXOpen brand only. It is not to be construed as an offer, solicitation, or recommendation with respect to products and services provided by the Companies operating under the FXOpen brand, nor is it to be considered financial advice.

EURGBP LONG Market still in strong bullish momentum and a third touch on bullish trendline. Price printed a strong bullish confirmation. Expecting price to reach at least 0.86699 resistance level.

EUR-GBP Will Grow! Buy!
Hello,Traders!
EUR-GBP keeps trading in
A strong uptrend and the
Pair made a retest and a
Rebound from the horizontal
Support level around 0.8621
So we are bullish biased and
We will be expecting a
Further bullish move up
Buy!
Comment and subscribe to help us grow!
Check out other forecasts below too!
Disclosure: I am part of Trade Nation's Influencer program and receive a monthly fee for using their TradingView charts in my analysis.

EUR/GBP BEST PLACE TO SELL FROM|SHORT
Hello, Friends!
The BB upper band is nearby so EUR-GBP is in the overbought territory. Thus, despite the uptrend on the 1W timeframe I think that we will see a bearish reaction from the resistance line above and a move down towards the target at around 0.856.
Disclosure: I am part of Trade Nation's Influencer program and receive a monthly fee for using their TradingView charts in my analysis.
✅LIKE AND COMMENT MY IDEAS✅

EURGBP 8H Analysis : Breakdown + Smart Money Structure + Target🧠 Phase 1: Arc Formation – Accumulation by Smart Money
The arc (May to June) reflects an accumulation base where price made higher lows with consolidative wicks and slow momentum, ideal conditions for institutional orders to build long positions.
Liquidity is swept below swing lows, stopping out early longs — this is classic smart money accumulation.
Volume compression during the arc followed by expansion on breakout confirms smart interest.
🔑 Psychology: Retail was likely selling here due to lower highs, while smart money was accumulating quietly at the bottom of the arc.
🚀 Phase 2: Breakout & Rally to Previous Highs
Price cleanly breaks above the arc’s neckline and previous resistance (labeled as Previous Target).
Momentum accelerates rapidly toward the reversal zone, likely due to stop hunts and FOMO buyers entering after confirmation.
Structure shifts bullish, creating strong impulsive candles — but these are often final exit points for smart money.
📌 Key Sign: Breakout aligns perfectly with market inefficiencies being filled, often a sign of a short-term top formation brewing.
🔄 Phase 3 : Reversal Zone – Distribution Phase
Inside the Reversal Zone (0.8650–0.8680), price shows exhaustion with multiple upper wicks and slowing bullish momentum.
Distribution signs: choppy movement, lower highs, and eventual breakdown.
Retail is often caught entering longs here on confirmation, while institutions offload their positions.
🧠 MMC Insight: This is where Mind Market Curve transitions from bullish impulse to corrective leg down — phase of deception.
📉 Phase 4: Structure Breakdown & Bearish Market Behavior
Price breaks through short-term higher low structure — confirmation of bearish intent.
The formation of lower highs and lower lows marks the beginning of a bearish trend shift.
Market is now targeting Major Support (0.8500–0.8520 zone), which is currently being tested.
🧭 If price breaks below 0.8500 with volume and aggression, next level is likely near 0.8430–0.8450.
⚖️ Current Price Location: Major Support Test
We’re at a critical decision point.
If support holds → expect a bounce to 0.8600–0.8620.
If it breaks → expect continuation to next liquidity pool below 0.8450.
This zone is where buyers and sellers will battle. Wait for:
Bullish confirmation (reversal pattern / engulfing candle) to go long.
Bearish breakout (close below zone + retest) to go short.
🔁 Summary of Scenarios
Scenario Conditions Target
✅ Bullish Bounce Rejection at support with bullish engulfing/pin bar 0.8600–0.8620
❌ Bearish Break Close below 0.8500 + retest as resistance 0.8430–0.8450
🔖 Educational Takeaway
This chart teaches how to:
Identify accumulation via arc and understand smart money behavior.
Recognize false confirmation zones (where retail enters late).
Understand structure shift as a trend reversal signal.
Execute trades based on reaction zones, not emotions.
If you follow MMC (Mind Market Curve), this is a textbook transition from:
Accumulation →
Expansion →
Distribution →
Breakdown

EURGBP - Expecting Bullish Continuation In The Short TermH4 - We have a clean bullish trend with the price creating a series of higher highs, higher lows structure.
This strong bullish momentum is followed by a pullback.
No opposite signs.
Until the two Fibonacci support zones hold I expect the price to move higher further.
If you enjoy this idea, don’t forget to LIKE 👍, FOLLOW ✅, SHARE 🙌, and COMMENT ✍! Drop your thoughts and charts below to keep the discussion going. Your support helps keep this content free and reach more people! 🚀
--------------------------------------------------------------------------------------------------------------------

EURGBP corrective pullback support at 0.8600The EURGBP remains in a bullish trend, with recent price action showing signs of a corrective pullback within the broader uptrend.
Support Zone: 0.8600 – a key level from previous consolidation. Price is currently testing or approaching this level.
A bullish rebound from 0.8600 would confirm ongoing upside momentum, with potential targets at:
0.8670 – initial resistance
0.8700 – psychological and structural level
0.8720 – extended resistance on the longer-term chart
Bearish Scenario:
A confirmed break and daily close below 0.8600 would weaken the bullish outlook and suggest deeper downside risk toward:
0.8590 – minor support
0.8570 – stronger support and potential demand zone
Outlook:
Bullish bias remains intact while the EURGBP holds above 0.8600. A sustained break below this level could shift momentum to the downside in the short term.
This communication is for informational purposes only and should not be viewed as any form of recommendation as to a particular course of action or as investment advice. It is not intended as an offer or solicitation for the purchase or sale of any financial instrument or as an official confirmation of any transaction. Opinions, estimates and assumptions expressed herein are made as of the date of this communication and are subject to change without notice. This communication has been prepared based upon information, including market prices, data and other information, believed to be reliable; however, Trade Nation does not warrant its completeness or accuracy. All market prices and market data contained in or attached to this communication are indicative and subject to change without notice.

EURGBPEURGBP If the price can stay above 0.85028, it is likely to increase.
Consider buying the red zone.
🔥Trading futures, forex, CFDs and stocks carries a risk of loss.
Please consider carefully whether such trading is suitable for you.
>>GooD Luck 😊
❤️ Like and subscribe to never miss a new idea!
EUR_GBP BULLISH BIAS|LONG|
✅EUR_GBP broke the key
Structure level of 0.8620
While trading in an local uptrend
Which makes me bullish
And I think that after the retest
Of the broken level is complete
A rebound and bullish continuation will follow
LONG🚀
✅Like and subscribe to never miss a new idea!✅
Disclosure: I am part of Trade Nation's Influencer program and receive a monthly fee for using their TradingView charts in my analysis.

EURGBP Growth Ahead!
HI,Traders !
#EURGBP is trading along the
Rising support and is already
Making a bullish rebound so
AsTo the strong uptrend we
Will be expecting a further
Bullish move up on pair !
Comment and subscribe to help us grow !
