EURGBP: Long Signal with Entry/SL/TP
EURGBP
- Classic bullish pattern
- Our team expects retracement
SUGGESTED TRADE:
Swing Trade
Buy EURGBP
Entry - 0.8353
Stop - 0.8326
Take - 0.8395
Our Risk - 1%
Start protection of your profits from lower levels
Disclosure: I am part of Trade Nation's Influencer program and receive a monthly fee for using their TradingView charts in my analysis.
❤️ Please, support our work with like & comment! ❤️
EURGBP

EURGBP - Follow The Bears!Hello TradingView Family / Fellow Traders. This is Richard, also known as theSignalyst.
📈EURGBP has been bearish trading within the falling channel in blue.
Currently, EURGBP is approaching the upper bound of the channel.
Moreover, it is retesting the upper bound of its range marked in blue.
🏹 Thus, the highlighted red circle is a strong area to look for sell setups as it is the intersection of the range and upper blue trendline.
📚 As per my trading style:
As #EURGBP is around the red circle zone, I will be looking for bearish reversal setups (like a double top pattern, trendline break , and so on...)
📚 Always follow your trading plan regarding entry, risk management, and trade management.
Good luck!
All Strategies Are Good; If Managed Properly!
~Rich
Disclosure: I am part of Trade Nation's Influencer program and receive a monthly fee for using their TradingView charts in my analysis.

Bullish bounce?EUR/GBP is reacting off the pivot and could bounce to the 1st resistance.
Pivot: 0.8337
1st Support: 0.8310
1st Resistance: 0.8377
Risk Warning:
Trading Forex and CFDs carries a high level of risk to your capital and you should only trade with money you can afford to lose. Trading Forex and CFDs may not be suitable for all investors, so please ensure that you fully understand the risks involved and seek independent advice if necessary.
Disclaimer:
The above opinions given constitute general market commentary, and do not constitute the opinion or advice of IC Markets or any form of personal or investment advice.
Any opinions, news, research, analyses, prices, other information, or links to third-party sites contained on this website are provided on an "as-is" basis, are intended only to be informative, is not an advice nor a recommendation, nor research, or a record of our trading prices, or an offer of, or solicitation for a transaction in any financial instrument and thus should not be treated as such. The information provided does not involve any specific investment objectives, financial situation and needs of any specific person who may receive it. Please be aware, that past performance is not a reliable indicator of future performance and/or results. Past Performance or Forward-looking scenarios based upon the reasonable beliefs of the third-party provider are not a guarantee of future performance. Actual results may differ materially from those anticipated in forward-looking or past performance statements. IC Markets makes no representation or warranty and assumes no liability as to the accuracy or completeness of the information provided, nor any loss arising from any investment based on a recommendation, forecast or any information supplied by any third-party.

EURGBP Set To Fall! SELL!
My dear friends,
EURGBP looks like it will make a good move, and here are the details:
The market is trading on 0.8359 pivot level.
Bias - Bearish
Technical Indicators: Supper Trend generates a clear short signal while Pivot Point HL is currently determining the overall Bearish trend of the market.
Goal - 0.8344
About Used Indicators:
Pivot points are a great way to identify areas of support and resistance, but they work best when combined with other kinds of technical analysis
Disclosure: I am part of Trade Nation's Influencer program and receive a monthly fee for using their TradingView charts in my analysis.
———————————
WISH YOU ALL LUCK

EURGBP INTRADAY corrective pullback capped at 0.8385The EUR/GBP pair continues to exhibit bearish sentiment, reinforced by the prevailing downtrend. The key intraday resistance level is at 0.8385, marking the current swing high.
Bearish Scenario:
An oversold rally from current levels, followed by a bearish rejection at 0.8385, would likely target downside support at 0.8340. A break below this level would open the door for further declines toward 0.8307 and 0.8260 in the longer timeframe.
Bullish Scenario:
Alternatively, a confirmed breakout above the 0.8385 resistance, accompanied by a daily close above this level, would invalidate the bearish outlook. This would pave the way for further rallies, with the next resistance levels at 0.8420 and 0.8460.
Conclusion:
The prevailing sentiment remains bearish as long as 0.8385 holds as resistance. Traders should watch for rejection at this level to confirm downside momentum. Conversely, a decisive breakout above 0.8420 would signal a potential shift to a bullish bias, targeting higher resistance levels.
This communication is for informational purposes only and should not be viewed as any form of recommendation as to a particular course of action or as investment advice. It is not intended as an offer or solicitation for the purchase or sale of any financial instrument or as an official confirmation of any transaction. Opinions, estimates and assumptions expressed herein are made as of the date of this communication and are subject to change without notice. This communication has been prepared based upon information, including market prices, data and other information, believed to be reliable; however, Trade Nation does not warrant its completeness or accuracy. All market prices and market data contained in or attached to this communication are indicative and subject to change without notice.

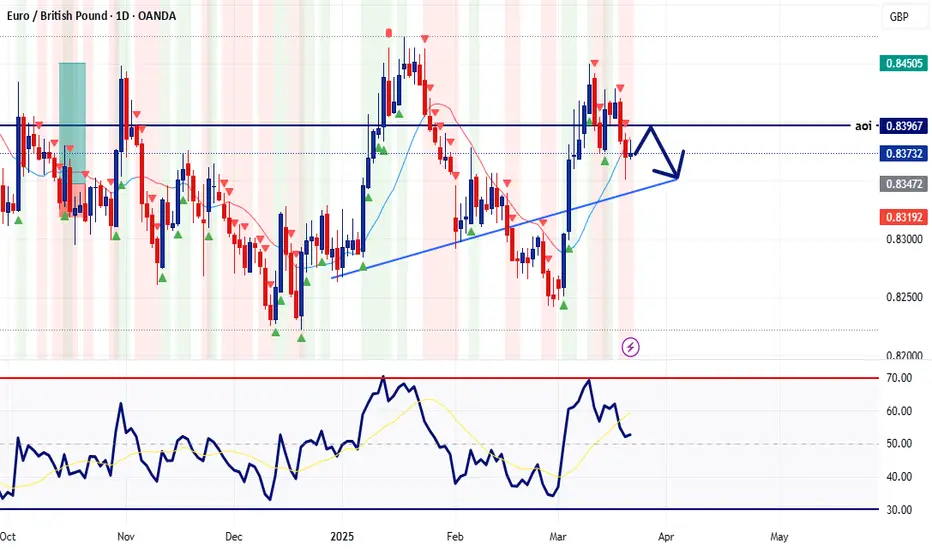
Eurgbp 27 Mar bullish idea updatePrice hit bottom again and we reloaded, trading TLB, price should be bullish from now, at least for the short term to lock in profit and ride the rest up.
Good luck

eurgbp 27 Mar inverted head and shoulderA possible ihns is forming, loading some long and will load more when price closed above neckline
Good luck

DeGRAM | EURGBP rebound in the channelEURGBP is in a descending channel between the trend lines.
The price is moving from the lower boundary of the channel and the support level.
The chart holds the support level, which has already acted as a rebound point.
We expect a rise after consolidation above the nearest retracement level.
-------------------
Share your opinion in the comments and support the idea with like. Thanks for your support!

Eurgbp 26 MarPrice had reached lower channel and should be bullish at least for the short term
Had loaded long positions here, will be looking for a break above resistant line for more bullish view to trigger
Good luck

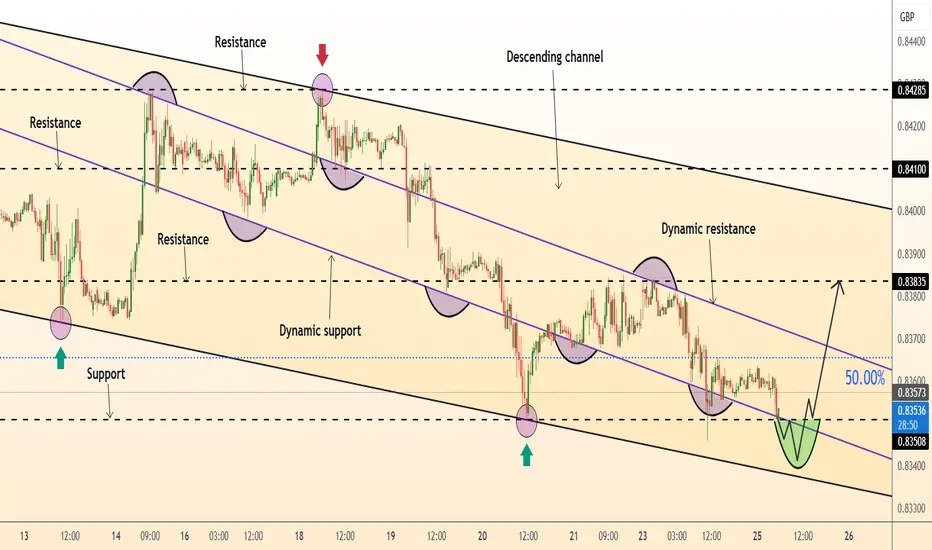
DeGRAM | EURGBP rebound from the lower boundary of the channelEURGBP is in a descending channel above the trend lines.
The price is moving from the lower boundary of the channel.
The chart has consolidated above the dynamic resistance and the 50% correction level.
We expect the rebound to continue.
-------------------
Share your opinion in the comments and support the idea with like. Thanks for your support!

SHORT ON EUR/GBPPrice is currently pulling back from its over uptrend on this pair.
Just following the current downtrend structure looking to make 80-100 pips to the next demand zone or imbalance.

EUR/GBP Chart Analysis – Double Bottom Reversal & Breakout Setup1. Market Structure & Context
The EUR/GBP daily chart presents a well-defined double bottom reversal pattern, indicating a potential trend shift from a prolonged downtrend to an uptrend.
The pair has been in a bearish phase, as reflected by the descending trendline.
However, price action suggests a possible trend reversal, as buyers are stepping in near a key demand zone.
A successful neckline breakout would confirm the bullish reversal, potentially leading to significant upside movement.
2. Key Chart Patterns & Technical Levels
A. Double Bottom Formation (Bullish Reversal Pattern)
The double bottom is a powerful reversal pattern, often signaling the end of a downtrend. It consists of two similar low points, forming a "W" shape.
Bottom 1: The first low was established around 0.8200 - 0.8250, where buyers initially stepped in to push prices higher.
Bottom 2: Price retested this demand zone, but sellers failed to push it lower, confirming a strong support level.
Bullish Significance: The inability of sellers to break below the support zone suggests the exhaustion of selling pressure and increasing buy-side interest.
B. Neckline Resistance & Potential Breakout Zone
The neckline resistance is drawn around 0.8450 - 0.8500, a key level where previous price rallies were rejected.
A breakout above this zone, ideally with strong bullish volume, would validate the double bottom pattern and trigger a bullish breakout trade.
C. Descending Trendline Breakout Attempt
The long-term downtrend resistance (trendline) has been holding since mid-2024.
Price is currently testing this trendline; a clear breakout and retest would add further confidence to the bullish bias.
3. Trade Setup & Execution Plan
A. Entry Strategy
There are two possible entry strategies, depending on risk appetite:
Aggressive Entry: Buy immediately upon a breakout above 0.8500, anticipating a strong rally.
Conservative Entry: Wait for a breakout + retest of the neckline before entering, ensuring confirmation.
B. Stop Loss & Risk Management
Stop Loss (SL): Placed below the recent swing low at 0.82029.
This level acts as the last line of defense for bulls; if price drops below it, the bullish thesis is invalidated.
C. Take Profit (TP) Targets
TP1: 0.86122 (first resistance zone, a previous swing high).
TP2: 0.87284 (higher resistance level, next supply zone).
These levels serve as potential profit-taking areas where sellers may re-enter the market.
4. Additional Technical Confluences Supporting Bullish Bias
✔ Key Support Zone Holding Strong – The price has bounced twice from the demand zone (0.8200 - 0.8250), confirming strong buyer interest.
✔ Volume Confirmation Needed – A breakout with high volume increases the probability of sustained bullish momentum.
✔ RSI & Momentum Indicators – If RSI crosses above 50, it would further confirm bullish momentum, supporting the breakout trade.
✔ Favorable Risk-to-Reward Ratio (RRR) – A well-defined stop loss & take profit strategy ensures an optimal trade setup.
5. Summary & Final Trading Plan
Current Market Bias: Bullish if neckline breaks (Double Bottom Confirmation).
Entry Confirmation: Look for a breakout above 0.8500 with strong volume.
Profit Targets:
TP1: 0.8612
TP2: 0.8728
Stop-Loss Level: Below 0.8202 to protect against fake breakouts.
🚀 Final Tip for Traders:
Monitor price action & volume closely. A breakout without volume may lead to a false move. Confirmation with bullish momentum is essential for a high-probability trade setup.

EUR-GBP Bearish Breakout! Sell!
Hello,Traders!
EUR-GBP made a bearish
Breakout of key horizontal
Level of 0.8353 so we are
Bearish biased and after
A potential pullback we will
Be expecting a further
Bearish move down
Sell!
Comment and subscribe to help us grow!
Check out other forecasts below too!
Disclosure: I am part of Trade Nation's Influencer program and receive a monthly fee for using their TradingView charts in my analysis.

EURGBP: Growth & Bullish Forecast
It is essential that we apply multitimeframe technical analysis and there is no better example of why that is the case than the current EURGBP chart which, if analyzed properly, clearly points in the upward direction.
Disclosure: I am part of Trade Nation's Influencer program and receive a monthly fee for using their TradingView charts in my analysis.
❤️ Please, support our work with like & comment! ❤️

EUR/GBP (1H) Symmetrical Triangle Breakdown – Trade SetupThe EUR/GBP 1-hour chart presents a symmetrical triangle formation that has now broken to the downside, signaling a bearish continuation. This pattern is widely recognized in technical analysis and often acts as a continuation or reversal pattern, depending on the breakout direction. In this case, the price has breached the lower support boundary, indicating that sellers have taken control of the market.
In this detailed analysis, we will explore the chart structure, key technical levels, potential trade setups, and risk management strategies to navigate this move efficiently.
1️⃣ Understanding the Symmetrical Triangle Formation
A symmetrical triangle occurs when price action creates lower highs and higher lows, forming two converging trendlines. This reflects a period of market indecision, where buyers and sellers are evenly matched until a breakout occurs.
📌 Key characteristics of this triangle:
✅ Converging Trendlines – Representing lower highs and higher lows, suggesting market compression.
✅ Price Consolidation – The pair traded within this structure, awaiting a catalyst for breakout.
✅ Breakout Direction – A breakdown from the support level confirms a bearish move.
Pattern Psychology:
A symmetrical triangle often precedes a significant price move. Traders and investors monitor the breakout direction to determine the next trend. Here, the breakdown below the lower boundary signals a continuation of the prevailing bearish trend.
2️⃣ Key Levels & Chart Structure
🔹 Resistance Zone (Upper Boundary) – 0.84227
The upper trendline acted as a strong resistance level, preventing price from breaking higher multiple times.
The yellow-highlighted area represents a supply zone, where selling pressure was dominant.
Price attempted to break above this region but failed, confirming bearish dominance.
🔹 Support Level (Lower Boundary) – 0.83500
The lower boundary of the triangle previously held as support, where buyers attempted to push the price higher.
However, once price broke below this support, it confirmed a bearish trend continuation.
The blue horizontal support line represents a potential retest area, where sellers may step in again.
🔹 Breakout Confirmation & Price Action
The chart clearly shows a bearish breakout, as price broke through the lower trendline.
Retest Probability: Many breakouts experience a pullback to the broken support (now resistance) before resuming the downtrend.
The dashed black lines illustrate the expected bearish move, with a potential decline towards 0.82815.
3️⃣ Trading Plan & Entry Strategy
Based on this setup, traders can capitalize on the bearish move using a structured trading plan:
📌 Bearish Trading Setup (Short Position)
✔ Entry Strategy:
Traders can enter a short position either immediately after the breakout or after a retest of the broken support at 0.83500 - 0.83700.
The ideal confirmation would be bearish candlestick patterns, such as an engulfing candle or pin bar rejection on the retest.
✔ Stop-Loss Placement:
To mitigate risk, a stop-loss should be placed above the previous resistance level (0.84227).
This ensures protection against fake breakouts or sudden reversals.
✔ Target Price (Take Profit Level):
The measured move of a symmetrical triangle breakout is typically equal to the height of the triangle.
Based on this projection, the expected target is around 0.82815, a significant support level.
Traders may also scale out at intermediate levels (0.83000) to lock in profits.
✔ Risk-Reward Ratio (RRR):
A well-structured trade here presents an attractive RRR of approximately 1:3, meaning the potential reward is three times the risk.
A higher RRR enhances the probability of profitability over multiple trades.
4️⃣ Market Context & Fundamental Analysis
🔍 Why Is EUR/GBP Dropping?
While technical patterns are valuable, traders must also consider fundamental factors that drive currency pairs.
🟢 Possible Bearish Catalysts for EUR/GBP:
GBP Strength: If the British Pound (GBP) strengthens due to strong economic data or hawkish Bank of England (BoE) policy, EUR/GBP may continue declining.
EUR Weakness: The Euro (EUR) may be under pressure due to weak GDP growth, higher inflation, or dovish European Central Bank (ECB) statements.
Geopolitical Events: Any negative news impacting the Eurozone (e.g., political instability) could trigger further selling pressure on EUR/GBP.
5️⃣ Risk Management & Alternative Scenarios
While the current outlook favors a bearish move, traders must remain prepared for alternative scenarios.
⚠ Alternative Scenarios: 📌 False Breakdown:
If price closes back above the support level (0.83500 - 0.83700), it could indicate a failed breakout, potentially leading to a bullish reversal.
In this case, a breakout above 0.84227 would invalidate the bearish setup.
📌 Sideways Consolidation:
If the price stalls around 0.83300 - 0.83500, the market may range before the next move.
Traders should wait for clear confirmation before entering new trades.
6️⃣ Summary & Key Takeaways
✅ Pattern Identified: Symmetrical Triangle Breakout (Bearish).
✅ Breakout Direction: Price has broken below support, confirming a downtrend.
✅ Trade Setup:
Sell below 0.83500 (or on retest at 0.83700).
Stop Loss: Above 0.84227 (previous resistance).
Take Profit: Targeting 0.82815 based on the pattern’s measured move.
✅ Risk-Reward: Favorable, offering 1:3 or higher RRR.
✅ Fundamental Drivers: GBP strength or EUR weakness could accelerate the downtrend.
📢 Final Thoughts
This symmetrical triangle breakdown offers a high-probability trading opportunity for short sellers, with a clear technical structure supporting the bearish move. However, traders should remain cautious of false breakouts and adjust stop-loss levels accordingly.
For best results:
✔ Wait for price action confirmation (retest rejection or bearish candle formations).
✔ Follow proper risk management (stop-loss placement and profit-taking levels).
✔ Monitor key economic events impacting EUR and GBP movements.
By combining technical analysis, fundamental insights, and sound risk management, traders can enhance their profitability and navigate the markets with confidence. 🚀📉

Why eurgbp will sell this newyork session!!In my analysis, we are observing signs of weakness in the Euro, as indicated by recent candlestick formations that reflect a notable lack of buying pressure. This behavior appears to be aligning with key Fibonacci retracement levels, suggesting a potential transition towards lower price levels. I anticipate that in the pre-New York session, we may witness a temporary fake-out before a subsequent downward movement. Traders should exercise caution and consider these factors in their decision-making process
Follow me for more breakdown!!

EURGBP SELLTracking EUR/GBP on the 15-minute timeframe, we see a potential short opportunity from a key supply zone.
Key Zones & Setup:
🟣 Bearish Order Block (Supply Zone): 0.83800 - 0.83830
This area acted as strong resistance, where institutional traders likely positioned sell orders.
Expecting price to push into this zone before reversing lower.
Break of Structure (BOS) on lower timeframes (M5/M1) is needed for confirmation.
🔵 Target Area (Demand Zone): 0.83450
If the supply zone holds, price could drop toward this key demand level.
This zone aligns with previous BOS levels and price reactions.
Trade Plan:
📈 Waiting for price to push into the supply zone (0.83800 - 0.83830).
🔎 Looking for BOS on lower timeframes (M5/M1) before shorting.
✅ Entering a sell position upon confirmation.
🎯 Targeting the 0.83450 demand zone.
⚠️ Stop-loss above 0.83830 to manage risk.
Market Outlook:
If price fails to break structure, we avoid shorts and reassess.
This setup follows smart money concepts (SMC) with a focus on BOS and order blocks.
💬 What do you think? Are you seeing the same setup? 🚀🔥

DeGRAM | EURGBP retest of supportEURGBP is in a descending channel between trend lines.
The price is moving from the lower boundary of the channel and now has fallen back to the support level.
The volatility of the chart has decreased.
On the 1H Timeframe, the indicators have formed a bullish convergence, which has not yet worked out.
We expect a rebound from the support.
-------------------
Share your opinion in the comments and support the idea with like. Thanks for your support!

EURGBP INTRADAY sideways consolidation capped at 0.8420The EUR/GBP pair continues to exhibit bearish sentiment, reinforced by the prevailing downtrend. The key intraday resistance level is at 0.8420, marking the current swing high.
Bearish Scenario:
An oversold rally from current levels, followed by a bearish rejection at 0.8420, would likely target downside support at 0.8353. A break below this level would open the door for further declines toward 0.8335 and 0.8300 in the longer timeframe.
Bullish Scenario:
Alternatively, a confirmed breakout above the 0.8420 resistance, accompanied by a daily close above this level, would invalidate the bearish outlook. This would pave the way for further rallies, with the next resistance levels at 0.8450 and 0.8490.
Conclusion:
The prevailing sentiment remains bearish as long as 0.8420 holds as resistance. Traders should watch for rejection at this level to confirm downside momentum. Conversely, a decisive breakout above 0.8420 would signal a potential shift to a bullish bias, targeting higher resistance levels.
This communication is for informational purposes only and should not be viewed as any form of recommendation as to a particular course of action or as investment advice. It is not intended as an offer or solicitation for the purchase or sale of any financial instrument or as an official confirmation of any transaction. Opinions, estimates and assumptions expressed herein are made as of the date of this communication and are subject to change without notice. This communication has been prepared based upon information, including market prices, data and other information, believed to be reliable; however, Trade Nation does not warrant its completeness or accuracy. All market prices and market data contained in or attached to this communication are indicative and subject to change without notice.

EUR/GBP Chart Analysis – Inverse Head & Shoulders Bullish SetupThis EUR/GBP 1-hour chart showcases a classic Inverse Head & Shoulders (H&S) pattern, signaling a potential trend reversal from bearish to bullish. This pattern is considered one of the most reliable technical formations for spotting upcoming upward momentum, particularly after a prolonged downtrend.
🔎 Market Overview
Currency Pair: EUR/GBP
Timeframe: 1-Hour (H1)
Current Price: 0.83720
Trend: Transitioning from a downtrend to a potential bullish breakout
Key Pattern: Inverse Head & Shoulders
Trading Bias: Bullish (Pending breakout confirmation)
📊 Chart Breakdown & Technical Analysis
1️⃣ Market Structure & Trend Analysis
Before the formation of the Inverse Head & Shoulders, the market was in a strong downtrend, making lower highs and lower lows. However, buyers started stepping in near the 0.8350 level, preventing further decline. This rejection at key support has set the stage for a potential trend reversal.
Left Shoulder: Price formed a minor low around 0.8370, followed by a small bounce.
Head: Price made a deeper low around 0.8351, confirming strong support and buyer interest.
Right Shoulder: Price attempted another dip but failed to break below the previous low, forming a higher low near 0.8370, signaling increasing bullish pressure.
Neckline Resistance: 0.8385 - 0.8390 zone – a crucial level that price needs to break for confirmation of an uptrend.
2️⃣ Key Support & Resistance Levels
Support Level: 0.83513 (Major demand zone)
Resistance Levels:
Neckline: 0.8385 - 0.8390 (Breakout confirmation zone)
Major Resistance: 0.84308 (Target level)
Curve Zone: A dynamic resistance trendline that has been containing price action. A breakout above this curve signals a potential shift in trend.
📈 Trading Strategy – Bullish Breakout Plan
✅ Entry Strategy:
A long trade should be considered only after a confirmed breakout above the neckline (0.8385 - 0.8390). The confirmation comes when:
A strong bullish candle closes above the neckline.
Increased trading volume supports the breakout.
A possible retest of the neckline as new support (0.8385) before continuation.
🎯 Target Price & Stop Loss:
Take Profit (TP): 0.84308 (Projected move based on pattern size).
Stop Loss (SL): Below 0.83513 (Right Shoulder low).
Risk-to-Reward Ratio (RRR): 1:2 or higher, making this a high-probability trade setup.
🛑 Risk Management & Trade Confirmation:
Volume Confirmation: A breakout should be accompanied by a volume spike, confirming strong buyer interest.
Fakeout Warning: If price briefly breaks above the neckline but then falls back below, it could be a false breakout. In this case, waiting for a retest would be a safer approach.
Trailing Stop: Once price moves toward 0.8410, a trailing stop can help secure profits in case of market reversals.
🧐 Summary – Key Takeaways
✅ Inverse Head & Shoulders Identified – A reliable bullish reversal pattern.
✅ Breakout Zone: 0.8385 - 0.8390 (Watch for confirmation).
✅ Target Price: 0.84308 (Potential profit zone).
✅ Stop Loss: Below 0.83513 (Protect against downside risk).
✅ Risk-to-Reward Ratio: Favorable (1:2 or better).
✅ Trading Plan: Buy above the neckline, aim for 0.8430, and manage risk properly.
📌 Final Thought: If the neckline is broken with strong momentum, expect a bullish move toward 0.8430+. However, traders should remain cautious of potential fakeouts and manage risk accordingly.
📢 Share your thoughts in the comments! Are you bullish on EUR/GBP? 🚀📊
#EURGBP #ForexTrading #TechnicalAnalysis #TradingSetup #InverseHeadAndShoulders

EURGBP - Sell SetupLooking to go short. Waiting for slight pullback to upside to then sell.
Leave a comment below, let me know what you think. Share with friends. Check out my profile for more awesome trade plans and setups
Trade Safe - Trade Well.
~Michael Harding CEO at LEFTURN
WHY EURNZD IS BULLISH AGAING ?? DETAILED ANALYSISEUR/NZD is currently trading at approximately 1.886, having completed a retesting phase following a bullish breakout. This technical development suggests the potential for a renewed upward movement toward the target price of 1.9300. With strong bullish momentum building, traders are closely watching for confirmation signals to enter long positions.
Fundamentally, the Reserve Bank of New Zealand (RBNZ) recently implemented a 50 basis point rate cut, reducing the benchmark rate to 3.75%, with indications of further easing to stimulate the economy. This dovish monetary policy stance tends to exert downward pressure on the New Zealand dollar, thereby supporting the EUR/NZD pair. Meanwhile, the Eurozone has maintained a more stable monetary policy, contributing to euro strength relative to the New Zealand dollar. This divergence in central bank policies enhances the bullish outlook for EUR/NZD.
Technical indicators further reinforce this perspective. The pair has been in a downward channel since mid-February; however, recent bullish candles indicate a potential short-term reversal or correction. The price has swiftly moved from the lower Bollinger Band to the upper band, breaking through the middle band in a strong bullish move. Additionally, EUR/NZD is currently testing the 50% Fibonacci retracement level, a key decision point for traders.
Considering these technical and fundamental factors, the EUR/NZD pair appears poised for a bullish wave toward the 1.9300 target. Traders should monitor key resistance levels and employ appropriate risk management strategies to capitalize on this potential upward movement. If momentum continues, this setup could present a profitable long trade opportunity in the coming sessions.
