EURGBP – WEEKLY FORECAST Q3 | W30 | Y25📊 EURGBP – WEEKLY FORECAST
Q3 | W30 | Y25
Weekly Forecast 🔍📅
Here’s a short diagnosis of the current chart setup 🧠📈
Higher time frame order blocks have been identified — these are our patient points of interest 🎯🧭.
It’s crucial to wait for a confirmed break of structure 🧱✅ before forming a directional bias.
This keeps us disciplined and aligned with what price action is truly telling us.
📈 Risk Management Protocols
🔑 Core principles:
Max 1% risk per trade
Only execute at pre-identified levels
Use alerts, not emotion
Stick to your RR plan — minimum 1:2
🧠 You’re not paid for how many trades you take, you’re paid for how well you manage risk.
🧠 Weekly FRGNT Insight
"Trade what the market gives, not what your ego wants."
Stay mechanical. Stay focused. Let the probabilities work.
FRGNT FOREX ANALYSIS 📊
EURGBP

EUR-GBP Long From Rising Support! Buy!
Hello,Traders!
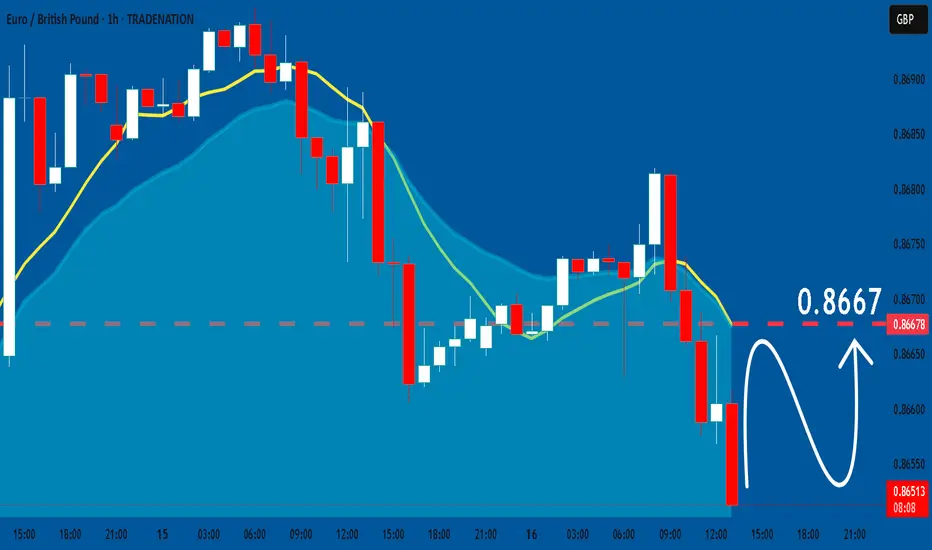
EUR-GBP is trading in an
Uptrend along the rising
Support line and the pair
Is going down now so after
The retest we will be
Expecting a bullish rebound
And a move up
Buy!
Comment and subscribe to help us grow!
Check out other forecasts below too!
Disclosure: I am part of Trade Nation's Influencer program and receive a monthly fee for using their TradingView charts in my analysis.

EUR-GBP Long From Rising Support! Buy!
Hello,Traders!
EUR-GBP is trading in an
Uptrend along the rising
Support line and the pair
Is going down now so after
The retest we will be
Expecting a bullish rebound
And a move up
Buy!
Comment and subscribe to help us grow!
Check out other forecasts below too!
Disclosure: I am part of Trade Nation's Influencer program and receive a monthly fee for using their TradingView charts in my analysis.

EURGBP SHORT – DAILY FORECAST Q3 | D17/18 | W29 | Y25💼 EURGBP SHORT – DAILY FORECAST
Q3 | D17/18 | W29 | Y25
FUN COUPON FRIDAY INCOMING !
📊 MARKET STRUCTURE SNAPSHOT
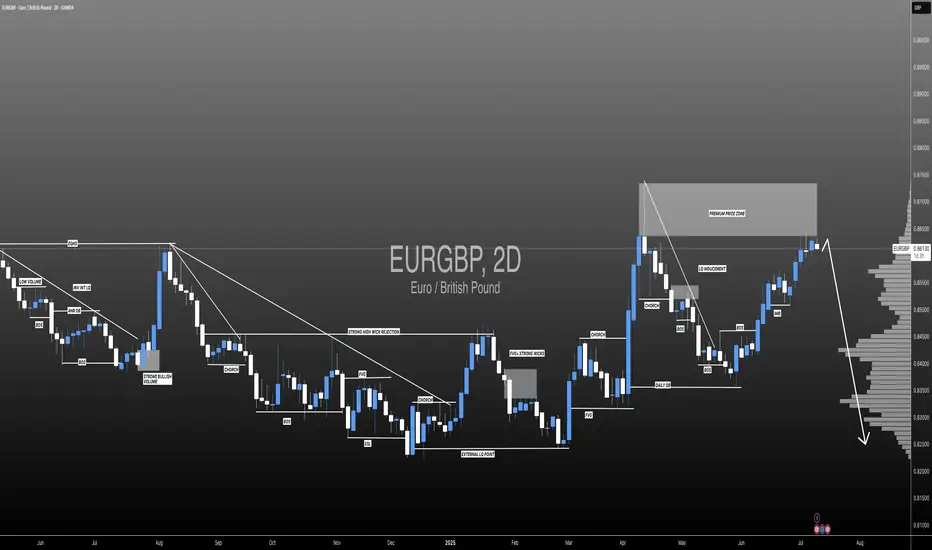
EURGBP is currently reacting from a key higher time frame supply zone, with price action showing weakness at premium levels. Momentum has slowed, and early signs of distribution are appearing. With structure aligning bearishly across multiple timeframes, the pair presents a short bias opportunity.
🔍 Confluences to Watch 📝
✅ Daily Order Block (OB)
Price reacted from a high-probability bearish OB.
Rejection wicks and a shift in candle body control point to supply dominance.
Momentum is fading, confirming the presence of smart money sellers.
✅ 4H Order Block
Clear mitigation of 4H OB followed by an internal break of structure (iBoS).
Price is respecting the OB zone, printing lower highs beneath key supply.
Perfect mid-timeframe confirmation of trend transition.
✅ 1H Order Block
1H structure shifted bearish, validating LTF trend alignment.
Price building supply chain with continued lower highs and bearish engulfing patterns.
Ideal zone for entry on pullback or liquidity sweep.
📈 Risk Management Protocols
🔑 Core Principles:
💰 Max 1% risk per trade
📍 Only execute at pre-identified zones
⏰ Set alerts — avoid impulsive trades
📉 Respect RR — minimum 1:2 per position
🧠 You're not paid for frequency. You're paid for discipline and execution quality.
🧠 Weekly FRGNT Insight
“Trade what the market gives, not what your ego wants.”
Stay mechanical, stay focused, and allow the probabilities to play out. Your job is to control risk — not the outcome.
🏁 Final Thoughts from FRGNT
📌 The structure is clear.
📌 The confluences are stacked.
📌 The bias is confirmed.
Let your execution reflect your discipline, not your emotions.
❤️ Good luck this week, and as always – I’ll see you at the very top.

EURGBP Trading Opportunity! BUY!
My dear friends,
My technical analysis for EURGBP is below:
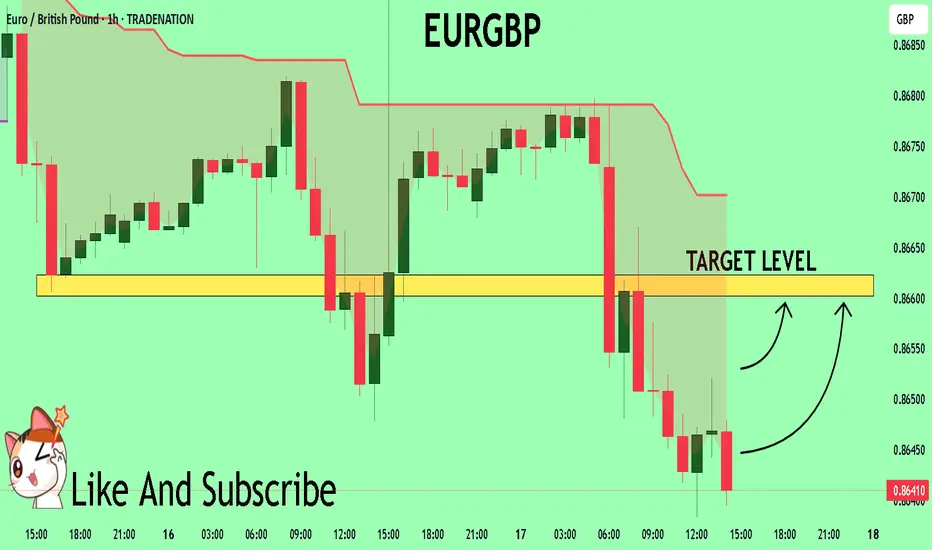
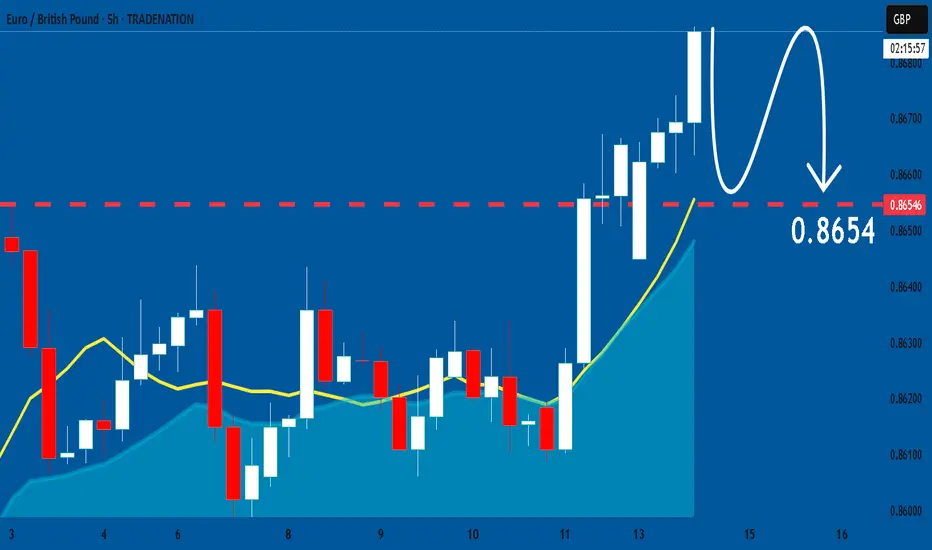
The market is trading on 0.8645 pivot level.
Bias - Bullish
Technical Indicators: Both Super Trend & Pivot HL indicate a highly probable Bullish continuation.
Target - 0.8660
About Used Indicators:
A pivot point is a technical analysis indicator, or calculations, used to determine the overall trend of the market over different time frames.
Disclosure: I am part of Trade Nation's Influencer program and receive a monthly fee for using their TradingView charts in my analysis.
———————————
WISH YOU ALL LUCK
EURGBP Bullish Setup Analysis – MMC + Volume Absorption + TargetIn today's EUR/GBP 30-minute chart, we can clearly observe a well-structured Market Maker Cycle (MMC) in play, accompanied by Smart Money concepts such as volume absorption, minor BOS (Break of Structure), and reversal zone identification. Let’s walk through the technical story unfolding:
🧠 Step-by-Step Breakdown:
🟣 1. Reversal Zone & QFL (Quasimodo Failed Level) Formation
The price made a sharp decline, which trapped retail sellers chasing the breakout to the downside.
This drop landed into a key reversal zone — a price pocket where Smart Money often steps in for accumulation.
The QFL structure is evident here, showing a previous demand zone break and then recovery — classic stop-loss hunting behavior followed by institutional positioning.
This is often considered the “Spring” or “Manipulation” phase in Wyckoff or MMC theory.
🟩 2. Volume Absorption & Compression Phase
After tapping into the reversal zone, price action entered a tight compression range, forming a wedge/triangle.
During this phase, volume absorption is clearly visible — large players are absorbing selling pressure without letting price drop further.
This is a signal of re-accumulation. Buyers are loading up while keeping the price suppressed to mislead retail traders.
You’ve rightly labeled this phase as “Structure Mapping + Volume Absorption” — a textbook Smart Money behavior prior to breakout.
🔓 3. Minor Breaks of Structure (BOS)
As price consolidates, we begin to see Minor BOS— subtle shifts in structure where previous highs are taken out.
These BOS levels are confirmation that demand is outweighing supply.
Once we break multiple minor highs, it shows that buyers are now in control — hinting at the transition from Accumulation → Expansion.
📈 4. Projected Next Reversal + Breakout Scenario
The marked Next Reversal Zone above (around 0.8680–0.8695) is where we can expect the first true breakout and major expansion.
If price enters this area with increased volume, it validates that Smart Money is pushing into the Markup Phase of the MMC.
After the breakout, we could see price push toward 0.8710 and above.
📊 5. Market Maker Cycle (MMC) Summary
What we’re seeing here is a full-scale MMC pattern unfolding:
Manipulation (QFL trap ) → Accumulation (Volume absorption) → Structure Shift (Minor BOS) → Expansion (Reversal breakout)
This is the kind of setup that offers high-probability entries for those who understand Smart Money dynamics and wait for confirmation.
🎯 Key Levels to Watch:
Reversal Support Zone: 0.86450 – 0.86500
Breakout Target Zone: 0.86800 – 0.86950
Final Target (Swing): 0.87100+
🧠 Final Thoughts:
This EUR/GBP setup shows everything we love to see:
Liquidity taken ✅
Structure forming ✅
Volume building ✅
BOS confirming ✅
Expansion pending 🔜
Be patient. Let Smart Money reveal their hand through price action and volume confirmation.

EURGBP: Expecting Bullish Movement! Here is Why:
The charts are full of distraction, disturbance and are a graveyard of fear and greed which shall not cloud our judgement on the current state of affairs in the EURGBP pair price action which suggests a high likelihood of a coming move up.
Disclosure: I am part of Trade Nation's Influencer program and receive a monthly fee for using their TradingView charts in my analysis.
❤️ Please, support our work with like & comment! ❤️
EURGBP Analysis : Bullish Setup + Support & Reversal Zone Ahead🔍 Overview:
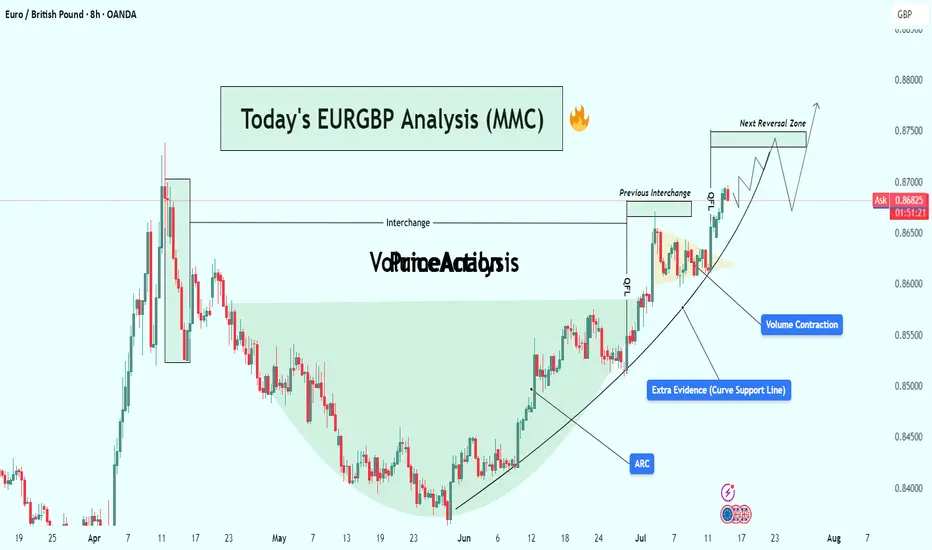
This analysis explores a well-developed Mid-Market Cycle (MMC) pattern playing out on the EUR/GBP 8H chart. The price action has transitioned from accumulation to markup, forming a classic cup-shaped recovery structure supported by a parabolic ARC curve. With strong volume contraction, historical interchange zones, and clean breakouts, this setup indicates bullish momentum heading into the next reversal zone.
Let’s walk through each component in detail and build the case for this trade setup.
🧩 1. MMC Cycle Framework
The chart structure aligns with the MMC (Mid-Market Cycle) model:
Phase 1 – Accumulation:
From April to late May, price formed a rounded bottom resembling a "cup" — a known sign of smart money accumulation. The downward momentum stalled, and sellers were gradually absorbed by larger participants.
Phase 2 – Breakout & Expansion:
Early June saw price breaking out of this base, beginning an aggressive uptrend supported by rising structure. This marks the transition to the markup phase of the MMC.
Phase 3 – Pullback & Continuation:
Price pulled back slightly into previous resistance (now turned support), forming a bullish continuation triangle and breaking out again. A textbook MMC continuation.
🧠 2. Technical Confluences
✅ A. ARC Support Curve
The curved support line (ARC) acts as dynamic demand.
Price has bounced multiple times off the curve, reinforcing its strength.
ARC patterns often signal increasing bullish acceleration, reflecting market psychology as traders gain confidence with each higher low.
✅ B. Interchange Zones
The concept of Interchange refers to zones where support becomes resistance or vice versa.
This chart features two key interchange levels:
First interchange formed after the April high.
Second interchange was retested and held cleanly after the breakout.
These areas indicate institutional interest, and their successful retests confirm trend continuation.
✅ C. Volume Contraction
Volume has been shrinking during the markup, which is counterintuitive but strategic.
In Wyckoff theory, this shows absorption of supply — institutions deliberately suppress volatility to accumulate before the next breakout.
Once the contraction ends, explosive moves often follow.
🎯 3. Target Zone: Next Reversal Area
Price is now heading into a clearly defined resistance zone around 0.87400–0.87500.
This level was respected in prior price history (April peak) and may trigger short-term selling or distribution.
The chart shows a possible liquidity grab scenario at the reversal zone, followed by a corrective move (mini bearish ABC).
📈 4. Price Projection & Scenarios
Bullish Case (High Probability)
Breakout Above 0.87500: Triggers a major leg upward.
Potential extension targets:
0.87850 (Fibonacci projection)
0.88200 (next higher timeframe resistance)
Bearish Case (Short-Term Pullback)
Rejection at Reversal Zone:
A corrective leg toward the ARC or prior interchange.
Ideal re-entry for buyers near:
0.86400–0.86600 zone
Or curve retest near 0.86000
🧭 5. Trade Strategy
🔹 Entry Options:
Breakout Entry: Above 0.87500 on strong candle + volume.
Retest Entry: On dip toward ARC curve or interchange.
🔹 Stop-Loss Ideas:
Below ARC line (~0.86000)
Below last bullish engulfing (~0.86250)
🔹 Targets:
TP1: 0.87500
TP2: 0.87850
TP3: 0.88200 (longer-term swing)
💡 6. Trader Psychology in This Chart
This chart represents a controlled bullish structure — a hallmark of smart money participation. Here’s why:
The rounding base was methodically built without sudden volatility.
Each breakout was followed by healthy retests (no fakeouts).
Volume stayed low during markups, reducing retail confidence and allowing institutional loading.
The ARC curve reflects increasing confidence and participation — buyers consistently stepping in on higher lows.
📌 Conclusion
This EUR/GBP setup is a textbook MMC/ARC structure with multiple confirmations:
Smart accumulation
Curve support respected
Volume and structure aligned
Clear next resistance zone
Whether you’re swing trading or monitoring for breakout scalps, this is a high-quality setup worth tracking. Be ready to act at the reversal zone, as it will either confirm continuation or offer a lucrative retest entry.
🔔 Follow for More:
I post regular MMC, structure-based, and Smart Money trade setups. Drop a like, comment your thoughts, or ask questions below!
EURGBP Bullish Flag Pattern!
HI,Traders !
EURGBP is trading in an
Uptrend and made a bullish
Breakout out of bullish flag
Pattern so we are
Bullish biased and we
Will be expecting a
Further bullish move up !
Comment and subscribe to help us grow !

EUR-GBP Strong Bullish Breakout! Buy!
Hello,Traders!
EUR-GBP is trading in a
Strong uptrend and the
Pair made a bullish breakout
Of the key horizontal level
Of 0.8659 so we are
Bullish biased and we will
Be expecting a further
Bullish move up
Buy!
Comment and subscribe to help us grow!
Check out other forecasts below too!
Disclosure: I am part of Trade Nation's Influencer program and receive a monthly fee for using their TradingView charts in my analysis.

EURGBP: Bears Will Push Lower
Remember that we can not, and should not impose our will on the market but rather listen to its whims and make profit by following it. And thus shall be done today on the EURGBP pair which is likely to be pushed down by the bears so we will sell!
Disclosure: I am part of Trade Nation's Influencer program and receive a monthly fee for using their TradingView charts in my analysis.
❤️ Please, support our work with like & comment! ❤️
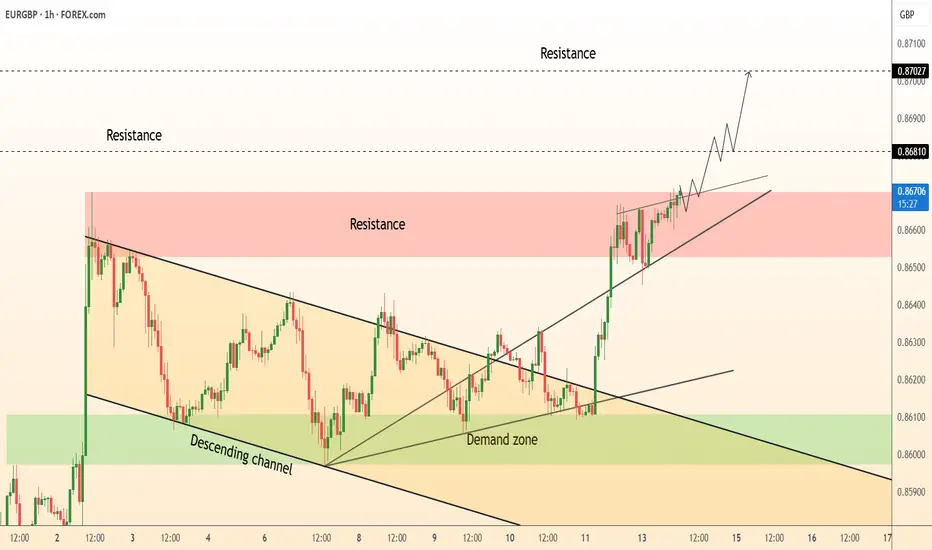
EURGBP Bullish continuation breakout supported at 0.8620The EURGBP remains in a bullish trend, with recent price action showing signs of a corrective pullback within the broader uptrend.
Support Zone: 0.8620 – a key level from previous consolidation. Price is currently testing or approaching this level.
A bullish rebound from 0.8620 would confirm ongoing upside momentum, with potential targets at:
0.8700 – initial resistance
0.8715 – psychological and structural level
0.8740 – extended resistance on the longer-term chart
Bearish Scenario:
A confirmed break and daily close below 0.8620 would weaken the bullish outlook and suggest deeper downside risk toward:
0.8600 – minor support
0.8590 – stronger support and potential demand zone
Outlook:
Bullish bias remains intact while the EURGBP holds above 0.8620. A sustained break below this level could shift momentum to the downside in the short term.
This communication is for informational purposes only and should not be viewed as any form of recommendation as to a particular course of action or as investment advice. It is not intended as an offer or solicitation for the purchase or sale of any financial instrument or as an official confirmation of any transaction. Opinions, estimates and assumptions expressed herein are made as of the date of this communication and are subject to change without notice. This communication has been prepared based upon information, including market prices, data and other information, believed to be reliable; however, Trade Nation does not warrant its completeness or accuracy. All market prices and market data contained in or attached to this communication are indicative and subject to change without notice.
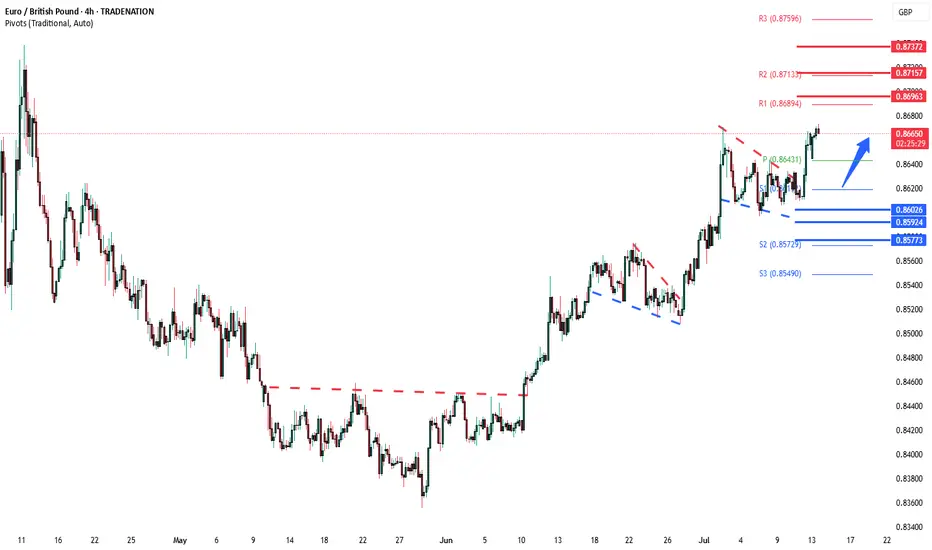
DeGRAM | EURGBP broke out of the descending channel📊 Technical Analysis
● Price has punched through the month-long descending-channel roof and is holding the break, carving a tight bullish flag along a fresh up-trend line.
● Rebound from the 0.861 demand created an inverted H&S; its 1 : 1 projection aligns with the 0.8681 pivot and the March high at 0.8703, while RSI remains mid-range, leaving upside fuel.
💡 Fundamental Analysis
● Softer UK wage-growth and uptick in jobless claims revived talk of an August BoE cut, whereas a surprise rise in the Euro-area ZEW expectations index hints at stabilising growth, nudging rate-differential momentum toward the euro.
✨ Summary
Long 0.8650-0.8665; sustained trade above 0.8640 targets 0.8680 → 0.8703. Invalidate on an H1 close below 0.8610.
-------------------
Share your opinion in the comments and support the idea with like. Thanks for your support!
EURGBP – Waiting for the Market to Come to UsWe are patiently waiting for price to correct
and reach our level.
📌 If the price touches the level and gives us a valid signal,
we will buy.
📉 But if the level is broken, we don't panic —
we simply wait for a pullback and enter a short position.
🧠 No guessing, no stress.
We let the market come to us, and then we react — according to plan.

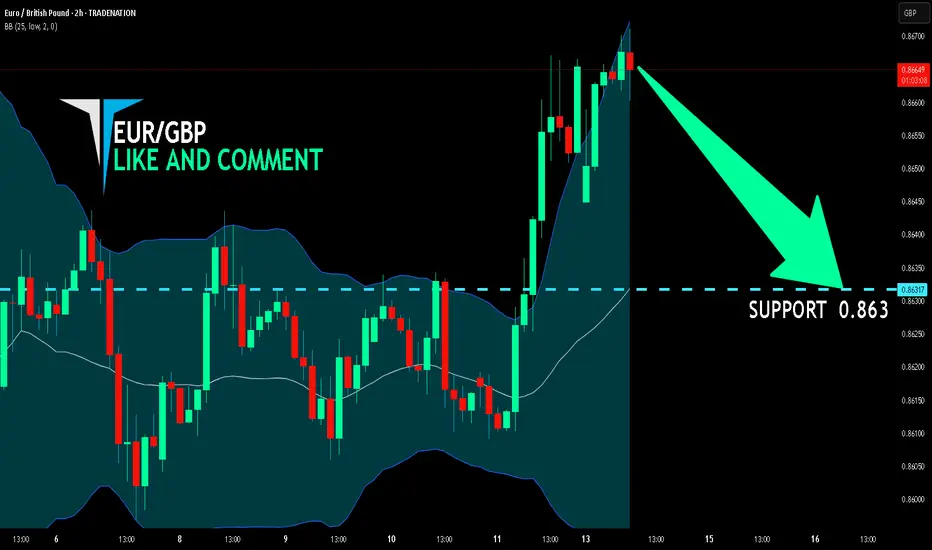
EUR/GBP BEARS ARE STRONG HERE|SHORT
Hello, Friends!
We are going short on the EUR/GBP with the target of 0.863 level, because the pair is overbought and will soon hit the resistance line above. We deduced the overbought condition from the price being near to the upper BB band. However, we should use low risk here because the 1W TF is green and gives us a counter-signal.
Disclosure: I am part of Trade Nation's Influencer program and receive a monthly fee for using their TradingView charts in my analysis.
✅LIKE AND COMMENT MY IDEAS✅
Ready to Raid the Chunnel? EUR/GBP Bullish Strategy Unveiled!🔥🤑 "THE CHUNNEL HEIST: EUR/GBP BULLISH LOOTING SEASON!" 🏴☠️💸
🌟 Greetings, Market Pirates & Profit Bandits! 🌟
(Hi! Hola! Ola! Bonjour! Hallo! Marhaba!)
Based on the 🚨THIEF TRADING STYLE🚨 (a ruthless mix of technical & fundamental analysis), we’re plotting a major heist on EUR/GBP "The Chunnel"—time to LOOT THE BULLS!
🚨 HEIST BLUEPRINT (LONG ENTRY) 🚨
🎯 Escape Zone: High-risk RED MA Zone (Overbought? Reversal? Trap? Bears lurking? Cops are waiting!).
🏆 Take Profit & Run! You’ve earned it, outlaw! 💰🔥
🔓 ENTRY: "VAULT IS OPEN—SWIPE THE BULLISH LOOT!" after the breakout
Pullback Entry near the Moving average @0.84850
Buy Limit Orders preferred (15-30min timeframe).
Swing Low/High Pullbacks = Perfect Stealth Entry.
⛔ STOP LOSS (SL): "DON’T GET CAUGHT!"
📍 Thief SL: Recent swing low (4H timeframe) @ 0.84000 (Scalping/Day Trade Basis).
⚠️ Adjust based on your risk, lot size & multiple orders!
🎯 TARGET: 0.85850 (OR ESCAPE EARLY IF HEAT’S ON!)
📢 WHY THIS HEIST? (BULLISH CATALYSTS)
💥 EUR/GBP is BULLISH—backed by:
Fundamentals (COT Report, Macro Data)
Sentiment & Intermarket Trends
Quantitative Edge (Check out for full intel! 👉🌎🔗)
🚨 TRADING ALERT: NEWS = DANGER ZONE!
📉 Avoid New Trades During High-Impact News!
🔒 Use Trailing Stops—Lock profits, evade volatility traps!
💥 BOOST THIS HEIST! (SUPPORT THE MISSION)
🔥 Hit the "LIKE" & "BOOST" button—strengthen our Profit Robbery Squad!
🤑 Daily Market Heists = Easy Money (Thief Trading Style FTW!)
Stay tuned for the next heist plan! 🚀🐱👤💖

EURGBP SHORT – WEEKLY FORECAST Q3 | W29 | Y25💼 EURGBP SHORT – WEEKLY FORECAST
Q3 | W29 | Y25
📊 MARKET STRUCTURE SNAPSHOT
EURGBP is currently reacting from a key higher time frame supply zone, with price action showing weakness at premium levels. Momentum has slowed, and early signs of distribution are appearing. With structure aligning bearishly across multiple timeframes, the pair presents a short bias opportunity.
🔍 Confluences to Watch 📝
✅ Daily Order Block (OB)
Price reacted from a high-probability bearish OB.
Rejection wicks and a shift in candle body control point to supply dominance.
Momentum is fading, confirming the presence of smart money sellers.
✅ 4H Order Block
Clear mitigation of 4H OB followed by an internal break of structure (iBoS).
Price is respecting the OB zone, printing lower highs beneath key supply.
Perfect mid-timeframe confirmation of trend transition.
✅ 1H Order Block
1H structure shifted bearish, validating LTF trend alignment.
Price building supply chain with continued lower highs and bearish engulfing patterns.
Ideal zone for entry on pullback or liquidity sweep.
📈 Risk Management Protocols
🔑 Core Principles:
💰 Max 1% risk per trade
📍 Only execute at pre-identified zones
⏰ Set alerts — avoid impulsive trades
📉 Respect RR — minimum 1:2 per position
🧠 You're not paid for frequency. You're paid for discipline and execution quality.
🧠 Weekly FRGNT Insight
“Trade what the market gives, not what your ego wants.”
Stay mechanical, stay focused, and allow the probabilities to play out. Your job is to control risk — not the outcome.
🏁 Final Thoughts from FRGNT
📌 The structure is clear.
📌 The confluences are stacked.
📌 The bias is confirmed.
Let your execution reflect your discipline, not your emotions.
❤️ Good luck this week, and as always – I’ll see you at the very top.

EURGBP - Follow The Bulls!Hello TradingView Family / Fellow Traders. This is Richard, also known as theSignalyst.
📈EURGBP has been overall bullish trading within the rising channel marked in blue. And it is currently retesting the lower bound of the channel.
Moreover, the orange zone is a strong daily support.
🏹 Thus, the highlighted blue circle is a strong area to look for buy setups as it is the intersection of the lower blue trendline and support.
📚 As per my trading style:
As #EURGBP approaches the blue circle zone, I will be looking for bullish reversal setups (like a double bottom pattern, trendline break , and so on...)
📚 Always follow your trading plan regarding entry, risk management, and trade management.
Good luck!
All Strategies Are Good; If Managed Properly!
~Rich
Disclosure: I am part of Trade Nation's Influencer program and receive a monthly fee for using their TradingView charts in my analysis.

Ready to Raid the Chunnel? EUR/GBP Bullish Strategy Unveiled!🔐💸"The Chunnel Heist: EUR/GBP Bank Job with Thief Trading Style"💸🔐
Master Plan for Smart Money Robbers, Scalpers, and Swing Traders – Chart Ready Strategy to Boost Your TradingView Clout
🌍 Greetings, Global Hustlers & Strategic Traders!
Hola! Ola! Bonjour! Hallo! Marhaba! Ni Hao! Ciao! 👋🌟
Welcome to Thief Trading Style, where we treat the market like a high-stakes heist and every pip is precious loot! 🏦💰
This time, the target is the EUR/GBP Forex Vault – nicknamed "The Chunnel". It’s time to outsmart the system and execute a calculated plan that balances technical setups with a thief’s precision. 🐱👤🔥
🧠 Heist Blueprint: EUR/GBP Bullish Setup
🔍 Concept:
We're spotting a bullish bias with underlying momentum for a breakout heist.
This move is not for the faint-hearted – police traps (resistance zones) and bearish defenders are guarding the top, but our tools (TA + FA) suggest a strong breakout is brewing. ⚠️📊
🚀 Thief Strategy at a Glance:
🟢 Entry (Stealth Mode)
💥 "The vault is wide open – grab the bullish loot!"
Initiate BUY positions on pullbacks, using a layering/DCA style entry system.
📅 Recommended on 15m or 30m charts for precision.
🎯 Key Entry Zone: Recent swing lows/highs – the quieter, unguarded door into the vault.
🛑 Stop Loss (Silent Exit Strategy)
Set SL near the most recent 1D timeframe wick low – smart risk management is key.
Adjust size based on your risk tolerance, lot sizes, and how deep you’ve stacked the entries.
🏁 Target (Escape Route)
🎯 Main Target: 0.88000
But remember – sometimes it’s safer to exit early if things get hot. Use trailing SLs to secure your loot and dodge the heat. 🔥🚓
💸 Scalper Advisory – Quick Snatch & Run
Scalpers should only ride the bullish momentum.
If your wallet's heavy, jump in early. If not, trail the swing traders and plan your entry like a pro.
🛡 Use tight trailing SLs to keep your gains in the bag.
📈 Why the Chunnel Heist Now?
The market is shifting:
🔹 Overbought conditions
🔹 Signs of trend reversal
🔹 Bullish divergence + liquidity grab setups
🔹 Positioning based on COT reports, sentiment analysis, macroeconomic shifts, and intermarket flow
👉 Full FA/TA/COT breakdown liinkedd in the Klick 🔗🔗
📢 Heads-Up: News Alert 🚨
📰 Major news events ahead – stay sharp.
❌ Avoid fresh entries during high-impact announcements.
✅ Use trailing SLs to lock profits and reduce emotional exposure.
❤️ Support the Heist, Boost the Team
🔥 Smash the "Boost" button if you're down with the Thief Trading Style
– it powers our next robbery and keeps the strategy alive!
Each boost strengthens the team and spreads the loot. Let’s out-trade the market, not just survive it. 🚀💰
⚠️ Disclaimer (The Clean Getaway)
📌 This is an educational, entertainment-based strategic overview – not financial advice.
📌 Always do your own due diligence and trade based on your personal risk profile.
📌 Markets shift quickly – adapt, adjust, and don’t marry your trades.
💬 Leave a comment if you’re riding this plan or if you’ve got your eyes on the next target.
🎯 Follow for more Thief Trading Heists – the next plan drops soon!
Stay stealthy, stay profitable. See you at the vault! 🏦🐱👤💸

EURGBP Perfect Channel Up giving one more buy opportunity.Last time we looked at the EURGBP pair (May 30, see chart below) we gave the most timely buy signal right at the bottom (Higher Lows trend-line) of the Bullish Megaphone, and the price is only a few candles away from the 0.87400 Target:
If we look at the price action from a 4H perspective we can see that it is a Channel Up that has been driving the pair upwards since the May 28 bottom and today's rebound is taking place after a direct hit on the 4H MA50 (blue trend-line).
This is the start of the new Bullish Leg. Since the previous two have increased by +1.90%, this rally has the potential to even exceed our 0.87400 Target marginally. Still, this is a perfect bullish set-up.
-------------------------------------------------------------------------------
** Please LIKE 👍, FOLLOW ✅, SHARE 🙌 and COMMENT ✍ if you enjoy this idea! Also share your ideas and charts in the comments section below! This is best way to keep it relevant, support us, keep the content here free and allow the idea to reach as many people as possible. **
-------------------------------------------------------------------------------
Disclosure: I am part of Trade Nation's Influencer program and receive a monthly fee for using their TradingView charts in my analysis.
💸💸💸💸💸💸
👇 👇 👇 👇 👇 👇

EURGBP SHORT DAILY FORECAST Q3 D11 W28 Y25EURGBP SHORT DAILY FORECAST Q3 D11 W28 Y25
It’s Fun Coupon Friday! 💸🔥
Professional Risk Managers👋
Welcome back to another FRGNT chart update📈
Diving into some Forex setups using predominantly higher time frame order blocks alongside confirmation breaks of structure.
Let’s see what price action is telling us today! 👀
💡Here are some trade confluences📝
✅Daily Order block identified
✅4H Order Block identified
✅1H Order Block identified
🔑 Remember, to participate in trading comes always with a degree of risk, therefore as professional risk managers it remains vital that we stick to our risk management plan as well as our trading strategies.
📈The rest, we leave to the balance of probabilities.
💡Fail to plan. Plan to fail.
🏆It has always been that simple.
❤️Good luck with your trading journey, I shall see you at the very top.
🎯Trade consistent, FRGNT X

Bullish bounce off overlap support?EUR/GBP is falling towards the pivot, which has been identified as an overlap support and could bounce to the 1st resistance, which acts as a pullback resistance.
Pivot: 0.8569
1st Support: 0.8538
1st Resistance: 0.8640
Risk Warning:
Trading Forex and CFDs carries a high level of risk to your capital and you should only trade with money you can afford to lose. Trading Forex and CFDs may not be suitable for all investors, so please ensure that you fully understand the risks involved and seek independent advice if necessary.
Disclaimer:
The above opinions given constitute general market commentary, and do not constitute the opinion or advice of IC Markets or any form of personal or investment advice.
Any opinions, news, research, analyses, prices, other information, or links to third-party sites contained on this website are provided on an "as-is" basis, are intended only to be informative, is not an advice nor a recommendation, nor research, or a record of our trading prices, or an offer of, or solicitation for a transaction in any financial instrument and thus should not be treated as such. The information provided does not involve any specific investment objectives, financial situation and needs of any specific person who may receive it. Please be aware, that past performance is not a reliable indicator of future performance and/or results. Past Performance or Forward-looking scenarios based upon the reasonable beliefs of the third-party provider are not a guarantee of future performance. Actual results may differ materially from those anticipated in forward-looking or past performance statements. IC Markets makes no representation or warranty and assumes no liability as to the accuracy or completeness of the information provided, nor any loss arising from any investment based on a recommendation, forecast or any information supplied by any third-party.

EURGBP: Is This The End Of The Bulls? The GBP/USD pair has exhibited a consistent bullish trend, driven by a remarkable price momentum that is unprecedented in recent history. However, we anticipate a potential bearish reversal, as the market is witnessing a confluence of bearish indicators and increasing volume. Historically, the British pound has held a dominant position in this market, and long-term bears are likely to gain control.
Therefore, it is crucial to closely monitor the incoming market volume and, most importantly, the prevailing market sentiment. Your continued support throughout this journey is greatly appreciated. If you wish to encourage us, kindly like and comment on our ideas.
Team Setupsfx_
❤️❤️🚀🚀