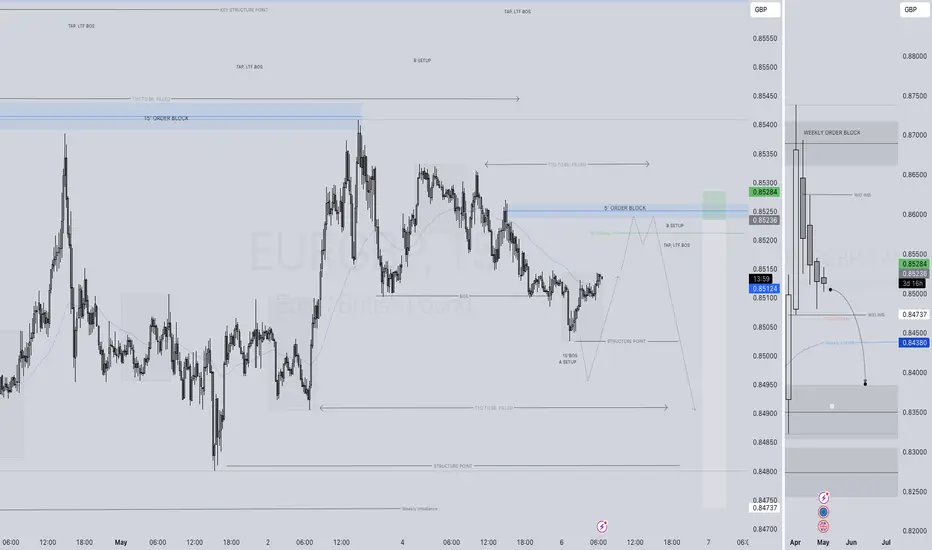
EURGBP SHORT FORECAST Q2 W19 D9 Y25EURGBP SHORT FORECAST Q2 W19 D9 Y25
Professional Risk Managers👋
Welcome back to another FRGNT chart update📈
Diving into some Forex setups using predominantly higher time frame order blocks alongside confirmation breaks of structure.
Let’s see what price action is telling us today!
💡Here are some trade confluences📝
✅Weekly order block
✅15' order block
✅Intraday bearish breaks of structure
✅Tokyo ranges to be filled
🔑 Remember, to participate in trading comes always with a degree of risk, therefore as professional risk managers it remains vital that we stick to our risk management plan as well as our trading strategies.
📈The rest, we leave to the balance of probabilities.
💡Fail to plan. Plan to fail.
🏆It has always been that simple.
❤️Good luck with your trading journey, I shall see you at the very top.
🎯Trade consistent, FRGNT X
Eurgbpanalysis

EURGBP SHORT FORECAST Q2 W19 D7 Y25EURGBP SHORT FORECAST Q2 W19 D7 Y25
Professional Risk Managers👋
Welcome back to another FRGNT chart update📈
Diving into some Forex setups using predominantly higher time frame order blocks alongside confirmation breaks of structure.
Let’s see what price action is telling us today!
💡Here are some trade confluences📝
✅Weekly order block
✅15' order block
✅Intraday bearish breaks of structure
✅Tokyo ranges to be filled
🔑 Remember, to participate in trading comes always with a degree of risk, therefore as professional risk managers it remains vital that we stick to our risk management plan as well as our trading strategies.
📈The rest, we leave to the balance of probabilities.
💡Fail to plan. Plan to fail.
🏆It has always been that simple.
❤️Good luck with your trading journey, I shall see you at the very top.
🎯Trade consistent, FRGNT X

EURGBP SHORT FORECAST Q2 W19 D6 Y25EURGBP SHORT FORECAST Q2 W19 D6 Y25
Professional Risk Managers👋
Welcome back to another FRGNT chart update📈
Diving into some Forex setups using predominantly higher time frame order blocks alongside confirmation breaks of structure.
Let’s see what price action is telling us today!
💡Here are some trade confluences📝
✅Weekly order block
✅15' order block
✅Intraday bearish breaks of structure
✅Tokyo ranges to be filled
🔑 Remember, to participate in trading comes always with a degree of risk, therefore as professional risk managers it remains vital that we stick to our risk management plan as well as our trading strategies.
📈The rest, we leave to the balance of probabilities.
💡Fail to plan. Plan to fail.
🏆It has always been that simple.
❤️Good luck with your trading journey, I shall see you at the very top.
🎯Trade consistent, FRGNT X
EURGBP SHORT FORECAST Q2 W19 D5 Y25EURGBP SHORT FORECAST Q2 W19 D5 Y25
Professional Risk Managers👋
Welcome back to another FRGNT chart update📈
Diving into some Forex setups using predominantly higher time frame order blocks alongside confirmation breaks of structure.
Let’s see what price action is telling us today!
💡Here are some trade confluences📝
✅Weekly order block
✅15' order block
✅Intraday bearish breaks of structure
✅Tokyo ranges to be filled
🔑 Remember, to participate in trading comes always with a degree of risk, therefore as professional risk managers it remains vital that we stick to our risk management plan as well as our trading strategies.
📈The rest, we leave to the balance of probabilities.
💡Fail to plan. Plan to fail.
🏆It has always been that simple.
❤️Good luck with your trading journey, I shall see you at the very top.
🎯Trade consistent, FRGNT X

EURGBP SHORT FORECAST Q2 W18 D1 Y25EURGBP SHORT FORECAST Q2 W18 D1 Y25
Professional Risk Managers👋
Welcome back to another FRGNT chart update📈
Diving into some Forex setups using predominantly higher time frame order blocks alongside confirmation breaks of structure.
Let’s see what price action is telling us today!
💡Here are some trade confluences📝
✅Weekly order block
✅15' order block
✅Intraday bearish breaks of structure
✅Tokyo ranges to be filled
🔑 Remember, to participate in trading comes always with a degree of risk, therefore as professional risk managers it remains vital that we stick to our risk management plan as well as our trading strategies.
📈The rest, we leave to the balance of probabilities.
💡Fail to plan. Plan to fail.
🏆It has always been that simple.
❤️Good luck with your trading journey, I shall see you at the very top.
🎯Trade consistent, FRGNT X

Shorts for EURGBPFX:EURGBP
Previously, we mentioned about the price having potential to react off the daily swap zone after falling from the daily resistance zone. However, price gave us only about 100 pips, before failing and breaking down below the daily swap zone. Since price previously reacted off the high time frame daily resistance zone, the break below of the swap zone signals continuous push towards the downside. Currently, price has reached the demand zone and price has rebounded. This zone may be seen as insignificant because, from the bearish price action, we expect it to eventually break below the demand zone and continue the downtrend towards the daily demand zone.

EURGBP SHORT FORECAST Q2 W18 D30 Y25EURGBP SHORT FORECAST Q2 W18 D30 Y25
Professional Risk Managers👋
Welcome back to another FRGNT chart update📈
Diving into some Forex setups using predominantly higher time frame order blocks alongside confirmation breaks of structure.
Let’s see what price action is telling us today!
💡Here are some trade confluences📝
✅Weekly order block
✅15' order block
✅Intraday bearish breaks of structure
✅Tokyo ranges to be filled
🔑 Remember, to participate in trading comes always with a degree of risk, therefore as professional risk managers it remains vital that we stick to our risk management plan as well as our trading strategies.
📈The rest, we leave to the balance of probabilities.
💡Fail to plan. Plan to fail.
🏆It has always been that simple.
❤️Good luck with your trading journey, I shall see you at the very top.
🎯Trade consistent, FRGNT X

EURGBP Technical Setup: 1:3 R:R Opportunity on RetestAfter the drop to 0.8250 — a level not touched since 2022 — EURGBP rebounded to 0.8450 before starting another decline.
However, the 0.8250 support held firm once again, a higher low follow, and EURGBP eventually broke above 0.8450, confirming a double bottom pattern.
Price acceleration quickly took the pair above 0.8700, and now EURGBP is undergoing a normal correction.
The broken neckline at 0.8450 now acts as clear support.
Traders could look to buy near the 0.8450 retest, using a tight stop below the neckline, and aiming for at least a 1:3 risk-reward ratio.
Disclosure: I am part of Trade Nation's Influencer program and receive a monthly fee for using their TradingView charts in my analyses and educational articles.

EURGBP SHORT FORECAST Q2 W18 D29 Y25EURGBP SHORT FORECAST Q2 W18 D29 Y25
Professional Risk Managers👋
Welcome back to another FRGNT chart update📈
Diving into some Forex setups using predominantly higher time frame order blocks alongside confirmation breaks of structure.
Let’s see what price action is telling us today!
💡Here are some trade confluences📝
✅Weekly order block
✅5' order blockS
✅Intraday bearish breaks of structure
✅Tokyo ranges to be filled
🔑 Remember, to participate in trading comes always with a degree of risk, therefore as professional risk managers it remains vital that we stick to our risk management plan as well as our trading strategies.
📈The rest, we leave to the balance of probabilities.
💡Fail to plan. Plan to fail.
🏆It has always been that simple.
❤️Good luck with your trading journey, I shall see you at the very top.
🎯Trade consistent, FRGNT X

EURGBP SHORT FORECAST Q2 W18 D28 Y25EURGBP SHORT FORECAST Q2 W18 D28 Y25
Professional Risk Managers👋
Welcome back to another FRGNT chart update📈
Diving into some Forex setups using predominantly higher time frame order blocks alongside confirmation breaks of structure.
Let’s see what price action is telling us today!
💡Here are some trade confluences📝
✅Weekly order block
✅4 Hour order block
✅Intraday bearish breaks of structure to be created
✅Tokyo ranges to be filled
🔑 Remember, to participate in trading comes always with a degree of risk, therefore as professional risk managers it remains vital that we stick to our risk management plan as well as our trading strategies.
📈The rest, we leave to the balance of probabilities.
💡Fail to plan. Plan to fail.
🏆It has always been that simple.
❤️Good luck with your trading journey, I shall see you at the very top.
🎯Trade consistent, FRGNT X

EURGBP SHORT FORECAST Q2 W18 Y25EURGBP SHORT FORECAST Q2 W18 Y25
Professional Risk Managers👋
Welcome back to another FRGNT chart update📈
Diving into some Forex setups using predominantly higher time frame order blocks alongside confirmation breaks of structure.
Let’s see what price action is telling us today!
💡Here are some trade confluences📝
✅Weekly order block
✅4 Hour order block
✅Intraday bearish breaks of structure to be created
✅Tokyo ranges to be filled
🔑 Remember, to participate in trading comes always with a degree of risk, therefore as professional risk managers it remains vital that we stick to our risk management plan as well as our trading strategies.
📈The rest, we leave to the balance of probabilities.
💡Fail to plan. Plan to fail.
🏆It has always been that simple.
❤️Good luck with your trading journey, I shall see you at the very top.
🎯Trade consistent, FRGNT X

EURGBP LONG FORECAST Q2 W17 D25 Y25EURGBP LONG FORECAST Q2 W17 D25 Y25
Professional Risk Managers👋
Welcome back to another FRGNT chart update📈
Diving into some Forex setups using predominantly higher time frame order blocks alongside confirmation breaks of structure.
Let’s see what price action is telling us today!
💡Here are some trade confluences📝
✅Weekly imbalance filled
✅Tokyo ranges to be filled
✅4H order block rejection
✅intraday bullish breaks of structure
🔑 Remember, to participate in trading comes always with a degree of risk, therefore as professional risk managers it remains vital that we stick to our risk management plan as well as our trading strategies.
📈The rest, we leave to the balance of probabilities.
💡Fail to plan. Plan to fail.
🏆It has always been that simple.
❤️Good luck with your trading journey, I shall see you at the very top.

EURGBP LONG FORECAST Q2 W17 D23 Y25EURGBP LONG FORECAST Q2 W17 D23 Y25
Professional Risk Managers👋
Welcome back to another FRGNT chart update📈
Diving into some Forex setups using predominantly higher time frame order blocks alongside confirmation breaks of structure.
Let’s see what price action is telling us today!
💡Trade confluences
- 4 hour order block rejection
- 4 hour bullish break of structure
- Intraday breaks of structure
- Tokyo ranges to be filled
NOTE - linked short position is the higher probable setup!!!!!!!!
🔑 Remember, to participate in trading comes always with a degree of risk, therefore as professional risk managers it remains vital that we stick to our risk management plan as well as our trading strategies.
📈The rest, we leave to the balance of probabilities.
💡Fail to plan. Plan to fail.
🏆It has always been that simple.
❤️Good luck with your trading journey, I shall see you at the very top.
🎯Trade consistent, FRGNT X

EURGBP SHORT FORECAST Q2 W17 D3 Y25EURGBP SHORT FORECAST Q2 W17 D23 Y25
Summary
- Weekly Orderblock
- 15' Orderblock
Requirements
- Setup A) Await 15' breaks of structure - Pull back short from created 15' order block
- Setup B) Lowertime frame break of structure via current available 15' order block
- Setup C) Break and retest via 15' order block created upon the break of structure.
🔑 Remember, to participate in trading comes always with a degree of risk, therefore as professional risk managers it remains vital that we stick to our risk management plan as well as our trading strategies.
📈The rest, we leave to the balance of probabilities.
💡Fail to plan. Plan to fail.
🏆It has always been that simple.
❤️Good luck with your trading journey, I shall see you at the very top.
🎯Trade consistent, FRGNT X

EURGBP SHORT FORECAST Q2 W17 D22 Y25EURGBP SHORT FORECAST Q2 W17 D22 Y25
Summary
- Weekly Orderblock
- 15' Orderblock
Requirements
- Setup A) Await 15' breaks of structure - Pull back short from created 15' order block
- Setup B) Lowertime frame break of structure via current available 15' order block
FRGNT X
IG - JCFRGNT

EURGBP SHORT FORECAST Q2 W16 D18 Y25EURGBP SHORT FORECAST Q2 W16 D18 Y25
Fun Coupon Friday !
SUMMARY
- Trading areas identified
- Long position via 4H order block + weekly wick imbalance fill alignment. 15' breaks of structure required prior. 15' order block to be created post 15' break of structure. B set up.
- Short position via weekly order block 15' order block identified.15' breaks of structure required prior & lower time frame break of structure + turn around in price actions. A Set up
FRGNT X

EURGBP potential longsFX:EURGBP
On the past two weeks, price has broken out from the descending channel, signaling a strong bullish momentum and is currently on the pullback towards the daily demand zone which is in about 100 pips. Although we don’t currently have an entry signal, our bias would still be buys, searching for potential long opportunities in the smaller timeframes when we get the confirmations.
The daily demand zone is also sitting around the 'Point of Control' of the volume profile, which essentially is the area with the biggest volume traded when the breakout took place. From here, we can take it as a confluence that the bulls are in power, as well as the 400 pips of movement upwards with two closed strong bullish weekly candles. However, do note that due to the fact that price respected the daily resistance zone above, there is still potential for price to break below the daily demand zone, and if price breaks below and closes, the buys may become invalid.

Market Analysis: EUR/GBP SlipsMarket Analysis: EUR/GBP Slips
EUR/GBP declined and is now consolidating losses above the 0.8500 region.
Important Takeaways for EUR/GBP Analysis Today
- EUR/GBP is trading in a bearish zone below the 0.8630 pivot level.
- There is a connecting bearish trend line forming with resistance near 0.8570 on the hourly chart at FXOpen.
EUR/GBP Technical Analysis
On the hourly chart of EUR/GBP at FXOpen, the pair started a steady decline from well above 0.8700. The Euro traded below the 0.8630 support level against the British Pound.
The EUR/GBP chart suggests that the pair even declined below the 0.8600 level and tested 0.8520. It is now consolidating losses and trading below the 50-hour simple moving average. Recently, there was a minor increase above the 0.8540 level.
The pair is now facing resistance near the 23.6% Fib retracement level of the downward move from the 0.8738 swing high to the 0.8518 low. There is also a connecting bearish trend line forming with resistance near 0.8570.
The next major resistance could be 0.8630 and the 50% Fib retracement level of the downward move from the 0.8738 swing high to the 0.8518 low.
A close above the 0.8630 level might accelerate gains. In the stated case, the bulls may perhaps aim for a test of 0.8685. Any more gains might send the pair toward the 0.8740 level.
Immediate support sits near 0.8520. The next major support is near 0.8500. A downside break below the 0.8500 support might call for more downsides. In the stated case, the pair could drop toward the 0.8360 support level.
This article represents the opinion of the Companies operating under the FXOpen brand only. It is not to be construed as an offer, solicitation, or recommendation with respect to products and services provided by the Companies operating under the FXOpen brand, nor is it to be considered financial advice.

EURGBP BUY/LONGBy utilizing Fibonacci retracement levels, historical patterns, , we can formulate a hypothesis that the market might follow a similar trajectory if bullish sentiment prevails.

EURGBP Short Term Buy Idea Update!!!Hi Traders, on April 10th I shared this idea "EURGBP Short Term Buy Idea"
I expected bullish continuation higher from the marked Fibonacci support zones. You can read the full post using the link above.
Price reached the first key support zone, respected it and bounced higher as expected!!!
If you enjoy this idea, don’t forget to LIKE 👍, FOLLOW ✅, SHARE 🙌, and COMMENT ✍! Drop your thoughts and charts below to keep the discussion going. Your support helps keep this content free and reach more people! 🚀
---------------------------------------------------------------------------------------------------------------------
Disclosure: I am part of Trade Nation's Influencer program and receive a monthly fee for using their TradingView charts in my analysis.

“ EUR/GBP Buy Setup – Demand Zone to the Moon? ”Key Zones & Levels
🟦 Demand Zone:
Between 0.85555 – 0.85200
Buyers previously pushed price up here — now acting as a strong support base!
🎯 Target Point:
0.87406
Potential upside of +179 pips / +2.09%
🟢 Entry Point:
Around 0.85555, just above the demand zone
Ideal spot for a Buy Entry if confirmation shows.
🛑 Stop Loss:
Set at 0.85200
Smart risk protection below the zone.
Indicators
📉 Downtrend Line:
A break above this could signal the start of a bullish Reversal.
📈 EMA (7-period):
Currently around 0.85796
Reclaiming above this line strengthens the buy signal.
Trade Plan Summary
✅ Buy on bounce from demand zone
🔓 Breakout of the trend line = confirmation
🎯 TP: 0.87406
🛡️ SL: 0.85200
⚖️ Risk-to-Reward Ratio: Excellent (about 1:6)
Final Thoughts
Wait for bullish candles near the entry point
Watch fundamentals too — EUR & GBP news could impact direction
Stay alert for false breakouts below the demand zone

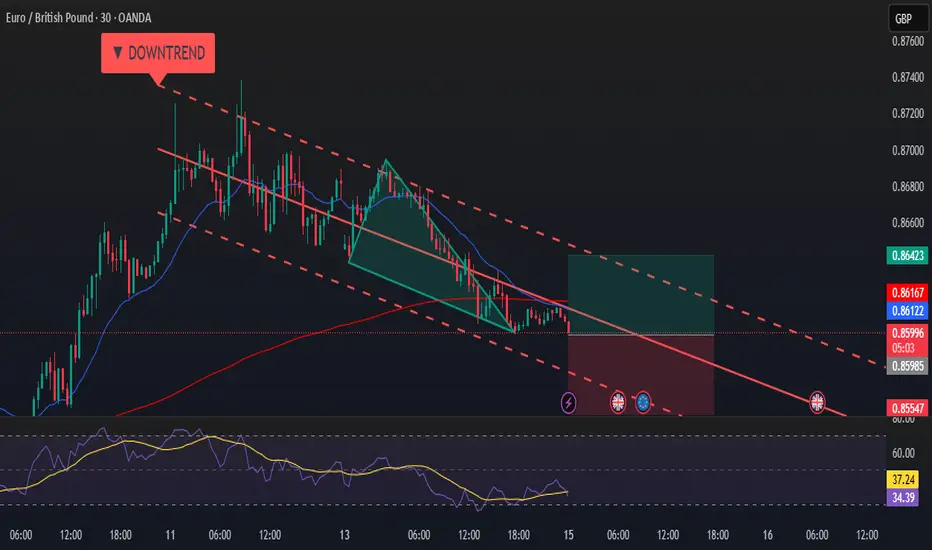
Triangle Breakout Alert – EUR/GBP Ready to Fly!Hi traders! Analyzing EUR/GBP on the 30M timeframe, spotting a potential bullish breakout from a triangle pattern inside a broader downtrend:
🔹 Entry: 0.86008
🔹 Take Profit (TP): 0.86423
🔹 Stop Loss (SL): 0.85547
Price was consolidating inside a descending channel and recently formed a symmetrical triangle pattern. After multiple touches at both trendlines, bullish momentum broke the triangle to the upside, suggesting a possible short-term reversal or corrective move against the prevailing downtrend.
The breakout is supported by a clean candle close above the triangle resistance and a potential retest of the breakout zone. RSI is turning up from the oversold area, signaling a shift in momentum.
If bulls maintain control, we could see a push toward the upper limit of the channel or even a full retracement to 0.86423, where previous structure aligns with dynamic resistance.
⚠️ DISCLAIMER: This is not financial advice. Every trader must evaluate their own risk and strategy.