EURGBP BUY | Day Trading AnalysisHello Traders, here is the full analysis.
Watch Potential bullish reversal levels for BUY. GOOD LUCK! Great BUY opportunity EURGBP
I still did my best and this is the most likely count for me at the moment.
Support the idea with like and follow my profile TO SEE MORE.
Traders, if you liked this idea or if you have your own opinion about it, write in the comments. I will be glad 🤝
Patience is the If You Have Any Question, Feel Free To Ask 🤗
Just follow chart with idea and analysis and when you are ready come in THE GROVE | VIP GROUP, earn more and safe, wait for the signal at the right moment and make money with us💰
Eurgbpbullish

EURGBP BUY | Day Trading AnalysisHello Traders, here is the full analysis.
I think EURGBP will bounce off next support and grab liquidity to rally up to 0.87... zone. GOOD LUCK! Great BUY opportunity EURGBP
I still did my best and this is the most likely count for me at the moment.
Support the idea with like and follow my profile TO SEE MORE.
Traders, if you liked this idea or if you have your own opinion about it, write in the comments. I will be glad 🤝
Patience is the If You Have Any Question, Feel Free To Ask 🤗
Just follow chart with idea and analysis and when you are ready come in THE GROVE | VIP GROUP, earn more and safe, wait for the signal at the right moment and make money with us💰

7 Dimension analysis for EURGBP 🕛 TOPDOWN - Navigating a Sideways Consolidation
Overview: This pair has been trading in a sideways range between 0.9501 and 0.8260 since 2017, establishing a considerable consolidation area. The monthly chart reflects a vast consolidation region, making it one of the most consolidated pairs in forex, lacking a clear direction. On the weekly chart, after forming a valid low, the pair initiates an upward move, seemingly with a short post-breakout buildup.
😇 7 Dimension Analysis
Time Frame: Daily
1️⃣ Swing Structure: Bullish
🟢 Structure Behavior: Break of Structure (BoS)
🟢 Swing Move: Corrective, nearing a valid Point of Interest (POI).
🟢 Inducement: Completed, forming a valid high, with prices approaching a potential buy area. Anticipating the 1st pullback, which might be deep at extreme levels. Internal structure appears bearish with an unmitigated overbought (OB) scenario.
🟢 Support/Resistance Areas: Support, Demand, Accumulation areas are vital, marked with trendlines. Identifying potential buy entries in these zones.
2️⃣ Pattern
🟢 CHART PATTERNS
Reversal
Double bottom formation indicative of a potential reversal.
🟢 CANDLE PATTERNS
Key Observations:
The last candle, a significant bear candle, indicates profit booking by climax players.
Momentum candles reflect strict bearish momentum, but bear in mind that substantial bear candles near support might not have significant implications.
Climax players' activity in the area warrants careful observation.
3️⃣ Volume: High volumes at both the beginning and end, signaling bullish volume. There's a high chance of price reversal or support emergence from these levels.
4️⃣ Momentum RSI:
🟢 Momentum State: In a sideways zone.
🟢 Divergence: Two consecutive bearish divergences indicate active bears, although a bullish divergence is currently forming.
5️⃣ Volatility Bollinger Bands:
🟢 Bands are below the middle band, suggesting a bearish trend. However, a punch from the upside signals strong bearish pressure.
6️⃣ Strength - ROC Values: EUR is stronger than the bears.
✔️ Entry Time Frame: Daily
✅ Entry TF Structure: Bullish
☑️ Current Move: Corrective
✔ Support Base: Previous support area
☑️ Candles Behavior: Climax player activity, record session count with an extreme bearish candle unable to break support.
☑️ Trend Line Breakout: Not yet observed.
☑️ Final Comments: Buy at the support.
💡 Decision: Buy once the price reaches the support area.
🚀 Entry: 0.8670
✋ Stop Loss: 0.8647
🎯 Take Profit: 0.8831
2nd Exit if Internal Structure Changes, 3rd Trendline Breakout, FOMO.
😊 Risk to Reward Ratio: 1:7
🕛 Expected Duration: 30 days
SUMMARY: The analysis focuses on a bullish scenario, given the corrective move and potential support areas. However, cautious optimism is advised, considering bearish momentum and climactic activity. The strategy revolves around waiting for the price to reach a key support level for a buy entry, aligning with the broader bullish outlook.

EURGBP Analysis H1Here is my analysis for EURGBP on H1 using Order Block. The price could go bullish, you can put a pending order on the Order block or find an entry on LTF within OB Zone. Trade Safe!

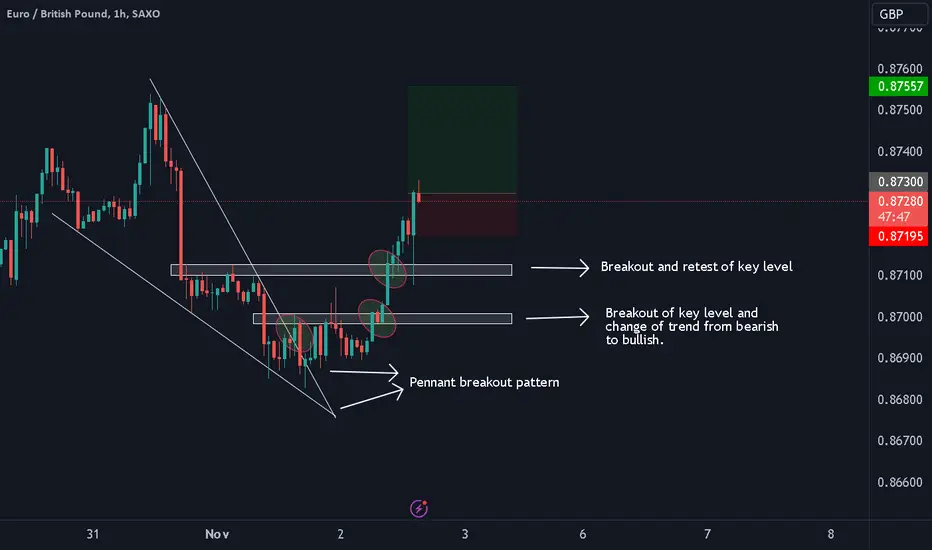
EURGBP Pennant Pattern Breakout We expect further upside on this pair, signalled by the breakout of the pennant pattern. We can also see the formation of a new high and a breakout of two key levels which further supports our directional basis.
EURGBP Analysis H4Here is my analysis for EURGBP on H4 using Order Block. The price could go bullish, you can put a pending order on the Order block or find an entry on LTF within OB Zone. Trade Safe!

EURGBP Short Term Buy IdeaH4 - Bullish trend pattern followed by a double wave correction.
Price respected a strong support zone and bounced higher.
Most recent downtrend line breakout.
H1 - Bullish trend pattern.
Currently it looks like a pullback is happening.
Until the two strong support zones hokd my short term view remains bullish here.

EURGBP WEEKLY ANALYSIS-UPDATE 01/10/2023Anticipating EUR/GBP Decline on Upcoming Euro Weakness
🔍 My analysis points to potential Euro weakness ahead, which could lead to a fall in EUR/GBP. Stay tuned for this evolving market scenario. 📉 #EURGBP #Forex #TradingViewAnalysis 📊📉

EURGBP Long Term Buying Trading IdeaHello Traders
In This Chart Forex ForecastEURGBP DAY By FOREX PLANET
today EURGBP analysis 👆
🟢This Chart includes_ (EURGBP market update)
🟢What is The Next Opportunity on EURGBP Market
🟢how to Enter to the Valid Entry With Assurance Profit
This CHART is For Trader's that Want to Improve Their Technical Analysis Skills and Their Trading By Understanding How To Analyze The Market Using Multiple Timeframes and Understanding The Bigger Picture on the Charts.

EUR-GBP Bearish Breakout!EURGBP broke the support
Cluster of the rising and
Horizontal levels at 0.86717
And the breakout is confirmed
So I think that we will see
A further move down !

EURGBP 04/10 MovePair : EURGBP ( Euro / British Pound )
Description :
Completed Corrective Waves " ABC " in a Corrective Pattern " Rising Wedge " and Impulsive Waves " 1234 " in a Corrective Pattern " Bullish Channel " in Short Time Frame if it Breaks the Lower Trend Line of Bullish Channel / Rising Wedge and Retrace then Sell

EURGBP MID-WEEK ANALYSIS-UPDATE 24/09/2023In the upcoming days, I'll be closely monitoring EUR/GBP with an expectation for a further continuation of the current uptrend, aligning with its recent movements. However, if the prevailing trend were to shift, we would need to consider a bearish scenario instead. Stay tuned for real-time updates as we navigate the evolving market conditions. 📈📉 #EURGBP #Uptrend #BearishScenario

EURGBP Analysis D1Here is my analysis for EURGBP on D1 using Order Block. The price could go bullish, you can put a pending order on the Order block or find an entry on LTF within OB Zone. Trade Safe!

EURGBP I Headed for top of the rangeWelcome back! Let me know your thoughts in the comments!
** EURGBP Analysis - Listen to video!
We recommend that you keep this pair on your watchlist and enter when the entry criteria of your strategy is met.
Please support this idea with a LIKE and COMMENT if you find it useful and Click "Follow" on our profile if you'd like these trade ideas delivered straight to your email in the future.
Thanks for your continued support!

EURGBP 15/09 MovePair : EURGBP ( Euro / British Pound )
Description :
Rejection from the Daily Descending Trendline at Fibonacci Level - 61.80%. It has completed " ABC " Corrective Wave. Bullish Channel as an Corrective Pattern in Short Time Frame and it has Breakout the Lower Trend Line and Completed its Retest

EURGBP 31/08 MovePair : EURGBP ( Euro / British Pound )
Description :
Bullish Channel in Short Time Frame and Rejection from Upper Trend Line or Fibonacci Level - 61.80% , It has Breakout the Lower Trend Line and Completed the Retracement. Impulse and Correction Completed it will make its Impulse Again

EURGBP Analysis H4Here is my analysis for EURGBP on H4 using Order Block. The price could go bullish, you can put a pending order on the Order block or find an entry on LTF within OB Zone. Trade Safe!

EUR GBP SHORT Risk 0.5%
TP1 = 1:2 RR
Disclaimer:
The contents in this Idea are intended for information purpose only and do not constitute investment recommendation or advice. Nor are they used to promote any specific products or services. They serve as an integral part of a case study to demonstrate fundamental concepts in risk management under given market scenarios. A full version of the disclaimer is available in our profile description.

EURGBP - Looking To Buy Pullbacks In The Short TermH4 - Strong bullish momentum.
Higher highs.
No opposite signs.
H1 - Bullish trend pattern.
Until the two strong support zones hold I expect the price to move higher further after pullbacks.

20 Reasons For Buy EURGBP🔆MULTI-TIME FRAME TOP-DOWN ANALYSIS OVERVIEW☀️
1:✨Eagle eye: The overall structure is bullish, but the current phase is corrective. The low has already been confirmed, and an impulsive move with significant volume and valid momentum candles indicates a potential breakout of the narrow range in the bullish direction.
2:📆Monthly: A sideways to bullish market is observed, with a confirmed low. However, this move also seems to have absorbed liquidity on the lower side. The presence of a doji formation at the end of the candle suggests the need for confirmation.
3:📅Weekly: The market is near the lowest level of the move, and the low has already been confirmed. The price action at this level is at a decision point for continuation or reversal. The strong reversal sentiment is indicated, especially by the consecutive inverted hammers this week, along with the gap-up opening.
4:🕛Daily: The recent price action shows more bullish candles compared to bearish candles in terms of size and count. The previous candle before the lowest point experienced significant volume, indicating profit booking. Today's pro-gap suggests overnight developments in this pair, so the closing of today's candle will provide a clear institutional blueprint.
😇7 Dimension analysis
🟢 analysis time frame: Daily
5: 1 Price Structure: Bearish
6: 2 Pattern Candle Chart: Pro-gap and medium strength closing are significant patterns to consider.
7: 3 Volume: Significant volume observed during sell-off or profit booking candles.
8: 4 Momentum UNCONVENTIONAL Rsi: A shift from bearish to sideways momentum is observed, along with a powerful 5-candle bullish divergence.
9: 5 Volatility measure Bollinger bands: The double bottom pattern at the middle band resistance holds significant importance. Waiting for further confirmation after a volatile move and the formation of this pattern suggests a potential short consolidation phase.
10: 6 Strength ADX: A fight between bulls and bears is ongoing, but bears seem to be weakening due to their long-standing battle to maintain their positions. Fresh and ready bulls can potentially take control from here.
11: 7 Sentiment ROC: Sentiment seems to be the only factor going against the price action and other indicators. Therefore, today's closing is crucial, and it is recommended to wait for the closing or filter the analysis in lower time frames.
✔️ Entry Time Frame: H1
12: Entry TF Structure: Bullish
13: Entry Move: Impulsive
14: Support Resistance Base: Extreme order block support
15: FIB: Activated and trendline breakout
☑️ Final comments: Open a buy entry at the breakout.
16: 💡Decision: Buy
17: 🚀Entry: 0.8580
18: ✋Stop Loss: 0.8514
19: 🎯Take Profit: 0.8758
20: 😊Risk to Reward Ratio: 1:3
🕛 Expected Duration: 15 days

EURGBP Bullish Bias!EUR-GBP broke the falling
Resistance line and while
Struggling, still is making
It's way up slowly so I
Think that we will see
A further move up !

#EURGBP- LONG 600 PIPS SETUP!!!Dear Traders, We have good buying opportunity on EURGBP, expecting EUR to be over the long term view and expecting GBP to be bearish over the next couple of months. Price currently in accumulation phase and it will drop to our 'point of interest' before it moves up.
LIKE AND FOLLOW FOR MORE.
Take care and much love!

EURGBP BUYHi fellow traders, EURGBP looks ready for a move higher from the blue box area. The trade will be invalidated if we break the red line. Target the resistance levels. Good luck and trade safe!
