EUR/GBP Thief Trade: Swipe Profits Before Overbought Trap!🦹♂️ EUR/GBP "THE CHUNNEL HEIST" – BULLISH LOOT IN PROGRESS! 🚨💰
(Thief Trading Strategy – Escape Before the Cops Arrive!)
🎯 DEAR MARKET PIRATES & PROFIT SNATCHERS,
Based on our 🔥Thief Trading Style Analysis🔥, we’re executing a bullish heist on EUR/GBP ("The Chunnel"). The vault is wide open—time to swipe the loot before the high-risk resistance police barricade (aka overbought trap) shuts us down!
📜 THE MASTER PLAN:
✔ Entry (📈): "The Bullish Vault is Unlocked!"
Buy Limit Orders (15-30min TF) near recent swing lows/highs.
Thief’s DCA Trick: Layer entries like a pro robber—multiple limit orders for max loot.
✔ Stop Loss (🛑): "Hide Your Stash Wisely!"
SL at nearest 4H candle wick (0.86500)—adjust based on your risk appetite & lot size.
Remember: A good thief always has an escape route!
✔ Target (🎯): 0.88500 (or escape earlier if the cops get suspicious!)
🔎 SCALPERS & SWING BANDITS – LISTEN UP!
Scalpers: Stick to LONG-ONLY heists! Use trailing SL to protect profits.
Swing Thieves: If you’re low on cash, join the slow robbery—DCA & hold!
📡 WHY THIS HEIST IS HOT:
Bullish momentum in play (but BEWARE of overbought traps!).
Fundamental Drivers: Check COT Reports, Macro Data, & Sentiment.
🚨 TRADING ALERT: NEWS = POLICE RAID RISK!
Avoid new trades during high-impact news.
Trailing SL = Your Getaway Car! Lock profits before volatility strikes.
💥 BOOST THIS HEIST – STRENGTHEN THE GANG!
👉 Smash the LIKE & BOOST button to fuel our next market robbery!
👉 Follow for more heists—profit awaits! 🚀💰
🦹♂️ Stay Sharp, Stay Ruthless… See You on the Next Heist!
Eurgbplong

EURGBP Bullish Flag Pattern!
HI,Traders !
EURGBP is trading in an
Uptrend and made a bullish
Breakout out of bullish flag
Pattern so we are
Bullish biased and we
Will be expecting a
Further bullish move up !
Comment and subscribe to help us grow !

EURGBP – Waiting for the Market to Come to UsWe are patiently waiting for price to correct
and reach our level.
📌 If the price touches the level and gives us a valid signal,
we will buy.
📉 But if the level is broken, we don't panic —
we simply wait for a pullback and enter a short position.
🧠 No guessing, no stress.
We let the market come to us, and then we react — according to plan.

Ready to Raid the Chunnel? EUR/GBP Bullish Strategy Unveiled!🔥🤑 "THE CHUNNEL HEIST: EUR/GBP BULLISH LOOTING SEASON!" 🏴☠️💸
🌟 Greetings, Market Pirates & Profit Bandits! 🌟
(Hi! Hola! Ola! Bonjour! Hallo! Marhaba!)
Based on the 🚨THIEF TRADING STYLE🚨 (a ruthless mix of technical & fundamental analysis), we’re plotting a major heist on EUR/GBP "The Chunnel"—time to LOOT THE BULLS!
🚨 HEIST BLUEPRINT (LONG ENTRY) 🚨
🎯 Escape Zone: High-risk RED MA Zone (Overbought? Reversal? Trap? Bears lurking? Cops are waiting!).
🏆 Take Profit & Run! You’ve earned it, outlaw! 💰🔥
🔓 ENTRY: "VAULT IS OPEN—SWIPE THE BULLISH LOOT!" after the breakout
Pullback Entry near the Moving average @0.84850
Buy Limit Orders preferred (15-30min timeframe).
Swing Low/High Pullbacks = Perfect Stealth Entry.
⛔ STOP LOSS (SL): "DON’T GET CAUGHT!"
📍 Thief SL: Recent swing low (4H timeframe) @ 0.84000 (Scalping/Day Trade Basis).
⚠️ Adjust based on your risk, lot size & multiple orders!
🎯 TARGET: 0.85850 (OR ESCAPE EARLY IF HEAT’S ON!)
📢 WHY THIS HEIST? (BULLISH CATALYSTS)
💥 EUR/GBP is BULLISH—backed by:
Fundamentals (COT Report, Macro Data)
Sentiment & Intermarket Trends
Quantitative Edge (Check out for full intel! 👉🌎🔗)
🚨 TRADING ALERT: NEWS = DANGER ZONE!
📉 Avoid New Trades During High-Impact News!
🔒 Use Trailing Stops—Lock profits, evade volatility traps!
💥 BOOST THIS HEIST! (SUPPORT THE MISSION)
🔥 Hit the "LIKE" & "BOOST" button—strengthen our Profit Robbery Squad!
🤑 Daily Market Heists = Easy Money (Thief Trading Style FTW!)
Stay tuned for the next heist plan! 🚀🐱👤💖

Ready to Raid the Chunnel? EUR/GBP Bullish Strategy Unveiled!🔐💸"The Chunnel Heist: EUR/GBP Bank Job with Thief Trading Style"💸🔐
Master Plan for Smart Money Robbers, Scalpers, and Swing Traders – Chart Ready Strategy to Boost Your TradingView Clout
🌍 Greetings, Global Hustlers & Strategic Traders!
Hola! Ola! Bonjour! Hallo! Marhaba! Ni Hao! Ciao! 👋🌟
Welcome to Thief Trading Style, where we treat the market like a high-stakes heist and every pip is precious loot! 🏦💰
This time, the target is the EUR/GBP Forex Vault – nicknamed "The Chunnel". It’s time to outsmart the system and execute a calculated plan that balances technical setups with a thief’s precision. 🐱👤🔥
🧠 Heist Blueprint: EUR/GBP Bullish Setup
🔍 Concept:
We're spotting a bullish bias with underlying momentum for a breakout heist.
This move is not for the faint-hearted – police traps (resistance zones) and bearish defenders are guarding the top, but our tools (TA + FA) suggest a strong breakout is brewing. ⚠️📊
🚀 Thief Strategy at a Glance:
🟢 Entry (Stealth Mode)
💥 "The vault is wide open – grab the bullish loot!"
Initiate BUY positions on pullbacks, using a layering/DCA style entry system.
📅 Recommended on 15m or 30m charts for precision.
🎯 Key Entry Zone: Recent swing lows/highs – the quieter, unguarded door into the vault.
🛑 Stop Loss (Silent Exit Strategy)
Set SL near the most recent 1D timeframe wick low – smart risk management is key.
Adjust size based on your risk tolerance, lot sizes, and how deep you’ve stacked the entries.
🏁 Target (Escape Route)
🎯 Main Target: 0.88000
But remember – sometimes it’s safer to exit early if things get hot. Use trailing SLs to secure your loot and dodge the heat. 🔥🚓
💸 Scalper Advisory – Quick Snatch & Run
Scalpers should only ride the bullish momentum.
If your wallet's heavy, jump in early. If not, trail the swing traders and plan your entry like a pro.
🛡 Use tight trailing SLs to keep your gains in the bag.
📈 Why the Chunnel Heist Now?
The market is shifting:
🔹 Overbought conditions
🔹 Signs of trend reversal
🔹 Bullish divergence + liquidity grab setups
🔹 Positioning based on COT reports, sentiment analysis, macroeconomic shifts, and intermarket flow
👉 Full FA/TA/COT breakdown liinkedd in the Klick 🔗🔗
📢 Heads-Up: News Alert 🚨
📰 Major news events ahead – stay sharp.
❌ Avoid fresh entries during high-impact announcements.
✅ Use trailing SLs to lock profits and reduce emotional exposure.
❤️ Support the Heist, Boost the Team
🔥 Smash the "Boost" button if you're down with the Thief Trading Style
– it powers our next robbery and keeps the strategy alive!
Each boost strengthens the team and spreads the loot. Let’s out-trade the market, not just survive it. 🚀💰
⚠️ Disclaimer (The Clean Getaway)
📌 This is an educational, entertainment-based strategic overview – not financial advice.
📌 Always do your own due diligence and trade based on your personal risk profile.
📌 Markets shift quickly – adapt, adjust, and don’t marry your trades.
💬 Leave a comment if you’re riding this plan or if you’ve got your eyes on the next target.
🎯 Follow for more Thief Trading Heists – the next plan drops soon!
Stay stealthy, stay profitable. See you at the vault! 🏦🐱👤💸

EURGBP LONG Market still in strong bullish momentum and a third touch on bullish trendline. Price printed a strong bullish confirmation. Expecting price to reach at least 0.86699 resistance level.

EURGBP - Expecting Bullish Continuation In The Short TermH4 - We have a clean bullish trend with the price creating a series of higher highs, higher lows structure.
This strong bullish momentum is followed by a pullback.
No opposite signs.
Until the two Fibonacci support zones hold I expect the price to move higher further.
If you enjoy this idea, don’t forget to LIKE 👍, FOLLOW ✅, SHARE 🙌, and COMMENT ✍! Drop your thoughts and charts below to keep the discussion going. Your support helps keep this content free and reach more people! 🚀
--------------------------------------------------------------------------------------------------------------------

EURGBP Growth Ahead!
HI,Traders !
#EURGBP is trading along the
Rising support and is already
Making a bullish rebound so
AsTo the strong uptrend we
Will be expecting a further
Bullish move up on pair !
Comment and subscribe to help us grow !

EURGBP possible long for 0.8675 even highereurgbp weekly chart formed double bottom. eurgbp retraced back to 0.8356 and hold the previous HL (higher low)0.8317, weekly key reversal bar formed , made a new low closed on the high. indication for long for coming days and weeks. stop loss below 0.8317, target 0.8675.

EURGBP forex rallying as expected off weekly demand levelWeekly uptrend. Weekly demand imbalance at 0.83 is still in control and trying to play out as expected. Any swing long positions should be managed. I hope you could take advantage of long positions using the smaller timeframes for those intraday and short-term forex traders.

Falling Wedge - Bullish Reversal - Bullish DivergenceOANDA:EURGBP has formed and broken out of a falling wedge, which is considered a bullish reversal pattern. Pattern has formed after price found support at the support trend line and broke the lower highs in the retracement!
I am expecting bullish momentum in the coming days!

EURGBP – transitioning from bearish to bullish .. week of 02 JunIt appears that the bearish move that began in April may have ended now. Price that mostly stayed under the 50ema has crossed over to the other side. The downward trendline has also been broken with price moving above it. We already have a higher high and higher low in place. Aggressive traders can take a long now, but I want to be more conservative these days. I would like to see:
a break above the recent swing high (0.8459).
another sequence of HL and HH.
and a retest of the minor resistance/support at 0.8459.
Even with all these precautions, we can still get a +2.3R trade. If PA continues to develop as per my analysis, I will monitor on lower time frames to find more confluence and bullish evidence before committing to a trade. My initial target will be the region just before the swing high at 0.8623.
This is not a trade recommendation; it’s merely my own analysis. Trading carries a high level of risk so carefully managing your capital and risk is important. If you like my idea, please give a “boost” and follow me to get even more.

EURGBP forex swing trade playing out off weekly demand levelThe EURGBP forex swing trade playing out off weekly demand level as expected. I hope you are taking advantage of this investment opportunity. There is a lot of profit for margin for this Forex cross pair.

Why EUR vs GBP Could Be Your Best Trade This Week!When it comes to forex swing trading or even forex intraday trading, the temptation to zoom into lower timeframes—like the 15-minute or 1-hour charts—is strong. Most forex traders focus on short-term momentum, often diving into scalping strategies that chase quick pips. However, the real edge lies where most don’t look: the higher timeframes, particularly the weekly chart. The EUR/GBP forex pair is a perfect example of these higher timeframes' power, especially when paired with smart money concepts like demand and supply imbalances.
EUR/GBP: A Hidden Gem for Forex Swing Traders
The EUR/GBP Forex cross pair is often overlooked compared to major USD-based pairs. However, for seasoned swing traders and institutional players, EUR/GBP offers deep liquidity, cleaner technical analysis and price action structures, and strong reaction zones that are respected time and time again.
At the end of May 2025, a significant weekly demand imbalance at 0.8384 finally took control of price action—something smart money traders had been anticipating for months. This wasn't a surprise for those watching the higher timeframes. Similar to how the previous weekly imbalance at 0.8299 took control in February 2025, these zones have proven critical in guiding the medium- to long-term direction of EUR/GBP.

EUR/GBP - Blue Box is Strong SupportIn our recent EUR / GBP analysis we observed a substantial 226‑pip decline from the peak.() Price has now settled into the blue‑boxed support area, a level at which previous pullbacks found buyers and genuine value emerged.
It follows, then, that if price can break above the nearby red‑boxed resistance on lower‑time‑frame charts, with clear follow‑through rather than a fleeting spike, a long position would be entirely reasonable. Such a breakout would signal that demand has overcome supply pressure, restoring the upward trend in a disciplined, verifiable way.
Throughout our work, we have never relied on guesswork or emotion. Every level is chosen through careful study of price behavior and hard data, and our methodology has consistently delivered high accuracy as a result. In the spirit of prudent analysis, we ask only for confirmation of these key levels before committing capital, an approach that has served us well and should serve our followers equally.
📌I keep my charts clean and simple because I believe clarity leads to better decisions.
📌My approach is built on years of experience and a solid track record. I don’t claim to know it all but I’m confident in my ability to spot high-probability setups.
📌If you would like to learn how to use the heatmap, cumulative volume delta and volume footprint techniques that I use below to determine very accurate demand regions, you can send me a private message. I help anyone who wants it completely free of charge.
🔑I have a long list of my proven technique below:
🎯 ZENUSDT.P: Patience & Profitability | %230 Reaction from the Sniper Entry
🐶 DOGEUSDT.P: Next Move
🎨 RENDERUSDT.P: Opportunity of the Month
💎 ETHUSDT.P: Where to Retrace
🟢 BNBUSDT.P: Potential Surge
📊 BTC Dominance: Reaction Zone
🌊 WAVESUSDT.P: Demand Zone Potential
🟣 UNIUSDT.P: Long-Term Trade
🔵 XRPUSDT.P: Entry Zones
🔗 LINKUSDT.P: Follow The River
📈 BTCUSDT.P: Two Key Demand Zones
🟩 POLUSDT: Bullish Momentum
🌟 PENDLEUSDT.P: Where Opportunity Meets Precision
🔥 BTCUSDT.P: Liquidation of Highly Leveraged Longs
🌊 SOLUSDT.P: SOL's Dip - Your Opportunity
🐸 1000PEPEUSDT.P: Prime Bounce Zone Unlocked
🚀 ETHUSDT.P: Set to Explode - Don't Miss This Game Changer
🤖 IQUSDT: Smart Plan
⚡️ PONDUSDT: A Trade Not Taken Is Better Than a Losing One
💼 STMXUSDT: 2 Buying Areas
🐢 TURBOUSDT: Buy Zones and Buyer Presence
🌍 ICPUSDT.P: Massive Upside Potential | Check the Trade Update For Seeing Results
🟠 IDEXUSDT: Spot Buy Area | %26 Profit if You Trade with MSB
📌 USUALUSDT: Buyers Are Active + %70 Profit in Total
🌟 FORTHUSDT: Sniper Entry +%26 Reaction
🐳 QKCUSDT: Sniper Entry +%57 Reaction
📊 BTC.D: Retest of Key Area Highly Likely
📊 XNOUSDT %80 Reaction with a Simple Blue Box!
📊 BELUSDT Amazing %120 Reaction!
📊 Simple Red Box, Extraordinary Results
I stopped adding to the list because it's kinda tiring to add 5-10 charts in every move but you can check my profile and see that it goes on..

EURGBP Analysis: Two Daily POIsHello traders!
EURGBP is offering two trading scenarios on the daily timeframe.
The first scenario suggests the pair may react bullishly from the next zone, setting up a bounce opportunity that could drive price higher toward the 0.84400 area.
The second scenario anticipates a bounce toward the 0.83800 area, where a mean reversion setup may come into play (if buyers step in and price action confirms bullish intent near that support).
Discretionary Trading: Where Experience Becomes the Edge
Discretionary trading is all about making decisions based on what you see, what you feel, and what you've learned through experience. Unlike systematic strategies that rely on fixed rules or algorithms, discretionary traders use their judgment to read the market in real time. It's a skill that can't be rushed, because it's built on screen time, pattern recognition, and the ability to stay calm under pressure.
There's no shortcut here. You need to see enough market conditions, wins, and losses to build that intuition—the kind that tells you when to pull the trigger or sit on your hands. Charts might look the same, but context changes everything, and that's something only experience can teach you.
At the end of the day, discretionary trading is an art, refined over time, sharpened through mistakes, and driven by instinct. It's not for everyone, but for those who've put in the work, it can be a powerful way to trade.

EURGBP SHORT FORECAST Q2 W20 D13 Y25EURGBP SHORT FORECAST Q2 W20 D13 Y25
Professional Risk Managers👋
Welcome back to another FRGNT chart update📈
Diving into some Forex setups using predominantly higher time frame order blocks alongside confirmation breaks of structure.
Let’s see what price action is telling us today!
💡Here are some trade confluences📝
✅Weekly order block
✅15' order block
✅Intraday bearish breaks of structure
✅Tokyo ranges to be filled
🔑 Remember, to participate in trading comes always with a degree of risk, therefore as professional risk managers it remains vital that we stick to our risk management plan as well as our trading strategies.
📈The rest, we leave to the balance of probabilities.
💡Fail to plan. Plan to fail.
🏆It has always been that simple.
❤️Good luck with your trading journey, I shall see you at the very top.
🎯Trade consistent, FRGNT X

EUR/GBP Breakout and Fibonacci Retest: Bullish Setup in PlayEUR/GBP has broken its strong weekly bearish trendline and the last lower high. The previously observed bullish divergence was hinting at this bullish momentum. Currently, the pair is testing the golden ratio of the Fibonacci retracement. A buy position can be considered at this level, targeting the recent highs.

EURGBP LONG FORECAST Q2 W17 D25 Y25EURGBP LONG FORECAST Q2 W17 D25 Y25
Professional Risk Managers👋
Welcome back to another FRGNT chart update📈
Diving into some Forex setups using predominantly higher time frame order blocks alongside confirmation breaks of structure.
Let’s see what price action is telling us today!
💡Here are some trade confluences📝
✅Weekly imbalance filled
✅Tokyo ranges to be filled
✅4H order block rejection
✅intraday bullish breaks of structure
🔑 Remember, to participate in trading comes always with a degree of risk, therefore as professional risk managers it remains vital that we stick to our risk management plan as well as our trading strategies.
📈The rest, we leave to the balance of probabilities.
💡Fail to plan. Plan to fail.
🏆It has always been that simple.
❤️Good luck with your trading journey, I shall see you at the very top.

EURGBP LONG FORECAST Q2 W17 D23 Y25EURGBP LONG FORECAST Q2 W17 D23 Y25
Professional Risk Managers👋
Welcome back to another FRGNT chart update📈
Diving into some Forex setups using predominantly higher time frame order blocks alongside confirmation breaks of structure.
Let’s see what price action is telling us today!
💡Trade confluences
- 4 hour order block rejection
- 4 hour bullish break of structure
- Intraday breaks of structure
- Tokyo ranges to be filled
NOTE - linked short position is the higher probable setup!!!!!!!!
🔑 Remember, to participate in trading comes always with a degree of risk, therefore as professional risk managers it remains vital that we stick to our risk management plan as well as our trading strategies.
📈The rest, we leave to the balance of probabilities.
💡Fail to plan. Plan to fail.
🏆It has always been that simple.
❤️Good luck with your trading journey, I shall see you at the very top.
🎯Trade consistent, FRGNT X

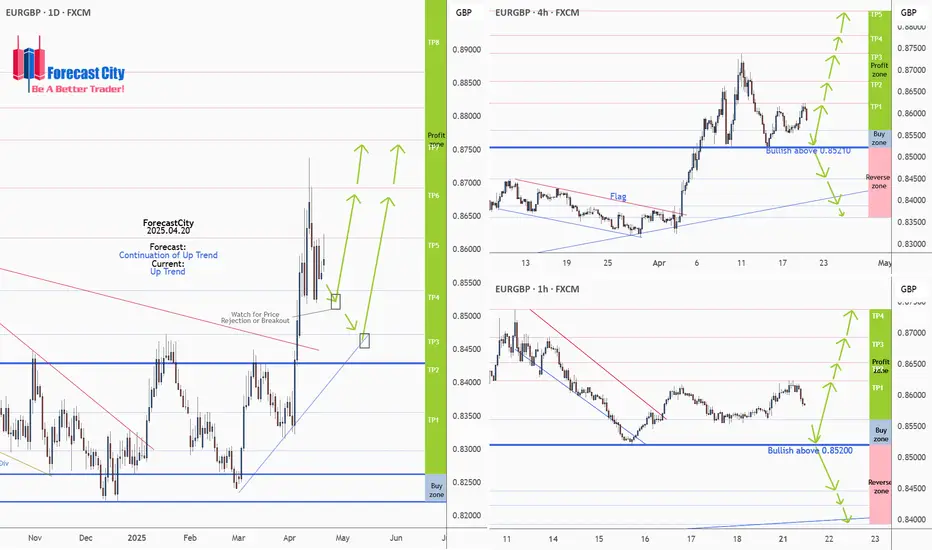
EURGBP Daily, H4,H1 Forecasts, Technical Analysis & Trading IdeaMidterm forecast:
0.84290 is a major support, while this level is not broken, the Midterm wave will be uptrend.
We will close our open trades, if the Midterm level 0.84290 is broken.
OANDA:EURGBP
Technical analysis:
A trough is formed in daily chart at 0.83220 on 04/03/2025, so more gains to resistance(s) 0.86175, 0.86923, 0.87647 and more heights is expected.
__________________________________________________________________
❤️ If you find this helpful and want more FREE forecasts in TradingView,
. . . . . . . . Hit the 'BOOST' button 👍
. . . . . . . . . . . Drop some feedback in the comments below! (e.g., What did you find most useful? How can we improve?)
🙏 Your support is appreciated!
Now, it's your turn!
Be sure to leave a comment; let us know how you see this opportunity and forecast.
Have a successful week,
ForecastCity Support Team
EURGBP potential longsFX:EURGBP
On the past two weeks, price has broken out from the descending channel, signaling a strong bullish momentum and is currently on the pullback towards the daily demand zone which is in about 100 pips. Although we don’t currently have an entry signal, our bias would still be buys, searching for potential long opportunities in the smaller timeframes when we get the confirmations.
The daily demand zone is also sitting around the 'Point of Control' of the volume profile, which essentially is the area with the biggest volume traded when the breakout took place. From here, we can take it as a confluence that the bulls are in power, as well as the 400 pips of movement upwards with two closed strong bullish weekly candles. However, do note that due to the fact that price respected the daily resistance zone above, there is still potential for price to break below the daily demand zone, and if price breaks below and closes, the buys may become invalid.

EURGBP BUY/LONGBy utilizing Fibonacci retracement levels, historical patterns, , we can formulate a hypothesis that the market might follow a similar trajectory if bullish sentiment prevails.
