EURGBP Possible BUY opportunity - D1 Daily ChartDear Investors,
we spotted a bullish SHS in EURGBP
We´ll open two positions.
First:
Entry: 0.9000
Second, if it drops further at:
Enttry: 0.8953
SL: 0.8871
Hello Worthy
Decide. Commit. Succeed.
"Trading doesn't just reveal your character, it also builds it if you stay in the game long enough.”- Hello Worthy
I wish you success!
Please support the setup with your likes, comments and by following on Tradingview thanks.
Eurgbptrend

EURGBP - UPDATE - MORE DOWNSIDE COMINGWATCH THIS PAIR CLOSELY
MAJOR MOVES COMING. ALSO MAKE SURE YOUR STOP LOSS IS ALWAYS ON.
SUPPORT THE MOVEMENT WITH YOUR LIKES, COMMENTS AND FOLLOW FOR MORE

EURGBP at key reversal area - possible shortEURGBP price action is getting narrowed around a key area - momentum on all across the board is weakening, i am expecting this market to be testing the uptrend line over the coming sessions, keep watching this market for a short trade.
Trade Safe!


EURGBP - CATCH THIS COMING BREAK OUTWITH SOME IMPORTANT NEWS DROPPING THIS WEEK MAKE SURE YOU ARE WOKE :) ON EURGBP THIS WEEK. YOU MIGHT CATCH A NICE SELL
LIKE, COMMENT AND FOLLOW

EURGBP formed double topRespected followers, as we can see on Weekly chart, EURGBP has made Double Top which indicate us for bearish market.


EUR/GBP - Resistance not broken on 4H Chart Resistance level of 0.89200 not broken, possible short to 0.88300
Goodluck trading and let me know what you guys think about EUR/GBP!


EURGBP - THIS WEEK UPDATEEURGBP Continued where it stopped last week
and has been dropping. expecting a reversal soon
before we continue the drop
SUPPORT THE MOVEMENT WITH YOUR LIKES,
COMMENTS AND FOLLOW FOR MORE

EURJPY bullish speculationexpecting a bullish turn here, we might extend all the way to 127.8 before turning. any 4hr candle that breaks below 128 and closes there, invalidates this idea.

EURGBP bearish speculationExpecting a trend reversal either somewhere around here or after we break the minor resistance at around 0.895.

EURGBP -- TIME FOR A BREATHER -AFTER THE DROPI REALLY HOPE YOU GUYS CAUGHT SOME OF THE DROP. I MUST SAY IT HIT TAKE PROFFIT AROUND 70% OF THE DROP BUT ITS ALL GOOD. WE CANT HAVE IT ALL :)
EURGBP DROPPED A LOT MORE THAN I EXPECTED
NOW I AM EXPECTING SOME CONSOLIDATION.
THIS SHOULD REVERSE TO SOME RESISTANCE
BEFORE CONTINUATION DOWN
SUPPORT THE MOVEMENT WITH YOUR LIKES,
COMMENTS AND FOLLOW FOR MORE

EURGBP SELL - CONTINUATION FROM YESTERDAYEURGBP IS LOOKING GOOD FOR A SELL
GOOD RISK 2 REWARD ALSO
HOPE A FEW OF YOU GOT THAT DROP I SENT OUT
See previous analysis
I APPRECIATE ALL LIKES, COMMENTS AND FOLLOW FOR MORE


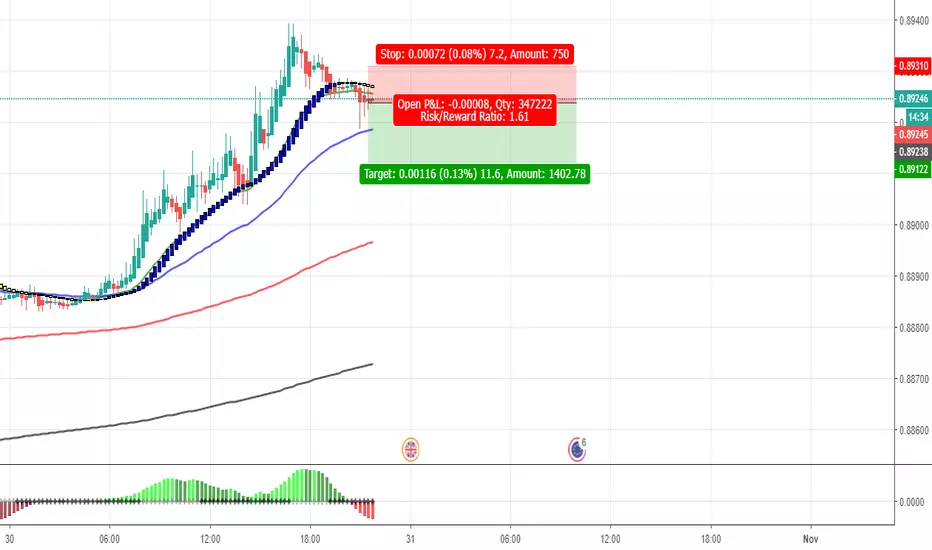
EURGBP Quick selljust a quick sell, even tho the moving avarages telling that i shouldnt sell because its a trend lets try catch quick 20pips
EURGBP TRADE IDEAEURGBP IS IN AN UPTREND AND CURRENTLY WE WANT TO SEE A PULLBACK AND A CONTINUATION OF THE UPTREND
