EURGBP -- SELL NOW - COMING WEEK UPDATEEURGBP has retraced to Fibonacci retracement
level of 0.382 as previously surmised.
Also Stoch RSI is going into overbought territory.
Be ready to jump in for a sell if you are not in already
See previous analysis
PLEASE LIKE, COMMENTS AND FOLLOW FOR MORE
Eurgbptrend

EURGBP - IMPORTANT POINT COMING THIS WEEKi am expecting this going down
what do you think?
like comment and follow :)
SEE PREVIOUS CHATS


EURGBP Short Pullback and Go new High...EURGBP Short Pullback and Go new High keep watch and trade safe...
Trade manageable lot size and use trail stop to protect your profits from 10 Pips

Intraday Trade-EURGBP BuyWhy Buy-
1) Weekly Trend Is UP
2) Price taken support from Short Term Trendline
3) Price has taken multiple support from 200 days EMA
4) Weekly Candle is Bullish Engulfing

EURGBP to touch the IMAGINARY trend-line. Good SHORT POINT!EURGBP to touch the small downwards trend-line and then reverse back down for short term. It is expected to get back up and cross afterwards. Like the idea for the update!

EURGBP Potential Long Entry50 MA above 200 MA, signalling bullish momentum
We have had 2 pullbacks to what I call 'value areas' where it is a good area to enter long. Currently it is developing a third pullback into a 'value area' which I think would be a good area to go long from.
Target around 0.90140
Stop 0.89100
Good luck!


EUR/GBP Technical AnalysisThe day chart of EUR/GBP pair is currently in a descending channel formation.
The pair was in a long rectangle pattern formation(sideways) and then broken.
But it immediately faces the trendline of downchannel and so it is possible for the pair to exert selling pressure in this price zone.
If sideways breakout becomes a fakeout, then a good downward move is possible.


Chunneling up!-The EURGBP 0.20% yearly candle is green having crossed above the yearly open.
-It crossed above the 50% mark of the old range.
-It's poking above a key S/R level .
-The RSI reads bullish (>50) as it breaks above resistance while still having plenty of room to move to the upside before hitting the over bought range.
-All of this occurs as EURGBP 0.20% breaks out of a falling wedge giving us a measured move target (T2) of ~0.917 IF we make it past the first target (T1) of ~0.903 at the top of the old range.

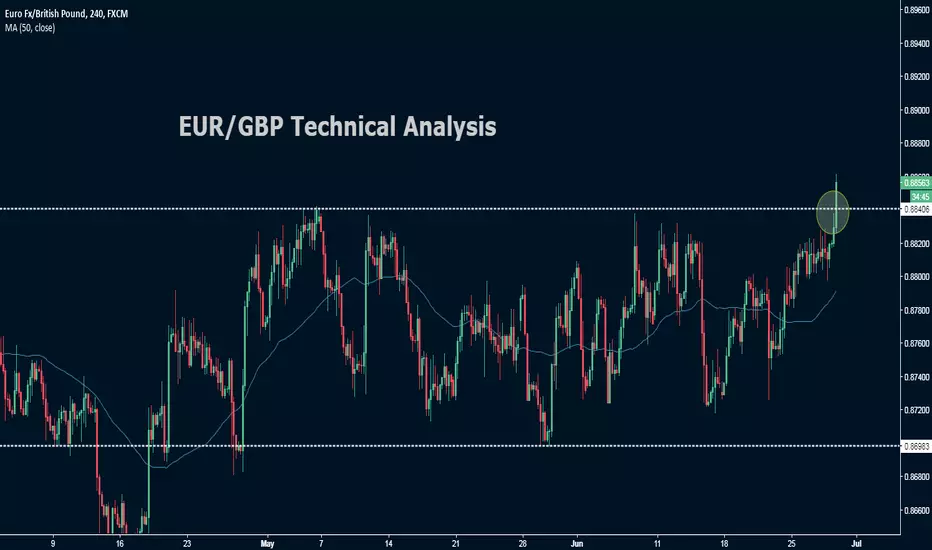
EUR/GBP Technical AnalysisThe 4-hour chart of EUR/GBP was in the sideways trend.
It was in the price range between 0.86983 to 0.88406 .
The price action indicates that it has given a bullish breakout from the sideways pattern.
We expect the bulls to take control over the counter if it sustains above the price range of 0.88406.
EUR/GBP Sell Trend PossibilityIt seems EUR/GBP is hovering around it's bearish channel resistance. It's best time to sell until price @ 0.87300

EURGBP Buy TradeConfusion Confusion Confusion: This Pair Is Sending Mixed Reactions At The Moment But If We Close Around/Above 8787 Levels (On The 2h TF) Then It Would Be A Perfect Buy. A nice SL will be around 8769 Levels

Short Term Eurgbpsell setup eurgbp 0.8745
target 0.8600
stop 0.8800
Please Click "LIKE"&"COMMENT" if you find this analysis usefull

EURGBP, Correction extends into complex modeLooks like we are getting a complex correction for EURGBP. (Smells like we just completed an X wave) Expecting a Y wave. Shall see what plays out thereafter.
Ultimately, we are looking for a move downwards after this complex correction finishes.

sell order eurbp intradaywas formired down cycle elliota
i think open sell order with stop loss 0.87800

EURGBP Short Trade PosibilityEURGBP : A perfect trade for trend continuation. Hoping for a bigger drop in the coming days. Trade carefully tho, have your SL's in place.
SL: 0:872 Levels TP: 0:8647 (Perfect Trade Lol) Levels

EURGBPIf you see in D1 chart we have Bullish pinbar on main support level.
very good opportunity to buy for more then 500+ pips.
Good Luck :)

EUR/GBP Bearish Channel BreakoutEUR/GBP Breakout's it's bearish channel short term bearish setup. Now there is a good Opportunity to go Long term buy until price @ 0.89200
