EURJPY bearish pattern ??EUR/JPY Technical Analysis:
- Current Pattern: Rising Wedge
- Implication: Bearish (Potential Price Decline)
- Expected Target: 0.382 Fibonacci Retracement Level
Eurjpy!

EUR/JPY|HTF Analysis| Friday, 10 May 2024EUR/JPY
-supply above the price + IMB look for confirmations if you are gonna enter

The fifth wave remains (in the bullish scenario).Esteemed analysts and traders,
I hope this correspondence finds you in good health and high spirits, prepared to tackle the upcoming week with renewed energy. I extend my best wishes for your continued success in all your business endeavors. It is worth noting that success in trading is largely dependent on the consistent definition and adherence to one's own rules.
As a supporter of the Elliott Wave Principle, I consider this methodology an invaluable tool for market analysis. After three years of personal experience, I have developed my approach by combining this principle with meticulous consideration of different market scenarios. I strive to avoid market surprises by maintaining a range of market prospects, which enables me to recognize the market structure forming with 100% accuracy.
I am pleased to share my analysis with you, with the caveat that I do not provide buy or sell signals. My perspective on idea analysis is entirely impartial, and if my analysis meets your standards, it may serve as a guide to making an informed decision.
For your reference and comparison, I have attached my previous analysis of the same market. All the details of my analysis are clearly labeled for ease of comprehension. Nonetheless, familiarity with the Elliott Wave Principle theory would facilitate an understanding of the analytical idea.
My study of the Elliott Wave Principle took nearly three years, during which my understanding and experience with this invaluable tool have grown. My progress thus far is a testament to the legacy of Ralph Nelson Eliot, whose genius has provided the foundation for my achievements. May he rest in peace.
I express my gratitude for your continued support and kindness, and welcome your comments and critiques.
May my analysis be a valuable asset to your business journey, and I remain sincerely yours,
Mr. Nobody

EURJPY Massive Short! SELL!
My dear followers,
This is my opinion on the EURJPY next move:
The asset is approaching an important pivot point 167.64
Bias - Bearish
Technical Indicators: Supper Trend generates a clear short signal while Pivot Point HL is currently determining the overall Bearish trend of the market.
Goal - 165.91
About Used Indicators:
For more efficient signals, super-trend is used in combination with other indicators like Pivot Points.
———————————
WISH YOU ALL LUCK

EURJPY: Time For Pullback?! 🇪🇺🇯🇵
EURJPY may retrace from a key daily horizontal resistance.
The market looks quite overbought after quite an extended bullish movement.
A cup & handle formation on an hourly time frame indicates a local strength
of the sellers.
I expect a retracement at least to 166.76 support.
❤️Please, support my work with like, thank you!❤️

EURJPY to turnaround?EURJPY - 24h expiry
Although the bulls are in control, the stalling positive momentum indicates a turnaround is possible.
This is negative for short term sentiment and we look to set shorts at good risk/reward levels for a further correction lower.
The hourly chart technicals suggests further upside before the downtrend returns.
Preferred trade is to sell into rallies.
Although the anticipated move lower is corrective, it does offer ample risk/reward today.
Our profit targets will be 165.50 and 165.20
We look to Sell at 167.40 (stop at 168.10)
Resistance: 168.95 / 171.20 / 175.50
Support: 164.30 / 161.90 / 160.00
Risk Disclaimer
The trade ideas beyond this page are for informational purposes only and do not constitute investment advice or a solicitation to trade. This information is provided by Signal Centre, a third-party unaffiliated with OANDA, and is intended for general circulation only. OANDA does not guarantee the accuracy of this information and assumes no responsibilities for the information provided by the third party. The information does not take into account the specific investment objectives, financial situation, or particular needs of any particular person. You should take into account your specific investment objectives, financial situation, and particular needs before making a commitment to trade, including seeking advice from an independent financial adviser regarding the suitability of the investment, under a separate engagement, as you deem fit.
You accept that you assume all risks in independently viewing the contents and selecting a chosen strategy.
Where the research is distributed in Singapore to a person who is not an Accredited Investor, Expert Investor or an Institutional Investor, Oanda Asia Pacific Pte Ltd (“OAP“) accepts legal responsibility for the contents of the report to such persons only to the extent required by law. Singapore customers should contact OAP at 6579 8289 for matters arising from, or in connection with, the information/research distributed.

Sell Signal Approaching or Is a New Highs On The Way?Last week, there were fireworks across all JPY pairs, with each hitting multi-decade highs. Notably, EURJPY reached an all-time high, peaking at 171.5 before experiencing a sharp drop due to two rounds of intervention by the Bank of Japan (BOJ).
So, what’s next for this pair? This week, it’s been slowly creeping back toward the zone where the second round of intervention occurred last week, between 167 and 168.(see image below)
On the 4-hour chart, a similar sell pattern seems to be emerging. After the first intervention, the price slowly crept back up to the intervention zone before dropping again (second round of intervention).
You can see on this 4-hour chart how the price is inching back toward the 167 level. It dropped 300 pips from there on Friday. Above that, the price dropped heavily from 168.5, so will this pattern repeat, or will we see a return to 170 or above?
In the short term, I see a potential sell setup between 167.5 and 168.5. I'll be using my TRFX indicator on the 1-hour chart to find the right signals for a sell as we approach this zone.
I'll keep a tight stop-loss above 169.7, with a primary target at last week's low of 164, a good short-term goal.
In the longer term, we might see a retest of 171.5 before another significant sell-off. However, the JPY remains quite weak, making it tough to predict the long-term outlook. It's best to see if the price steadies at these levels over the coming weeks or if volatility spikes again, causing another crash.
For now, I'm favoring a short-term sell setup if the right signals appear.

Could EUR/JPY reverse from here?The price is rising toward a resistance level, which serves as a pullback resistance that aligns with the 61.8% Fibonacci retracement; it could reverse from this level toward our take profit.
Entry: 167.15
Why we like it:
There is a pullback resistance level which aligns with the 61.8% Fibonacci retracement.
Stop loss: 168.62
Why we like it:
There is a pullback resistance level.
Take profit: 164.05
Why we like it:
There is a pullback support level.
Please be advised that the information presented on TradingView is provided to Vantage (‘Vantage Global Limited’, ‘we’) by a third-party provider (‘Everest Fortune Group’). Please be reminded that you are solely responsible for the trading decisions on your account. There is a very high degree of risk involved in trading. Any information and/or content is intended entirely for research, educational and informational purposes only and does not constitute investment or consultation advice or investment strategy. The information is not tailored to the investment needs of any specific person and therefore does not involve a consideration of any of the investment objectives, financial situation or needs of any viewer that may receive it. Kindly also note that past performance is not a reliable indicator of future results. Actual results may differ materially from those anticipated in forward-looking or past performance statements. We assume no liability as to the accuracy or completeness of any of the information and/or content provided herein and the Company cannot be held responsible for any omission, mistake nor for any loss or damage including without limitation to any loss of profit which may arise from reliance on any information supplied by Everest Fortune Group.

Eurjpy Potential Sell setup 400pipsSo the view of this downside move is based on USDJPY analysis which we talked about how the interest rate differential, Similar pattern behavior of USDJPY as the government sell bonds to buy back their currency yen!! so we are looking at the same theory at play
This is the video I talked about USDJPY similar pattern
So we could see price retrace to 61.8% fib or in between 50%-61.8% so have a eye on that yellow zone for confirmation of sell setup to downside
Risk management is very good!! with decent ROI
Follow for more forex analysis

Eur/jpy Wonderful trade 150pips Closed!!Based on what i was looking on usdjpy , I saw all the yen pair retracing as we reference UJ as a liquidity pair that set the direction of other pairs of yen. so we got into yen as explained on the weekend. hope everyone enjoyed the breakdown!!
Thank you . please follow for more forex analysis

EURJPY Set To Grow! BUY!
My dear followers,
This is my opinion on the EURJPY next move:
The asset is approaching an important pivot point 164.62
Bias - Bullish
Technical Indicators: Supper Trend generates a clear long ) signal while Pivot Point HL is currently determining the overall Bullish trend of the market.
Goal - 166.50
About Used Indicators:
For more efficient signals, super-trend is used in combination with other indicators like Pivot Points.
———————————
WISH YOU ALL LUCK

EURJPY Buy IdeaOANDA:EURJPY is in overall bullish trend, forming a strong ascending trendline. Recently, after a strong bullish move, It has been retracing towards discounted fibonacci levels. It might continue its bullish momentum from these levels after trendline retest where we can look for long opportunities.

EURJPY BANK BULLISH SIDE ROBBERY PLANMy Dear Robbers / Traders,
This is our master plan to Heist Bullish side of EUR/JPY Bank based on Thief Trading style Technical Analysis.. kindly please follow the plan I have mentioned with target in the chart focus on Long entry, Our target is Red Zone that is High risk Dangerous area market is overbought / Consolidation / Trend Reversal at the level Bearish Robbers / Traders gain the strength. Be safe and be careful and Be rich.
Loot and escape on the target 🎯
support our robbery plan we can make money & take money 💰💵 Join your hands with US. Loot Everything in this market everyday.

EURJPY-4H-BEARISH CONTINUATIONHere is a details analysis of EURJPY:
EUR (Euro):
1. Scorecard: Bullish sentiment, indicating an expectation for an increase in value.
2. COT-FLIP: Bearish sentiment, suggesting a potential decrease.
3. Seasonal Analysis: Bearish outlook, implying a likelihood of a decrease.
4. Fundamentals (LEI, ENDO, EXO): All bullish, indicating positive economic factors that could contribute to an increase in value.
JPY (Japanese Yen):
1. Scorecard: Bullish sentiment, indicating an expectation for an increase in value.
2. COT-FLIP: Bullish sentiment, suggesting a potential increase.
3. Seasonal Analysis: Bullish outlook, implying a likelihood of an increase.
4. Fundamentals (LEI, ENDO, EXO): All bullish, indicating positive economic factors that could contribute to an increase in value.
EURJPY Pair:
1. Scorecard: Bearish sentiment, suggesting a decrease in value.
2. COT-FLIP: Bearish sentiment, indicating a potential decrease.
3. Seasonal Analysis: Bearish outlook, implying a likelihood of a decrease.
4. Fundamentals (LEI, ENDO, EXO): Bullish, indicating positive economic factors, but the overall sentiment is still bearish due to other factors.
5. Technical Analysis:
Trend: Bearish, indicating a downward trajectory in the market.
No specific diversions, continuation patterns, reversal patterns, or harmonics were identified.
Overall Assessment:
The EUR is expected to increase in value based on various indicators, including bullish sentiment and positive fundamentals.
The JPY is also anticipated to increase in value due to similar bullish indicators.
However, the EURJPY pair is likely to decrease overall, despite bullish fundamentals for both currencies individually, mainly due to bearish sentiment reflected in the scorecard and other factors such as technical analysis indicating a bearish trend.
This comprehensive analysis considers multiple factors to provide a detailed theoretical outlook for the EUR, JPY, and the EURJPY pair for the first week of May

EUR/JPY Bearish Scalping Robbery PlanMy Dear Robbers / Traders,
This is our master plan to Heist Bearish side of EUR/JPY based on Thief Trading style Technical Analysis.. kindly please follow the plan i have mentioned with target in the chart focus on Short entry, Our target is Green Zone that is High risk Dangerous area market is overbought / Consolidation / Trend change / Strong Pullback happens at the level Bear Robbers / Traders gain the strength. Be safe and be careful and Be rich. when market break the dynamic support it will continue to go down down. Loot and escape at the target🎯.
support our robbery plan we can make money & take money 💰💵 Join your hands with US. Loot Everything in this market everyday.

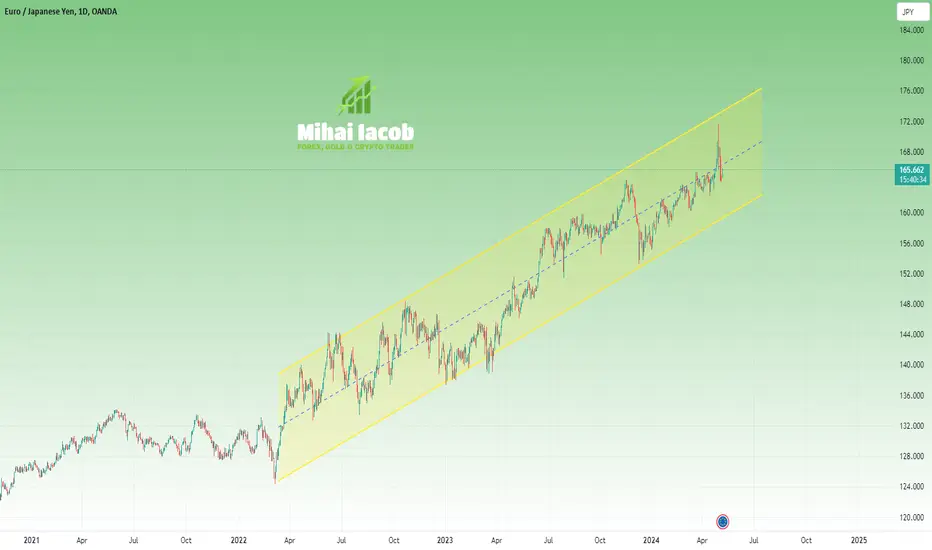
EurJpy- Test of 170 once more?
For over two years, OANDA:EURJPY has been experiencing an upward trend. The pair is ascending within a clearly defined rising channel.
Despite a drop at the end of last year, triggered by JPY repatriation, the overall trend remained intact, and EURJPY resumed its upward trajectory at the beginning of this year.
The end of April saw the pair reach a new all-time high, followed by a rapid and aggressive decline induced by the BoJ intervention.
Currently, 164 stands as a strong floor. As long as this level holds, further gains towards 170 can be anticipated.
EUR/JPY: Possible Reversal after Retest Bearish Order BlockFollowing its ascent to the 171.500 area, the EUR/JPY underwent a notable surge, echoing the analogous movement witnessed in the USD/JPY pair. In light of this development, our approach entails anticipating a potential retracement of the preceding bearish momentum, employing limit orders to capitalize on favorable entry points. Simultaneously, we remain vigilant for indications of a pronounced reversal, particularly in alignment with the prevailing direction of the Point of Control (POC) Volume.
It's noteworthy to highlight the robust correlation between the USD/JPY and EUR/JPY pairs, which underscores our overarching perspective on anticipating a bearish impulse in both currency pairs. This correlation serves as a significant factor in shaping our strategic outlook, as we assess market dynamics and formulate our trading strategy.
In essence, our analysis indicates an inclination towards a cautious stance, with a focus on potential opportunities for a reversal in the EUR/JPY, while keeping a close eye on broader market trends and correlations with the USD/JPY pair. This comprehensive approach aims to optimize trading decisions and capitalize on favorable market conditions as they unfold. Lastly the Stochastic indicator shows a possible correction as the the value is in overbought condition.

Eur/jpyI will look all the yen pair based on my analysis on usdjpy.
As USD/JPY has higher interest differential compared to eur/jpy ,so it would follow similar pattern.
this is the usd/jpy analysis
So I think there is an opportunity to get into the countertrend setup to the level of resistance before we analyze for short!!
Follow me for another Setup

EUR-JPY Will Grow! Buy!
Hello,Traders!
EUR-JPY retested the
Rising support line and
Is already making a
Bullish rebound so
As we are bullish biased
We will be expecting a
Further move up
Buy!
Like, comment and subscribe to help us grow!
Check out other forecasts below too!

Strifor || EURUSD-Week StartingPreferred direction: BUY
Comment: At the beginning of the new week, the euro remains on the buy list, especially if we are talking about the prospect of 1-3 days (before the Fed meeting on Wednesday). This event, as well as the NFP , forces one to be as flexible as possible and be prepared for changes in trading plans at the beginning of this week. Nevertheless, growth is still more likely, but unfortunately, the targets are not as promising as last week. This week, as part of the growth, targets above 1.08000 are not yet being considered. If the dollar's weakness is demonstrated, one can count on growth towards 1.09000 , where there is a large liquidity zone.
Two scenarios are considered, where the more likely scenario №1 says about growth near the level of 1.07225 (breakout trade). A less likely scenario №2 is about the strengthening of the US dollar on Wednesday, within which we can expect a fall to the level of 1.06500 . But since technically there is still a possibility of growth to 1.08000 , then in the event of this fall, we can consider going long again according to scenario №2 .
Additional comments on this trade will be provided as situation changes. Follow us!
Thank you for like and share your views!

What's the NEXT? EURJPYHello, friends!
This is ESS team.
EURJPY is ready for the next wave after a strong rally.
Let's check what next happens.
This is the EURJPY 4H chart.
After breaking through the short bearish extended wave,
the chart is currently being drawn in the bullish extended wave.
After reaching 618 with the Fibonacci retracement, the 4H orderblock zone flips to convert resistance to support, the candle make consolidation and prepares to draw the next wave.
If it break out the RED short-term trend line and then is supported the zone or the short-term trend line and rise, it is likely to rise up within the extended wave for some time.
On the contrary, If candle is resisted at RED short-term trend line and breaks down the zone, There is a possibility that it may fall to the bottom of the wave.

Long EURJPY - 3 May 2024Am expecting EJ buys if we break above previous 1 hr high.
apply proper risk management!!!

Strifor || USDJPY-02/05/2024Preferred direction: SELL
Comment: The dollar is expected to fall even when paired with the Japanese yen . By the way, our previous trading idea worked out perfectly, and the target was fixed at the level of 153.222 . At the moment, another approach to this level is expected, with a high probability of its breakdown downward. The trade is short-term, and one can count on such a movement within 1-2 days . The two most likely scenarios for this trading idea are depicted in the chart.
Additional comments on this trade will be provided as situation changes. Follow us!
Thank you for like and share your views!
