EURJPY MASSIVE RISE for the next few weeks. BUY below 170EURJPY has seen some rosy seasons the past 5 years. Every year it keeps grinding up to reach new highs, from 115 in 2020 to reach a parabolic high last year at 175 on June 2024.
Then, as with any parabolic era, hibernation comes after that peak tap at 175 that lasted 9 months. Price has woken up this year starting on April -- then charging up more this month. This consistent weekly gains is hinting of a bigger shift that only comes every 1-2 years.
From our diagram above you can observe the last big ascend from its big shifts. This shifts resurfaced every 1-2 years. And this quarter 2 we got another rare change in structure conveying a weighty rise ahead in the next 12 months moving forward.
EURJPY corrected heavily back to 1.0 FIB LEVELS, the most discounted bargain zone you can imagine -- so buyers converging on this area is a no brainer.
STRONG BUY at this levels -- below 170 is a definite bargain.
The price growth from the last few weeks is a testament of the directional context EJ is about to undertake.
Expect some greener seasons on this pair as it moves forward.
Harvest will be generous.
Spotted at 168.0
Interim target at 171
Mid/Long term target at 200.
TRADE SAFELY always. Market is Market.
Not financial advice. TAYOR.
Eurjpy!

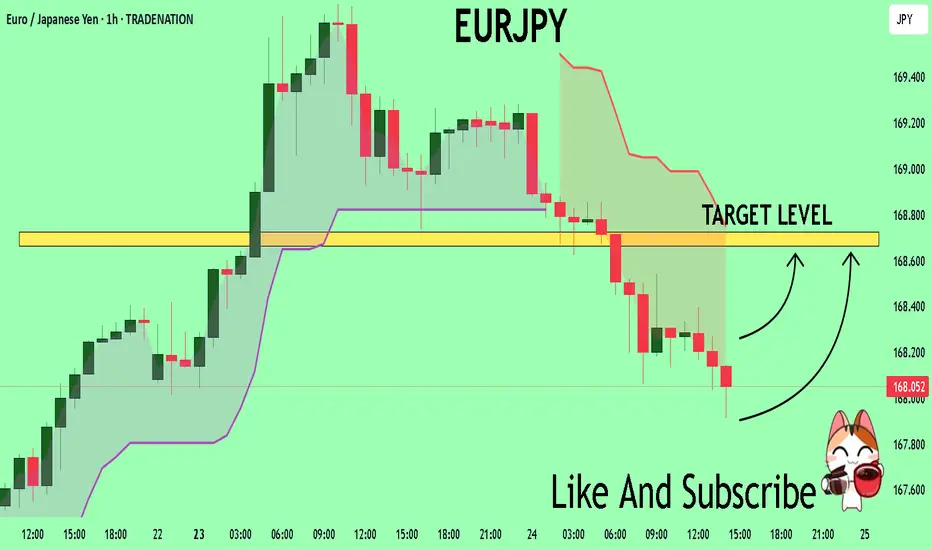
EUR/JPY BEARS WILL DOMINATE THE MARKET|SHORT
EUR/JPY SIGNAL
Trade Direction: short
Entry Level: 169.041
Target Level: 165.789
Stop Loss: 171.204
RISK PROFILE
Risk level: medium
Suggested risk: 1%
Timeframe: 9h
Disclosure: I am part of Trade Nation's Influencer program and receive a monthly fee for using their TradingView charts in my analysis.
LIKE AND COMMENT MY IDEAS

EURJPY : m30 (Short Position)By analyzing the 30-minute time frame and observing liquidity at the lows, I have a bearish scenario from 169.10 down to 168.20

EURJPY SHORT FORECAST Q2 W26 D26 Y25EURJPY SHORT FORECAST Q2 W26 D26 Y25
Professional Risk Managers👋
Welcome back to another FRGNT chart update📈
Diving into some Forex setups using predominantly higher time frame order blocks alongside confirmation breaks of structure.
Let’s see what price action is telling us today! 👀
💡Here are some trade confluences📝
✅Weekly Order Block Identified
✅Daily Order block identified
✅4H Order Block identified
✅15' Order block identified
🔑 Remember, to participate in trading comes always with a degree of risk, therefore as professional risk managers it remains vital that we stick to our risk management plan as well as our trading strategies.
📈The rest, we leave to the balance of probabilities.
💡Fail to plan. Plan to fail.
🏆It has always been that simple.
❤️Good luck with your trading journey, I shall see you at the very top.
🎯Trade consistent, FRGNT X

EURJPY Will Explode! BUY!
My dear friends,
My technical analysis for EURJPY is below:
The market is trading on 168.01 pivot level.
Bias - Bullish
Technical Indicators: Both Super Trend & Pivot HL indicate a highly probable Bullish continuation.
Target - 168.66
About Used Indicators:
A pivot point is a technical analysis indicator, or calculations, used to determine the overall trend of the market over different time frames.
Disclosure: I am part of Trade Nation's Influencer program and receive a monthly fee for using their TradingView charts in my analysis.
———————————
WISH YOU ALL LUCK
EURJPY: A Big Move In Making, Please Share Your Views! Date: 22/06/2025
Hello everyone,
I hope you’re all having a good weekend. As we previously discussed, we expected a sharp decline in Europe/JPY, but unfortunately, it didn’t work out in our favour due to the extremely bullish US dollar. This led to the crossing and invalidation of our two selling zones.
Looking at next week’s price projection, we can confirm that the price is heading towards 170.50 and may be selling at this level. Therefore, we will be keeping a stop loss at 171.50.
Once the trade is activated, we can set our target at 166.0, 163.50, and the final target will be placed at 158.50.
If you like our work, please like our idea.
Good luck and trade safely next week.

EURJPY Long Opportunity EURJPY currently has bullish market directionality and is on a retracement. price is trading above the 50 SMA and we can observe bullish momentum from the RSI trading above the 55 level.
Potentially break and retest zone at 167,550. Awaiting a reaction to this level which could see the bullish trend resuming.

EURJPY Setup Alert!
We’re waiting for the price to reach our marked level.
No emotional trades — let the setup come to you! ⏳
Levels are shown on the chart.
Follow us here: forexCSP

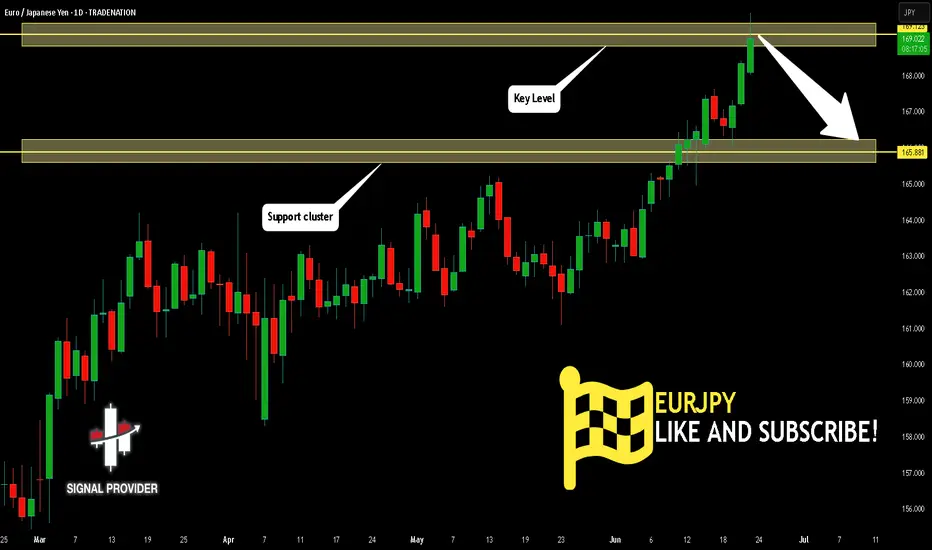
EURJPY Will Fall! Short!
Here is our detailed technical review for EURJPY.
Time Frame: 1D
Current Trend: Bearish
Sentiment: Overbought (based on 7-period RSI)
Forecast: Bearish
The market is trading around a solid horizontal structure 169.123.
The above observations make me that the market will inevitably achieve 165.881 level.
P.S
Please, note that an oversold/overbought condition can last for a long time, and therefore being oversold/overbought doesn't mean a price rally will come soon, or at all.
Disclosure: I am part of Trade Nation's Influencer program and receive a monthly fee for using their TradingView charts in my analysis.
Like and subscribe and comment my ideas if you enjoy them!
EURJPY Is Going Up! Long!
Please, check our technical outlook for EURJPY.
Time Frame: 4h
Current Trend: Bullish
Sentiment: Oversold (based on 7-period RSI)
Forecast: Bullish
The price is testing a key support 166.677.
Current market trend & oversold RSI makes me think that buyers will push the price. I will anticipate a bullish movement at least to 167.654 level.
P.S
The term oversold refers to a condition where an asset has traded lower in price and has the potential for a price bounce.
Overbought refers to market scenarios where the instrument is traded considerably higher than its fair value. Overvaluation is caused by market sentiments when there is positive news.
Disclosure: I am part of Trade Nation's Influencer program and receive a monthly fee for using their TradingView charts in my analysis.
Like and subscribe and comment my ideas if you enjoy them!

EURJPY Just Broke Out – Is This the Start of a Summer Rally?📊 1. COT Report – Euro & Yen
EUR (Euro FX – CME):
Non-Commercials:
Long: +5,968 | Short: -4,293 → Net Long increasing
Commercials:
Long: +11,480 | Short: +24,451 → Net Short
→ Speculators are clearly bullish on the euro.
JPY (Japanese Yen – CME):
Non-Commercials:
Long: -5,319 | Short: +1,235 → Net Long decreasing
Commercials:
Long: +31,893 | Short: +25,462 → Hedging, but still net short
→ The yen continues to be sold, especially by institutional players.
📌 EUR/JPY COT Summary:
Speculators are buying EUR and selling JPY → strong bullish bias on EUR/JPY.
🧠 2. Retail Sentiment
80% of retail traders are short EUR/JPY, with an average entry at 161.50
Current price is around 167.20 → retail is heavily underwater
✅ Strong contrarian bullish signal
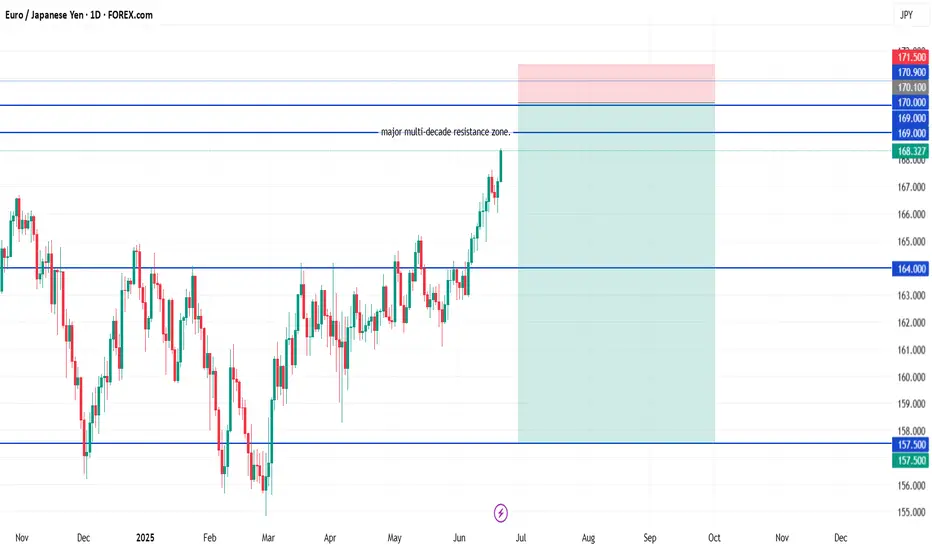
📉 3. Technical Analysis
Price broke out of a long-term range, printing new yearly highs
RSI is overbought but with no active bearish divergence
Price sits inside a major supply zone between 166.50 and 168.00, where previous rejections occurred
A potential pullback to the 164.60–164.15 area aligns with ascending trendline support
🟡 Likely Scenario:
A healthy technical pullback to 164.50–165.00 to cool off RSI,
followed by a continuation higher if supported by momentum and COT positioning
📅 4. Seasonality
June is historically a bullish month for EUR/JPY:
5-year avg: +1.167%
2-year avg: +2.41%
→ Seasonality supports more upside into early July
🌍 5. Macro Context
BoJ remains dovish, no sign of imminent tightening
ECB is steady but relatively less dovish → rate differential still favors the euro
No signs yet of verbal intervention from Japan.

EUR-JPY Bullish Breakout! Buy!
Hello,Traders!
EUR-JPY is trading in an
Uptrend and the pair made
A strong bullish breakout
Of the key horizontal level
Of 168.000 and the breakout
Is confirmed so we will be
Expecting a further bullish
Move up on Monday
Buy!
Comment and subscribe to help us grow!
Check out other forecasts below too!
Disclosure: I am part of Trade Nation's Influencer program and receive a monthly fee for using their TradingView charts in my analysis.

EUR/JPY Short✅ EUR/JPY Swing Short Setup (Multi-Entry)
🎯 Entries:
Entry 1: 169.00 (light position)
Entry 2: 170.10 (core entry)
Entry 3: 170.90 (final top entry)
🛡️ Stop Loss (Unified):
171.50
Placed above the entire resistance zone and previous all-time wick highs, allowing for normal trap behavior without overexposure.
🎯 Take Profits:
TP1: 164.00
TP2: 157.50
You can scale out partially at TP1 or run the full position to TP2 depending on how momentum builds.
#EURJPY: Major Swing Sell +1100 Pips, One Not To Miss! The Japanese Yen (JPY) is most likely to continue its bullish trend, as the Dollar Index (DXY) is expected to decline due to the ongoing conflict between Israel and Iran. Historically, JPY and CHF, alongside gold and silver, have been favoured by global investors and remain bullish. Strong fundamentals and technical support further support our analysis.
The 167-169 price region remains a critical point for sellers, where we anticipate significant selling volume. There are two entry points to consider: one near the current price and another slightly further away. Please monitor volume and use smaller time frames for entries.
Our Swing Target is at 154, but you can also target smaller zones once the trade is activated. For instance, set take-profit levels at 164, 160, and finally, at 154.
To encourage and support us, you can like the idea, comment on it, or share it.
Team Setupsfx_
❤️❤️🚀🚀

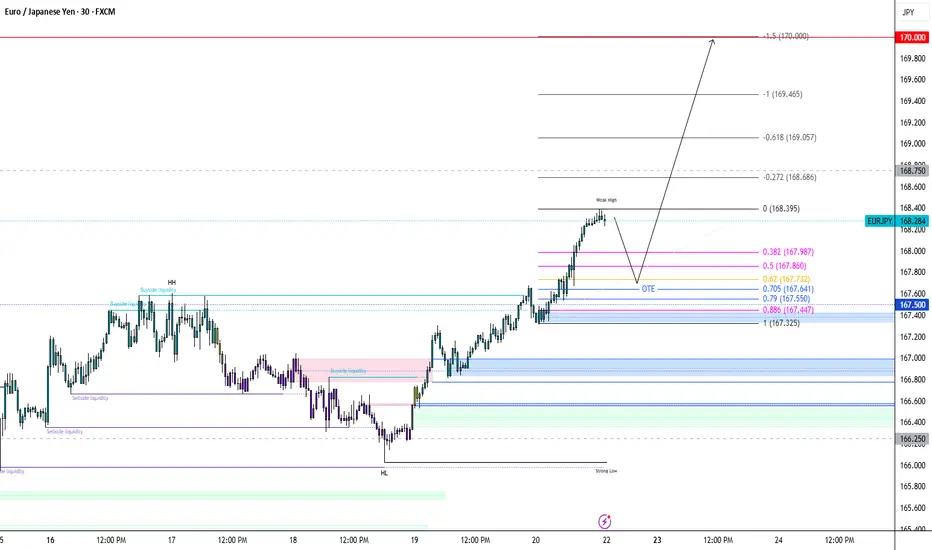
EURJPY: Buy The Dip Or Breakout ContinuationI'm looking to buy EJ...
If price retraces early next week, monitor 167.40–167.70 zone for bullish reaction and confirmation. Wait for M15 bullish BOS after price taps 167.40–167.70. If confirmed, execute long entry from this discounted range.
Entry: 167.40 – 167.70
Stop Loss: 167.10
TP1: 168.60
TP2: 169.20
TP3: 170
If price breaks and closes above 168.60, look for a retest for breakout continuation.
Trigger: Break + H1 candle close above 168.60
Entry on Retest: 168.60 – 168.70
Stop Loss: 168.20
Target: 169.50 – 170.00
Invalidation: H4 structure break below 167.00 would weaken bullish outlook short term
EUR/JPY Breakout Done , Long Setup Valid To Get 200 Pips !Here is my opinion on EUR/JPY , We have a very clear breakout and now i`m waiting for retest to broken res and new support and waiting for good bullish price action to enter a buy trade and targeting at least previous high , if the price go back below my support with daily closure then this idea will not be valid .

EUR/JPY Breaks Fibonacci Barrier – Room to RallyEUR/JPY has broken convincingly above the 61.8% Fibonacci retracement level at 167.42, clearing a major technical hurdle and reaffirming bullish momentum. This breakout also aligns with the pair's broader uptrend supported by the 50-day and 200-day SMAs, which are upward sloping and stacked in bullish order.
Technical Highlights:
Trend & Structure: Strong bullish structure with higher highs and higher lows; today's close above the 167.42 Fibonacci level confirms continuation.
Moving Averages: Price is comfortably above the 50-day and 200-day SMAs, with both acting as dynamic support zones.
MACD: Rising and bullish, with widening histogram bars indicating strengthening momentum.
RSI: At 70.4, the RSI has just entered overbought territory. While this signals strength, traders should also stay alert for signs of potential short-term consolidation or cooling.
Key Level to Watch: The next upside target lies near the 78.6% Fibonacci retracement at 170.93. That level could act as a magnet in the coming sessions if bullish momentum persists. Any retest of the breakout zone around 167.4 could serve as a launchpad if defended.
EUR/JPY remains technically strong, with bullish continuation favored unless price breaks back below the 50-day SMA.
-MW

EURJPY A Fall Expected! SELL!
My dear subscribers,
EURJPY looks like it will make a good move, and here are the details:
The market is trading on 166.89 pivot level.
Bias - Bearish
Technical Indicators: Both Super Trend & Pivot HL indicate a highly probable Bearish continuation.
Target - 166.57
About Used Indicators:
The average true range (ATR) plays an important role in 'Supertrend' as the indicator uses ATR to calculate its value. The ATR indicator signals the degree of price volatility.
Disclosure: I am part of Trade Nation's Influencer program and receive a monthly fee for using their TradingView charts in my analysis.
———————————
WISH YOU ALL LUCK

EURUSD ||| Elite traders see the trap
EUR/USD 4H 🔍 – Greenfire Forex Outlook
🟦 Rising channel structure spotted
🔸 Liquidity zones mapped
🟪 Buyer blocks identified (1.137 & 1.117)
📉 Let price dive deeper into the trap...
📈 Then catch the reversal with precision.
This is not a prediction, it's a reaction plan based on price behavior.
🔥 Structure + Zones + Patience = Greenfire Setup
.
#EURUSD #SmartMoneyConcepts #ForexAnalysis #ElliottWave #SMC #PriceAction #ForexIndia #4HChart

EUR/JPY BEST PLACE TO SELL FROM|SHORT
EUR/JPY SIGNAL
Trade Direction: short
Entry Level: 167.194
Target Level: 165.108
Stop Loss: 168.580
RISK PROFILE
Risk level: medium
Suggested risk: 1%
Timeframe: 17h
Disclosure: I am part of Trade Nation's Influencer program and receive a monthly fee for using their TradingView charts in my analysis.
✅LIKE AND COMMENT MY IDEAS✅

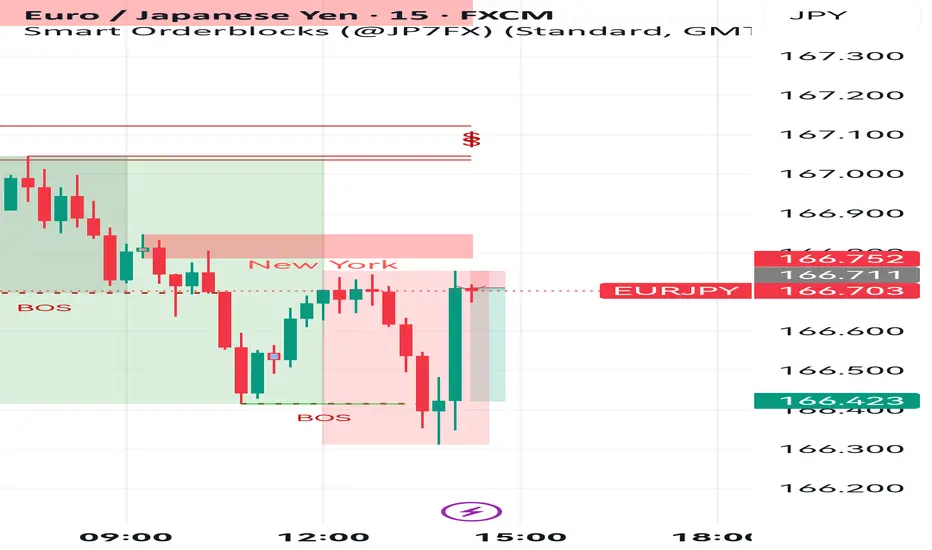
EURJPY – The Sweep That Sparked the ShiftSometimes the cleanest moves start with discomfort.
This EURJPY setup began with a sweep below the Previous Day’s Low (PDL), clearing out weak hands and gathering liquidity. That was our first clue.
Then came the Break of Structure (BOS), a confirmation that the market had shifted bullish.
Now will be waiting for price to retrace back to the FVG, where it found its footing and launched upward. Smart money cleared the lows, shifted structure .
Stick to the process. Trust what the chart is telling you.
Don’t chase, align.

EURJPY LONG FORECAST Q2 W25 D19 Y25EURJPY LONG FORECAST Q2 W25 D19 Y25
Professional Risk Managers👋
Welcome back to another FRGNT chart update📈
Diving into some Forex setups using predominantly higher time frame order blocks alongside confirmation breaks of structure.
Let’s see what price action is telling us today! 👀
💡Here are some trade confluences📝
✅Weekly 50 EMA
✅15' Order block identification
✅Daily Order block rejection
✅4H order block identification
🔑 Remember, to participate in trading comes always with a degree of risk, therefore as professional risk managers it remains vital that we stick to our risk management plan as well as our trading strategies.
📈The rest, we leave to the balance of probabilities.
💡Fail to plan. Plan to fail.
🏆It has always been that simple.
❤️Good luck with your trading journey, I shall see you at the very top.
🎯Trade consistent, FRGNT X