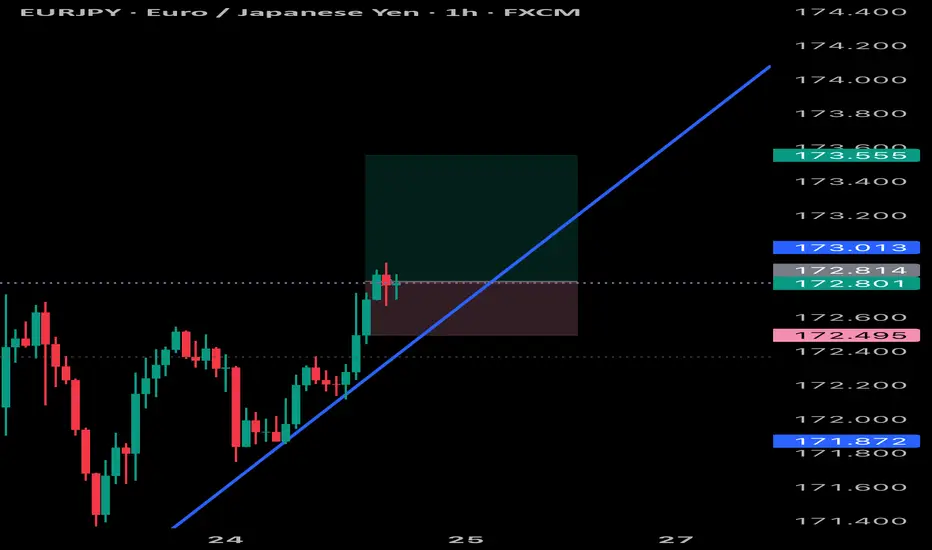
Trading the Pullback on EURJPY My Trade PlanThe EURJPY is clearly in a strong bullish trend 📈, as shown by a consistent pattern of higher highs and higher lows on the 1H timeframe ⏱️. In this video, I’m looking to capitalize on a pullback as a potential buy opportunity 🎯.
We dive into my entry strategy, explore how to align with the prevailing trend, and break down key concepts such as price action, market structure, and smart pullback zones 🧠📊.
⚠️ As always, this is for educational purposes only — not financial advice.
Eurjpyanalysis

EUR/JPY Again Below My Res , Short Setup Valid To Get 150 Pips !Here is my opinion on EUR/JPY On 2H T.F , We have a fake breakout and Gap and the price back again below my res area and closed with 4H Candle below it , so i have a confirmation and i`m waiting the price to go back to retest this strong res and give me any bearish price action and then we can enter a sell trade and targeting 100 : 150 pips . if we have a daily closure above my res then this analysis will not be valid anymore .

EURJPY ANALYSIS After seeing the weekly close bullish we could expect the pair to continue the bullish leg this new week with the daily and 4hr trading in the same direction. An upside target of 175.000 could be the profit taking areas for the next leg to the upside

EUR/JPY: The Yen Begins to Gain GroundOver the past three trading sessions, the EUR/JPY pair has declined by up to 0.8%, as the yen has steadily gained strength, preventing the euro from maintaining its momentum in the short term. Selling pressure has held firm, especially after news that Japan finalized a new trade agreement with the United States, which lowered the initially proposed 25% tariff to 15%. This development has been perceived as a positive outcome for Japan and has supported strong demand for the yen in the latest trading session.
Uptrend Remains Intact
Despite the yen’s recent strength, it is important to note that the EUR/JPY pair remains in a well-defined uptrend, with sustained bullish momentum continuing to dominate the long-term outlook. Although some short-term selling corrections have emerged, they remain insufficient to break the current bullish structure. For now, the uptrend remains the most relevant technical formation in the chart and should continue to be monitored unless selling pressure becomes significantly stronger.
RSI
The RSI indicator has started to show lower highs, while price action continues to register higher highs. This event suggests the potential formation of a bearish divergence, which may indicate that the current selling correction could gain more traction in the coming sessions.
MACD
The MACD histogram remains close to the neutral zero line, indicating that no clear direction has formed in short-term moving average momentum. If this neutral setting continues, the chart could enter a more defined consolidation phase in the near term.
Key Levels to Watch:
172.896 – Resistance Level: This level corresponds to the recent high, and any buying momentum strong enough to break it could confirm a bullish continuation, supporting the long-standing uptrend currently in place.
170.231 – Nearby Support: This level aligns with a short-term neutral zone and may act as a temporary barrier, limiting any bearish corrections that may arise in the sessions ahead.
166.930 – Key Support: This is a critical level not seen since June of this year. If bearish pressure intensifies and the price falls to this point, it could seriously jeopardize the bullish structure that has been holding so far.
Written by Julian Pineda, CFA – Market Analyst

RESET PRICE FOR EJEurjpy has gone down but only to clear stops and lows but we keep following the trend because it is the only true direction for now
UP TREND Simple up trend that is being followed and respected here by the price , we BULLS are in control
EURJPY ANALYSISAfter seeing that the previous daily candle could not trade below the moving averages and had a retracement to the upside it will be a good idea to wait and see how the pair trades before executing in a specific direction

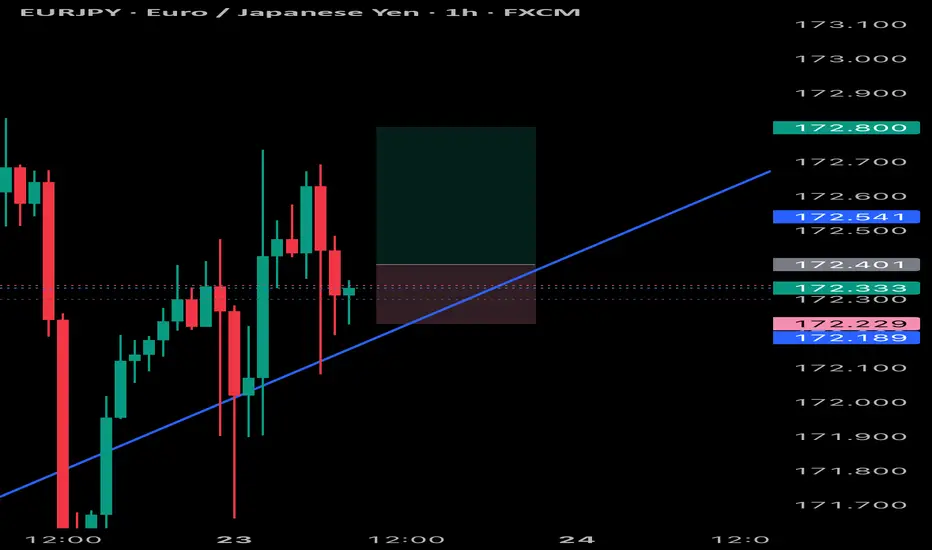
EURJPY Bullish Setup: Waiting for the Optimal Retrace EntryThe EURJPY is currently in a strong bullish trend 📈🔥. I’m anticipating a retracement into the Fibonacci 50–61.8% zone 🔄, which aligns with the equilibrium of the current price swing ⚖️. This potential pullback could present an optimal entry 🎯 — provided we see a bullish break of market structure 🔓📊 during the move down.
🛑 Stops and targets, as discussed in the video, are shared for educational purposes only — this is not financial advice 📚🚫. Please ensure you do your own analysis and risk assessment 🧠📉.

EURJPY IDEA After seeing the previous day close with bullish momentum we could expect continued push to the upside but since the 4hr is trading at a HH area a slight retrace could occur before the next bullish move to the upside

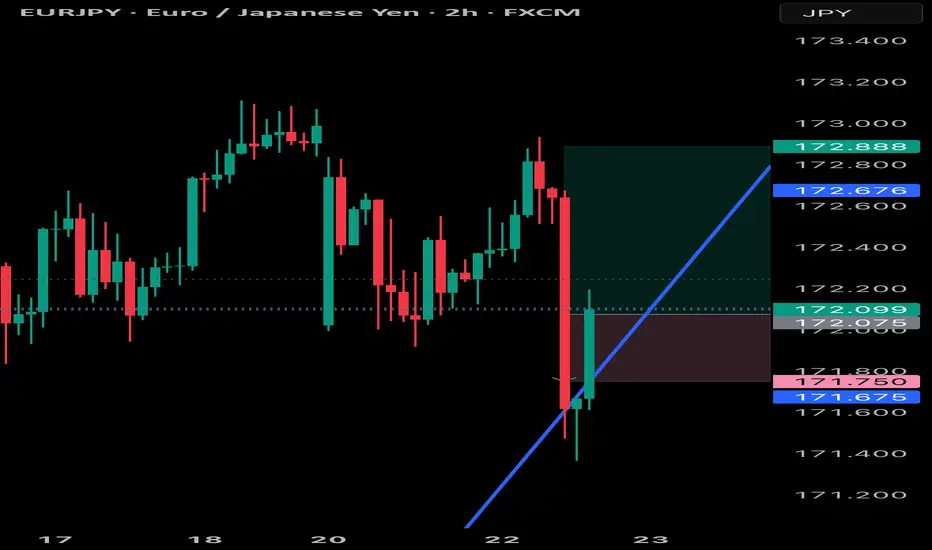
EURJPY: Bullish Trend ContinuationPrice remains in a strong uptrend, now trading above the 172.00 psychological level, targeting new liquidity above.
D1 Key Levels:
Support: 170.50 – 171.00 (daily demand zone + origin of breakout)
Resistance: Hasn't found a ceiling yet. Next key levels are psychological round numbers (173.00, 174.00).
H4 Demand Zone (Pullback Area): 171.20 – 171.50
Watch for retracement into this zone for a high-probability buy setup.
H1 OB: 171.30 – 171.50 (clean mitigation zone)
Monitor M15 for bullish BOS after price taps into this zone for confirmation.
M15 Optimal Plan:
Wait for pullback into 171.30–171.50
Confirm entry with M15 bullish BOS + displacement
🟢Entry Zone: 171.30 – 171.50 (after confirmation)
SL: 170.90
TP1: 172.80
TP2: 173.50
TP3: 174.20
Breakout Alternative: If price rallies above 172.80 early in the week, look for a breakout entry on retest.
Invalidation: H4 closes below 170.50

EURJPY–trend continuation, engulfing candle .. the week of 14/07Friday’s candle engulfed 2 previous days of price action. I interpret this as strongly bullish, especially since this happened in an already nicely bullish trend. However, the room to the upside it not unlimited - the ATH is at 175.421. We are likely to see sideways price action there due to some profit taking and maybe even some selling. IMO there are 2 possible options to get a 2R return:
- we may get a pullback before the bullish trend resumes.
- we drop down to the H1 chart and look for an opportunity to go long.
Either way, in my opinion, the trade should be closed before the ATH.
This is not a trade recommendation; it’s merely my own analysis. Trading carries a high level of risk so carefully managing your capital and risk is important. If you like my idea, please give a “boost” and follow me to get even more.

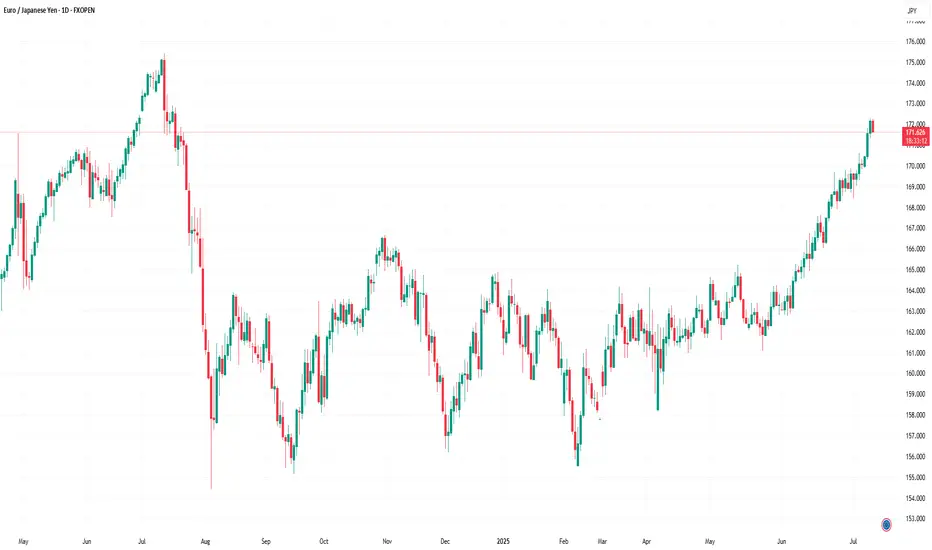
EUR/JPY Hits 12-Month HighEUR/JPY Hits 12-Month High
As the chart indicates, the EUR/JPY pair has risen above ¥172 per euro — a level last seen in July 2024.
Since early June, the exchange rate has increased by approximately 5.6%. This upward movement is driven by a combination of factors, including:
→ Divergence in central bank policy: The European Central Bank’s key interest rate remains significantly higher than that of the Bank of Japan, making the euro more attractive in terms of yield compared to the yen.
→ US trade tariffs on Japan: The potential imposition of 25% tariffs by the United States on Japanese goods poses a threat to Japan’s export-driven economy, placing downward pressure on the national currency.
→ Eurozone expansion and consolidation: News of Bulgaria’s potential accession to the euro area is strengthening investor confidence in the single currency.
→ Weakness in the US dollar: As the US Dollar Index fell to its lowest level since early 2022 this July, demand for the euro has grown, positioning it as a key alternative reserve currency.
Can the rally continue?
Technical Analysis of EUR/JPY
For several months, the pair traded within a range of approximately ¥156–165 per euro, but has recently broken above the upper boundary of this channel. Based on technical analysis, the width of the previous range implies a potential price target in the region of ¥174 per euro.
It is noteworthy that the rally gained momentum (as indicated by the arrow) following the breakout above the psychological threshold of 170, a sign of bullish market dominance. At the same time, the RSI has surged to a multi-month high, signalling moderate overbought conditions.
Under these circumstances, the market may be vulnerable to a short-term correction, potentially:
→ Towards the lower boundary of the ascending channel (shown in orange);
→ To retest the psychological support around ¥170.
That said, a reversal of the prevailing trend would likely require a significant shift in the fundamental backdrop — for example, progress towards a trade agreement between Japan and the United States.
This article represents the opinion of the Companies operating under the FXOpen brand only. It is not to be construed as an offer, solicitation, or recommendation with respect to products and services provided by the Companies operating under the FXOpen brand, nor is it to be considered financial advice.
EURJPY Bullish Breakout!
HI,Traders !
#EURJPY is trading in an
Uptrend an the pair made a
Bullish breakout of the key
Horizontal level of 169.790
Which is confirmed so after
pullback we will
Be expecting a further
Bullish continuation !
Comment and subscribe to help us grow !

EURJPY: Trading Above Major QP 170. Strong Bullish Trend EJ broke above the key psychological level of 170.00, and has not found major resistance yet. Expecting a bullish trend continuation as long as price stays above 169.
* M30 Bullish Choch
* Creating new HHs and HLs
* M30/H1 Bearish Break Block
* M30/H1 Bullish FVG (50% filled)
🟢Entry: 168.40 – 168.60
Stop Loss: 168.00
TP1: 169.80
TP2: 170.50
TP3: 171.20
Breakout Option: If price pushes above 170.50 early in the week, consider breakout entry on retest.
Invalidation: Bias shifts to neutral if H4 closes below 169.00.

EUR/JPY – Morning Star Reversal with RSI/MA Bullish ConfirmationTechnical Snapshot (1H Timeframe):
✅ Morning Star pattern at key support/resistance zone (169.90–170.00), indicating potential bullish reversal.
📈 Price holds above 55 EMA, confirming structure support and sustained uptrend.
💥 MACD Bullish Crossover signaling renewed upward momentum.
🔄 RSI crossover above its MA from the 50 level – a classic sign of buyer strength resuming.
Bias: Bullish
As long as price sustains above the EMA cluster and doesn’t close below the 170.00 zone, bulls are in control. Watch for a retest + push scenario for low-risk entries.
This idea is for educational purposes only – not financial advice.

EURJPY - Looking To Sell Pullbacks In The Short TermM15 - Strong bearish move.
Lower lows on the moving averages of the MACD.
No opposite signs.
Currently it looks like a pullback is happening.
Expecting bearish continuation until the two Fibonacci resistance zones hold.
If you enjoy this idea, don’t forget to LIKE 👍, FOLLOW ✅, SHARE 🙌, and COMMENT ✍! Drop your thoughts and charts below to keep the discussion going. Your support helps keep this content free and reach more people! 🚀
--------------------------------------------------------------------------------------------------------------------

EUR/JPY 1H Analysis – Ascending Channel With Critical ResistanceThe EUR/JPY pair has been trending steadily inside a well-defined ascending channel, indicating bullish control over the past few weeks. However, price is now approaching a major horizontal resistance zone, aligning with the upper boundary of the channel — a critical area for potential breakout or reversal.
🔍 Chart Structure Breakdown:
🔹 1. Ascending Channel (Trend Continuation Structure)
The pair is respecting both the upper and lower trendlines precisely, forming a bullish parallel channel.
EMAs are aligned bullishly and acting as dynamic support.
Price continues forming higher highs and higher lows, a classic uptrend behavior.
🔹 2. Horizontal Resistance Zone (Purple Box)
The price is currently retesting a key horizontal resistance zone where sellers previously stepped in.
This zone aligns closely with the upper channel boundary, increasing confluence.
We could be witnessing a potential double top or a breakout build-up.
🔹 3. Volume Spike & Buyer Strength
Recent candles show increased volume — a possible signal that institutions are preparing for a larger move.
If volume increases further on breakout, it would confirm continuation.
🧭 Scenarios to Watch:
🟢 Bullish Scenario:
A strong breakout above the purple zone with a full-body candle close could signal:
A breakout from the ascending channel.
Fresh bullish momentum possibly targeting the 170.800–171.500 zone.
Ideal entry: On bullish retest of the breakout zone.
SL below breakout candle; TP at upper Fibonacci extensions.
🔴 Bearish Scenario (Double Top Rejection):
If price rejects the resistance zone again, forming a lower high or engulfing candle:
Expect a short-term pullback toward the midline or lower channel, around 168.500–168.000.
Bearish divergence with RSI or volume may confirm weakness.
This would create a Double Top inside the channel, often leading to a deeper correction.
📌 Conclusion:
EURJPY is at a make-or-break zone. The bullish structure remains intact, but the price must break and hold above the resistance to confirm strength. Until then, this could be a short-term exhaustion point.
🔄 Stay flexible. Watch volume, candle closes, and EMA behavior for confluence on your trade setup.
This analysis and chart work are entirely original and created from my own observations and strategy. Any resemblance to other posts is purely coincidental.
⚠️ Disclaimer:
This analysis is for educational and informational purposes only and does not constitute financial advice or a buy/sell recommendation. All views expressed are my own, based on personal technical interpretation.

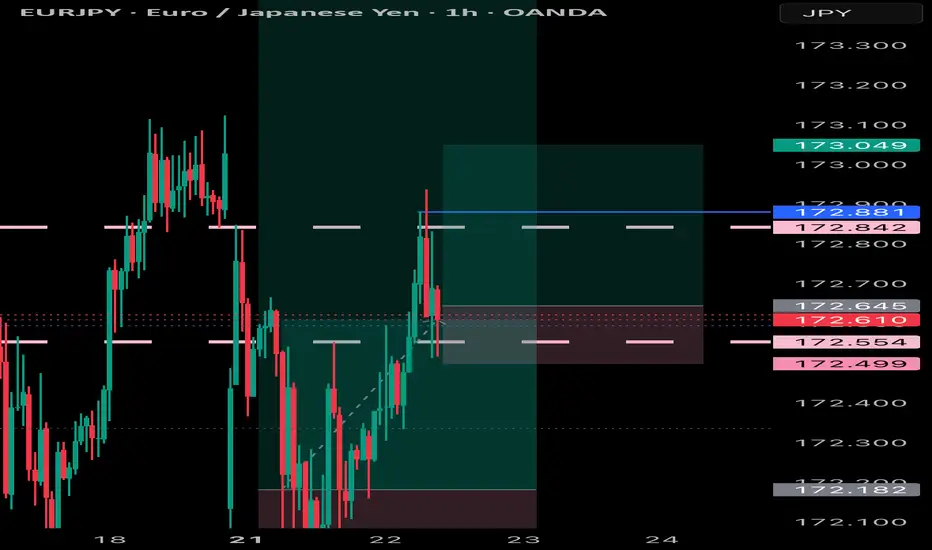
The Correlation Between EURJPY and NASDAQ You Shouldn't IgnoreCurrently keeping a close eye on EURJPY — price action has been bullish 📈, showing a strong upward push on the daily timeframe 🕒.
Right now, we’re seeing a bit of indecision 🤔, which is fairly typical for a Monday session as the market finds its footing.
🔍 I’m watching for continuation to the upside, as long as NASDAQ remains bullish. That said, NASDAQ is looking quite overextended 🧗, and a pullback could trigger a short-term retracement in the euro as well — these two tend to move in correlation 🔗, so keep a close watch on NAS100 for early clues.
If EURJPY consolidates sideways ⏸️, and we then get a clear break of market structure to the upside 🚀, I’ll be looking for a long setup on the retest and failure of the range floor — textbook continuation play 🎯.
As always, this is not financial advice — full breakdown in the video 🎥.

EURJPY ANALYSISAfter seeing the previous weekly candle close bullish confirming buying strength and it could continue into weekly highs and confluences on the daily and the 4hr suggest that too

EURJPYAs our followers may remember, we already secured a great profit on EURJPY.
Now, we're once again waiting for price to revisit our key level — so we can potentially catch another high-probability setup.
📌 Always remember:
The market is unpredictable.
We're not here to predict — we're here to react, using technical analysis, clear setups, proper risk and trade management.
❌ If a level breaks, we don’t panic.
✅ Instead, we patiently wait for a pullback and take advantage of the next smart entry.

EURJPY: A Big Move In Making, Please Share Your Views! Date: 22/06/2025
Hello everyone,
I hope you’re all having a good weekend. As we previously discussed, we expected a sharp decline in Europe/JPY, but unfortunately, it didn’t work out in our favour due to the extremely bullish US dollar. This led to the crossing and invalidation of our two selling zones.
Looking at next week’s price projection, we can confirm that the price is heading towards 170.50 and may be selling at this level. Therefore, we will be keeping a stop loss at 171.50.
Once the trade is activated, we can set our target at 166.0, 163.50, and the final target will be placed at 158.50.
If you like our work, please like our idea.
Good luck and trade safely next week.
