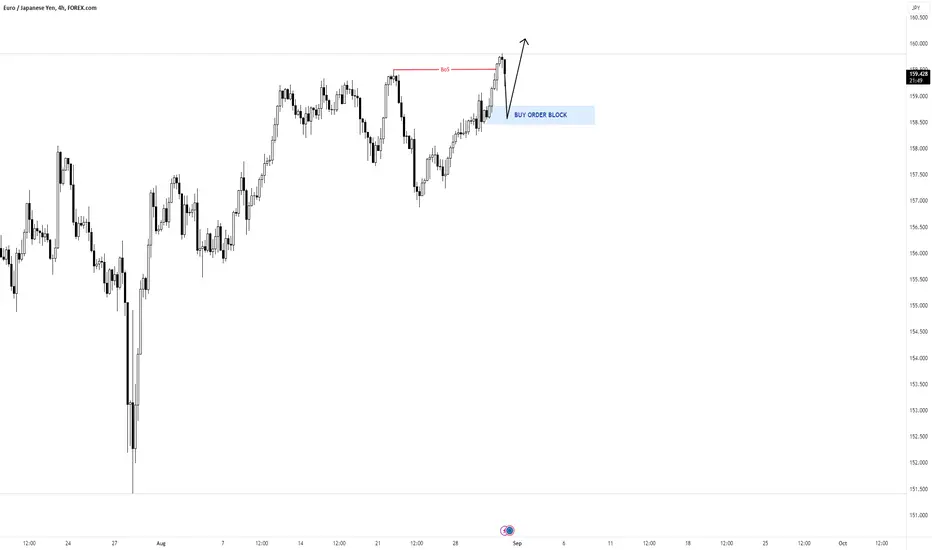
EURJPY Analysis H4Here is my analysis for EURJPY on H4 using Order Block. The price could go bullish, you can put a pending order on the Order block or find an entry on LTF within OB Zone. Trade Safe!
Eurjpyanalysis


EURJPY possible short for 157.90157.70 support line broke, CHoCH. Supply zone for short 159.25-48, stop loss above 159.48, target: 157.90

EUR/JPY Ascends Beyond 158.30 Amid Hawkish ECB CommentsThe EUR/JPY currency pair has edged above 158.30, largely influenced by ECB President Christine Lagarde's hawkish stance on inflation and interest rates. The pair faces resistance at 158.18 and could establish new trading ranges depending on upcoming economic data releases. The Bank of Japan maintains its loose monetary policy, offering a contrasting backdrop.
TRADE IDEA DETAILS
CURRENCY PAIR: EUR/JPY
CURRENT TREND: Bullish above 158.30
TRADE SIGNAL: Conditional Buy
👉 ENTRY PRICE: 158.40
✅ TAKE PROFIT: 159.40
❌ STOP LOSS: 157.80
ANALYSIS:
The EUR/JPY is trending upwards, buoyed by ECB's hawkish comments. Technically, the pair is experiencing resistance at the Tenkan-Sen line of 158.18. A breach above this line could signal strong bullish momentum. The risk-to-reward ratio is favorable with 1:2 (60 pip loss vs. 100 pip gain).
FINAL THOUGHTS:
The trade idea aims to capitalize on the pair's current bullish momentum and potential for higher moves. However, traders must exercise caution and keep an eye on fundamental economic releases that could influence market sentiment.

EURJPY, to ShortEURJPY could short after reaching the trendline resistance at the apex of the current descending channel. The price could experience a significant short after hitting the 158.420 resistance.
The price could drop to the next required support level at 156.885.

EURJPY Analysis 27Aug2023EURJPY last week was seen at the start of bearish, it has not been proven that there is a big bearish trend, this bearish possibility is just a correction. you can take a chance with the boundaries of wave B in the QM area. use the right money management to trade in this pair.

EURJPY sell in my viewEURJPY sell in my view.
Strong move break structure.
i think now consolidation and than slowly slowly down

EUR/JPY Faces Downward Pressure: Support Looms Near 156.00The EUR/JPY currency pair faces short-term bearish pressure, declining to lows near 157.00. Key support levels emerge at 156.00, 152.50, and 151.40, marked by various SMAs. Despite the immediate downturn, the longer-term trend remains bullish, supported by the 200-day SMA at 147.51. The situation provides both short-term and long-term trading opportunities, all illustrated in the daily technical chart.
TRADE IDEA DETAILS
CURRENCY PAIR: EUR/JPY
CURRENT TREND: Short-term bearish, long-term bullish
TRADE SIGNAL: Sell (Short-term) / Buy (Long-term)
Short-term (Sell) Trade:
👉ENTRY PRICE: 157.00 (Recent multi-day low)
✅TAKE PROFIT: 156.00 (55-day SMA) for a short-term trade, or 152.50 (100-day SMA) for a more extended trade
❌STOP LOSS: 158.00 (Just above the recent trading range)
Long-term (Buy) Trade:
👉ENTRY PRICE: 156.00 (55-day SMA)
✅TAKE PROFIT: 160.00 (Psychological resistance level)
❌STOP LOSS: 154.00 (Below the 100-day SMA)
ANALYSIS:
Short-term (Sell) Trade: The recent decline in EUR/JPY and a break below the 157.00 level offers a short-term selling opportunity. The 55-day SMA serves as a near-term target.
Long-term (Buy) Trade: The longer-term bullish trend and support at the 156.00 level (55-day SMA) provide an opportunity to buy, expecting a bounce and a return to the longer-term upward trend.

DeGRAM | EURJPY channel breakingEURJPY broke out of the ascending channel following three tops.
It broke and closed below the significant level of 157.700. and the consolidation zone.
Price movement is gaining momentum, and we might see a sharp bearish move.
We expect a breakout, pullback, and continuation trade.
-------------------
Share your opinion in the comments and support the idea with like. Thanks for your support!

EURJPY Analysis H1Here is my analysis for EURJPY on H1 using Order Block. The price could go bullish, you can put a pending order on the Order block or find an entry on LTF within OB Zone. Trade Safe!

EURJPY - Continuation (from previous post)(This is the continuation of the previous post - attached - which became overly long.)
Currently;
SHORT off of that "before last" Stop Hunt @150.125, with very tight stops (<12 pips and excellent R/R ratio), just below major resistance. This is a long term Short Entry attempt. (However, the main set up/position is in the GBPJPY, with superior R/R characteristics!)
Here is a close up;https://www.tradingview.com/x/Mw8tOplz/

EURJPY : Short Trade , 1hHello traders, we want to check the EURJPY chart. The price has broken the upward channel. We expect the price to continue its decline and fall to around the price of 158,200. If it can break this level, the next target that can be imagined will be the price of 157,700. Good luck.

EURJPY Long Term Buying Trading IdeaHello Traders
In This Chart EURJPY HOURLY Forex Forecast By FOREX PLANET
today EURJPY analysis 👆
🟢This Chart includes_ (EURJPY market update)
🟢What is The Next Opportunity on EURJPY Market
🟢how to Enter to the Valid Entry With Assurance Profit
This CHART is For Trader's that Want to Improve Their Technical Analysis Skills and Their Trading By Understanding How To Analyze The Market Using Multiple Timeframes and Understanding The Bigger Picture on the Charts

EURJPY TRADE IDEAhi all
At this level, I'm expecting rejection.
Let me know what you think In the comments!
**My trading strategy is not intended to be a signal. It's a process of learning about market structure and sharpening my trading skills**
Thanks a lot for your support

EURJPY: What happens next?EUR/JPY’s break of 158.03 resistance last week confirmed up trend resumption. But as a temporary top was formed at 159.20, initial bias is turned neutral this week for some consolidations first. Downside of retreat should be contained above 155.51 support to bring another rally. On the upside, break of 159.20 will target 61.8% projection of 139.05 to 157.99 from 151.39 at 163.09 next.

EURJPY: Next goal!Until now, the continuation of the upward momentum is likely to result in an immediate target emerging around 160.00 in the short term. The subsequent breakthrough will not encounter any notable resistance levels until reaching the highest point of 2008 at 169.96 on July 23.
As of now, there are positive long-term prospects for the convergence of bullish and bearish trends while on the 200-day SMA, which stands at 146.92 today.

EURJPY End of Bull Run! Let's go Shorting. {31/07/2023}Educational Analysis says EURJPY may go Short according to my technical.
This is not an entry signal. I have no concerns with your profit and loss from this analysis.
Why Short?
Because Jpy fair value gaps are unfilled in a 1- hour time frame.
Although last week EURJPY proved that, It's Changing its character and Also Sellers proved that the Market structure shifted and eventually lead to a Break of Structure.
The Rectangle box is the Order block
Analytical Trade would probably be
Sell limit order at 157.850
Stop loss at 158.90
Take profit at 151.356.
I HAVE NO CONCERNS WITH YOUR PROFIT OR LOSS.

EURJPY WEEKLY TRADE 24/2 TO 3/3hi all
Weekly summaries:
Before breaking through the previous high, daily trading had been in a consolidation phase from the previous high at 142.939 to a lower level at 137.385 for 9 weeks.
So, unless the price breaks present support at 139.547, a pullback would be a decent opportunity to stay long.
In the elliott wave chart,
I think the price is in wave 4 after an extended wave 1 and is about to complete wave 5 unless it breaks through the level of149.787, then I'm expecting wave 3 to end at a level between 158 and 160.
Let me know what you think In the comments!
My trading strategy is not intended to be a signal. It's a process of learning about market structure and sharpening my trading skills.
Thanks a lot for your support.

GBPJPY Short From Resistance!GBP-JPY wis retesting a
Strong horizontal resistance
Level of 183.087 from where
I think we will see a local
Bearish correction !

EURJPY 30M ZONE MARKINGsupport level1 156.000
support level2 155.500
support level3 155.100
resistance level1 157.700

EURJPY: New developments!The EUR/JPY cross builds on the previous day's goodish rebound from the 155.80 region, or a one-week low and gains strong follow-through positive traction for the second successive day on Tuesday. The momentum lifts spot prices to over a two-week high, around mid-157.00s during the Asian session and is sponsored by the heavily offered tone surrounding the Japanese Yen (JPY).
