EURJPY ANALYSISAfter seeing the previous weekly candle close bullish confirming buying strength and it could continue into weekly highs and confluences on the daily and the 4hr suggest that too
Eurjpyanalysis

EURJPYAs our followers may remember, we already secured a great profit on EURJPY.
Now, we're once again waiting for price to revisit our key level — so we can potentially catch another high-probability setup.
📌 Always remember:
The market is unpredictable.
We're not here to predict — we're here to react, using technical analysis, clear setups, proper risk and trade management.
❌ If a level breaks, we don’t panic.
✅ Instead, we patiently wait for a pullback and take advantage of the next smart entry.

EURJPY: A Big Move In Making, Please Share Your Views! Date: 22/06/2025
Hello everyone,
I hope you’re all having a good weekend. As we previously discussed, we expected a sharp decline in Europe/JPY, but unfortunately, it didn’t work out in our favour due to the extremely bullish US dollar. This led to the crossing and invalidation of our two selling zones.
Looking at next week’s price projection, we can confirm that the price is heading towards 170.50 and may be selling at this level. Therefore, we will be keeping a stop loss at 171.50.
Once the trade is activated, we can set our target at 166.0, 163.50, and the final target will be placed at 158.50.
If you like our work, please like our idea.
Good luck and trade safely next week.

EURJPY Setup Alert!
We’re waiting for the price to reach our marked level.
No emotional trades — let the setup come to you! ⏳
Levels are shown on the chart.
Follow us here: forexCSP

#EURJPY: Major Swing Sell +1100 Pips, One Not To Miss! The Japanese Yen (JPY) is most likely to continue its bullish trend, as the Dollar Index (DXY) is expected to decline due to the ongoing conflict between Israel and Iran. Historically, JPY and CHF, alongside gold and silver, have been favoured by global investors and remain bullish. Strong fundamentals and technical support further support our analysis.
The 167-169 price region remains a critical point for sellers, where we anticipate significant selling volume. There are two entry points to consider: one near the current price and another slightly further away. Please monitor volume and use smaller time frames for entries.
Our Swing Target is at 154, but you can also target smaller zones once the trade is activated. For instance, set take-profit levels at 164, 160, and finally, at 154.
To encourage and support us, you can like the idea, comment on it, or share it.
Team Setupsfx_
❤️❤️🚀🚀

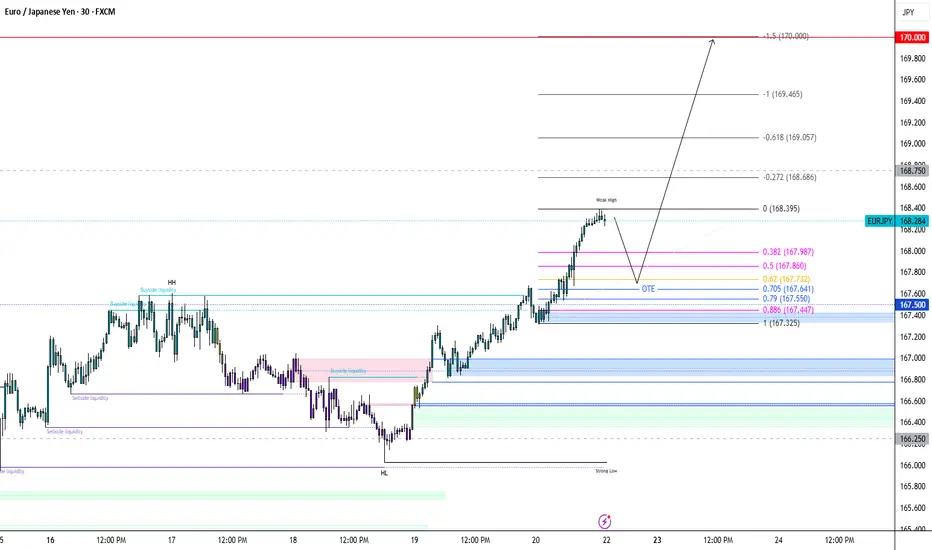
EURJPY: Buy The Dip Or Breakout ContinuationI'm looking to buy EJ...
If price retraces early next week, monitor 167.40–167.70 zone for bullish reaction and confirmation. Wait for M15 bullish BOS after price taps 167.40–167.70. If confirmed, execute long entry from this discounted range.
Entry: 167.40 – 167.70
Stop Loss: 167.10
TP1: 168.60
TP2: 169.20
TP3: 170
If price breaks and closes above 168.60, look for a retest for breakout continuation.
Trigger: Break + H1 candle close above 168.60
Entry on Retest: 168.60 – 168.70
Stop Loss: 168.20
Target: 169.50 – 170.00
Invalidation: H4 structure break below 167.00 would weaken bullish outlook short term
EUR/JPY Breakout Done , Long Setup Valid To Get 200 Pips !Here is my opinion on EUR/JPY , We have a very clear breakout and now i`m waiting for retest to broken res and new support and waiting for good bullish price action to enter a buy trade and targeting at least previous high , if the price go back below my support with daily closure then this idea will not be valid .

EURJPY Long Opportunity EURJPY has Bullish market directionality and is currently on a retracement per the 4 hour charts. Potential entry location at 166,425
Bullish confluences include price trading above the 50 SMA, Bullish momentum from the RSI with the current indication of price sitting within the sweet spot region between 45-55 which signals the need of the retracement. Bullish market structure also present with Higher Low and respective Higher Highs
166,425 is also a break and retest zone which provides an extra layer of confluence from the 4 hour perspective, will be looking at how price action reacts to this level on the 1 hour/ 15min chart for a potential bullish signal.

EURJPY ANALYSISFrom the previous trading day we see that the pair closed bullish and the 4hr and 1hr making HH and HL, which are confirmation of a bullish trend type move.

EURJPY Long Position EURJPY is currently in a bullish trend from a higher timeframe perspective with the potential for a further long opportunity at the end of the current retracement. On the 1 hour timeframe, EURJPY is trading above the 50 SMA and is approaching the 55 zone of the RSI indicating the end of the retracement and continuation of the bullish trend. addition confluences include the breakout level at 166,566 being tested and the the bullish trendline at play... Will be looking for an entry at 166,566 with stop loss below structure, riding the bullish trend towards the 167,190 resistance zone.

EURJPY ANALYSISAfter seeing the previous weekly candle close bullish, and the daily and 4hr showing bullish structure and a continuation to the upside, a quick pullback is expected for this pair before a further long as the pair is currently at a HH area

EURJPY Trade IdeaEURJPY is maintaining a strong bullish structure on the 1H chart, with price action consistently forming higher highs and higher lows.
My targets are set at the next resistance levels for partial and extended profits, with a final target at the upper resistance if bullish momentum persists.
Stop loss is placed just below the previous swing low.

EURJPY ANALYSISAfter seeing the previous daily candle close really bullish above 165.000 key weekly are, we could expect the bullish momentum to continue with confirmations on the 4hr structure making HH and HL

EURJPY SHORT FORECAST Q2 W24 D10 Y25EURJPY SHORT FORECAST Q2 W24 D10 Y25
Professional Risk Managers👋
Welcome back to another FRGNT chart update📈
Diving into some Forex setups using predominantly higher time frame order blocks alongside confirmation breaks of structure.
Let’s see what price action is telling us today! 👀
💡Here are some trade confluences📝
✅Weekly 50 EMA target
✅15' Order block identification
✅Daily Order block rejection
✅Ultimate high short
🔑 Remember, to participate in trading comes always with a degree of risk, therefore as professional risk managers it remains vital that we stick to our risk management plan as well as our trading strategies.
📈The rest, we leave to the balance of probabilities.
💡Fail to plan. Plan to fail.
🏆It has always been that simple.
❤️Good luck with your trading journey, I shall see you at the very top.
🎯Trade consistent, FRGNT X

Technical Analysis: JPY Price Action Near Resistance – Potential📊 Technical Analysis: JPY Price Action Near Resistance – Potential Reversal Ahead? ⚠️
---
🔍 Overview:
This chart illustrates the recent price action of a JPY-based asset (likely a JPY forex pair), currently testing a major resistance zone around the 165.286–165.500 area. The market is reacting sharply at this level, suggesting a possible rejection and correction downward. The setup is marked with well-defined support/resistance levels and potential retracement targets.
---
🟧 Key Zones:
🛑 Resistance Zone (165.286 – 165.500): Price is currently reacting at this overhead supply zone. This level has historically rejected bullish attempts, as seen in previous price action.
🟩 Support Zone (161.302 – 161.550): This demand zone has served as a strong base previously and is marked as the final potential retracement level (labeled "4") in the chart.
---
🔻 Retracement Levels:
Labeled as 1 through 4 in purple lines:
1. Level 1 – 163.948 🟣: Initial minor support; might provide a short-term pause if price pulls back.
2. Level 2 – 162.803 🔄: Mid-level support; watch for consolidation or bounce.
3. Level 3 – 162.091 🧲: Stronger support and possible bounce level.
4. Level 4 – 161.550 🛡️: Key support aligning with historical demand zone. A break below this could signal trend reversal.
---
🔄 Price Projection:
The curved arrow indicates a potential correction from the resistance zone down toward the support levels, especially targeting Zone 4. This move reflects a typical market reaction when price meets strong resistance after a steep rally.
---
📈 Strategic Implications:
For Bulls 🐂: Wait for confirmation of support at any of the retracement levels (especially 3 or 4) before entering.
For Bears 🐻: This is an optimal area to look for short entries, especially if bearish candlestick patterns confirm rejection from the resistance zone.
---
✅ Conclusion:
Price is at a critical decision point near major resistance. A bearish reversal is likely if the resistance holds, with a corrective move toward 161.302–161.550 being the most probable target range. Traders should watch for confirmation signals before committing to positions.
---
📌 Tip: Keep an eye on candlestick patterns and volume at the resistance zone to validate the reversal hypothesis.

eurjpy sell signal. Don't forget about stop-loss.
Write in the comments all your questions and instruments analysis of which you want to see.
Friends, push the like button, write a comment, and share with your mates - that would be the best THANK YOU.
P.S. I personally will open entry if the price will show it according to my strategy.
Always make your analysis before a trade

EURJPY ANALYSIS After seeing the previous week close really bullish on the daily and weekly timeframes, we could expect that momentum to continue pushing but since the pair is at a HH area on the daily we could expect a pull back before the bullish move kicks in

EURJPY SELL Signal. Don't forget about stop-loss.
Write in the comments all your questions and instruments analysis of which you want to see.
Friends, push the like button, write a comment, and share with your mates - that would be the best THANK YOU.
P.S. I personally will open entry if the price will show it according to my strategy.
Always make your analysis before a trade

EURJPY - Look for Short (SWING) 1:XX!It’s been a while since I last shared a trading idea — here’s one for you.
EURJPY has spent the past few weeks in an accumulation phase and now looks poised to shift into a distribution phase to the downside. Let’s see how it unfolds.
Disclaimer:
This is simply my personal technical analysis, and you're free to consider it as a reference or disregard it. No obligation! Emphasizing the importance of proper risk management—it can make a significant difference. Wishing you a successful and happy trading experience!

TEXT BOOK LTF PA EURJPY LONG FORECAST Q2 W21 D22 Y25TEXT BOOK LTF PA EURJPY LONG FORECAST Q2 W21 D22 Y25
Professional Risk Managers👋
Welcome back to another FRGNT chart update📈
Diving into some Forex setups using predominantly higher time frame order blocks alongside confirmation breaks of structure.
Let’s see what price action is telling us today!
💡Here are some trade confluences📝
✅Weekly 50 EMA
✅Daily 50 EMA
✅Tokyo ranges to be filled
✅Intraday 15' order block
✅Tokyo ranges to be filled
🔑 Remember, to participate in trading comes always with a degree of risk, therefore as professional risk managers it remains vital that we stick to our risk management plan as well as our trading strategies.
📈The rest, we leave to the balance of probabilities.
💡Fail to plan. Plan to fail.
🏆It has always been that simple.
❤️Good luck with your trading journey, I shall see you at the very top.
🎯Trade consistent, FRGNT X

EUR/JPY 1H: Bullish Falling Wedge Breakout + Target 🧠 Overview of the Setup
The EUR/JPY currency pair has recently completed a Falling Wedge pattern, a classic and powerful bullish reversal formation. This chart structure typically signals the end of a downtrend and the potential beginning of a strong upward impulse.
In this setup, multiple confluences point toward a bullish move, including pattern breakout, structure shift, retest of a dynamic support level, and alignment with major supply/resistance zones.
🔍 Pattern Analysis: Falling Wedge
Definition: A falling wedge is a technical pattern formed by two downward-sloping trendlines — one representing resistance and the other support — that converge. It signals a slowdown in bearish momentum, often preceding a bullish reversal.
Chart Observation: The wedge is well-defined, spanning several trading sessions. As price action tightened toward the apex, bearish momentum began to weaken.
Breakout Trigger: Price broke convincingly above the upper wedge boundary, suggesting the start of a bullish reversal.
✅ Implication: The breakout confirms that buyers have taken control, especially as this move is supported by a structural Change of Character (CHOCH).
📈 Price Action Structure & Key Zones
1. Minor Resistance (Broken)
After the breakout, price encountered a minor resistance zone just above the wedge. This area is now likely to flip into support (a classic breakout retest).
2. Major CHOCH (Change of Character)
A CHOCH indicates a break in market structure — from lower highs and lower lows to higher highs and higher lows.
The break above this level confirms a shift from bearish to bullish sentiment.
3. Curved Support (Black Min Curve)
A rising curved trendline has formed below current price, acting as a parabolic support structure.
This suggests not just a trend reversal, but increasing bullish momentum, as buyers step in at higher levels with each correction.
4. Major Resistance Zone (Target Area)
Price Target: ~164.50 – 165.50
This zone has historically acted as strong supply and is marked for potential take-profit or observation for reversal signals.
The target is derived from both horizontal resistance and the projected height of the wedge pattern.
🎯 Trading Strategy
Component Details
Entry Zone 162.50 – 162.60 (retest of minor resistance + curve support)
Stop Loss Below 162.00 (beneath wedge and curve)
Take Profit 164.50 – 165.50 (major resistance)
Risk/Reward Approx. 1:2.5 to 1:3
🔸 Conservative Entry: Wait for bullish confirmation (bullish engulfing candle or pin bar) on the support retest.
🔸 Aggressive Entry: Market buy after confirmation of curve bounce or on lower timeframe bullish signals.
📊 Volume & Momentum Consideration
Although volume isn’t shown on this chart, volume confirmation on the breakout would significantly strengthen the bullish bias. Look for:
Increasing buy volume on breakout
Lower sell volume on pullbacks
Bullish divergence (if using RSI or MACD)
⚠️ Risk Management & Event Awareness
Be cautious of unexpected JPY-related economic releases (e.g., BOJ announcements, inflation data) that may cause volatility.
If the curved support is broken decisively, this could invalidate the setup, suggesting further consolidation or downside risk.
🧠 Psychological Perspective
The Falling Wedge reflects a market where sellers are gradually losing control — pushing price lower, but with less conviction. As the wedge tightens, bulls prepare to step in. The breakout confirms that sentiment has shifted, and many traders use such setups as entry points for swing or momentum trades.
The curved support line suggests a transition from accumulation to markup phase, which typically leads to faster price expansion as confidence in the uptrend grows.
✅ Summary
✅ Pattern: Falling Wedge (Bullish)
✅ Breakout: Confirmed with CHOCH
✅ Support: Curve trendline acting as dynamic support
✅ Target: 164.50 – 165.50 major resistance
✅ Bias: Bullish (until curve support is broken)
📣 Final Thoughts
This is a high-probability bullish continuation setup backed by price structure, pattern breakout, and support alignment. The risk is well-defined, and reward potential is strong — making this a favorable setup for swing traders or short-term position traders.
💬 Let me know what you think in the comments — are you going long EUR/JPY?
👍 Like and Follow for more setups and breakdowns.

EUR/JPY "Yuppy" Heist: Sniping Swiss Profits with Thief Trading!🌍 Hello Global Traders! 🌟
Money Makers, Risk Takers, and Market Shakers! 🤑💸✈️
Dive into our EUR/JPY "Yuppy" Forex heist, crafted with the signature 🔥Thief Trading Style🔥, blending sharp technicals and deep fundamentals. Follow the strategy outlined in the TradingView chart, focusing on a long entry targeting the high-risk MA Zone. Expect a wild ride with overbought conditions, consolidation, and potential trend reversals where bearish players lurk. 🏆💰 Celebrate your wins, traders—you’ve earned it! 💪🎉
Entry 📈: The vault’s open! Grab bullish opportunities at any price, but for precision, set buy limit orders on a 15 or 30-minute timeframe near swing lows or highs for pullback entries.
Stop Loss 🛑:
📍 Place your Thief SL at the recent swing low on the 4H timeframe (163.00) for scalping or day trades.
📍 Adjust SL based on your risk tolerance, lot size, and number of open orders.
Target 🎯: Aim for 167.00
💵 EUR/JPY "Yuppy" is riding a bullish wave, fueled by key market drivers. ☝
Unlock the full picture—dive into Fundamentals, Macro Insights, COT Reports, Quantitative Analysis, Sentiment Outlook, Intermarket Trends, and Future Targets. Check 👉🌎🔗.
⚠️ Trading Alert: News & Position Management 📰🚨
News can shake the market hard. Protect your trades by:
Avoiding new entries during news releases.
Using trailing stops to lock in profits and shield running positions.
📌 Markets move fast—stay sharp, keep learning, and adapt your strategy as conditions evolve.
💖 Power up our heist! 🚀 Tap the Boost Button to amplify our Thief Trading Style and make stealing profits a breeze. Join our crew, grow stronger, and conquer the markets daily with ease. 🏆🤝❤️
Catch you at the next heist, traders—stay ready! 🤑🐱👤🤩

EURJPY ABC BULLISH PATTERNEURJPY Market momentum is going to make a ABC Bullish pattern with the specific target and against the target 🎯
Target 🎯 166.000
Stop loss. 161.500
Conclusion: It's a strong bullish pattern market analysis use this for making money and use proper strategies.
