EURJPY - Breakdown Confirmation Toward Bearish ContinuationEURJPY has broken below the ascending trendline and is now trading under the key structure at **164.331**. The price appears to be forming a lower high before potentially continuing its downward move. As long as price stays below the **165.545** invalidation level, the bearish bias remains intact, with a projected target around **160.000**.
**Key Levels:**
- **Resistance (Invalid Level):** 165.545
- **Structure Break:** 164.331
- **Bearish Target:** ~160.000
**Outlook:**
Bearish continuation likely as long as price remains under resistance.
**Disclaimer:**
This is not financial advice. Trade at your own risk and always use proper risk management.
Eurjpyanalysis

EUR/JPY Faces the Upper Boundary of Its Lateral Range AgainOver the past five trading sessions, the EUR/JPY pair has climbed nearly 2% in favor of the euro, once again reaching a key resistance zone in the short term. For now, the bullish bias remains intact, driven by the weakened yen, which has lost demand in recent sessions. As a safe-haven currency, the yen has struggled to hold investor interest as trade tensions ease and market confidence rebounds.
Wide Lateral Range
Since 2024, EUR/JPY has maintained a broad lateral channel, bounded by resistance at 165.315 and support at 156.656. Recent buying momentum has brought the price back to the upper end of the range, and if bullish pressure continues, a breakout could occur—potentially giving way to a more sustained uptrend in the short term.
Technical Indicators:
ADX: The ADX line continues to hover below the neutral level of 20, signaling low volatility in recent movements. If the ADX fails to break above that level, a persistent state of neutrality may continue to dominate price action in the short term.
TRIX: The TRIX line remains above zero, but it shows a flattened curve, indicating the absence of a clear directional trend in the exponential moving averages. This opens the door for a neutral phase to develop at current resistance levels.
Key Levels to Watch:
165.315 – Major Resistance: Marks the upper boundary of the lateral range. Sustained bullish momentum above this level could lead to a stronger uptrend in the near term.
162.225 – Nearby Support: Aligns with the neutral zone of the past two weeks. May act as a barrier for short-term pullbacks.
160.655 – Critical Support: Corresponds to the midpoint of the current channel and aligns with the Ichimoku cloud area. A return to this level could undermine the current bullish structure and reinforce the broader sideways range.
Written by Julian Pineda, CFA – Market Analyst

Trendzilla vs Chop Kong (EUR/JPY)The bias for EUR/JPY - in our view - is higher
On the weekly timeframe:
A) WMA has flattened out and price held above it B) downtrend line broken and held
On daily timeframe:
EUR/JPY just broke resistance for possible breakout trade up to the olf high to 166 - and possibly beyond
Thoughts ?

EURJPY Short Term Buy Idea Update!!!Hi Traders, on March 27th I shared this idea "EURJPY - Expecting The Price To Bounce Higher Further"
Expected bullish continuation higher until the two Fibonacci support zones hold. You can read the full post using the link above.
Price moved as per the plan here!!!
Price respected the second Fibonacci support zone and bounced higher.
If you enjoy this idea, don’t forget to LIKE 👍, FOLLOW ✅, SHARE 🙌, and COMMENT ✍! Drop your thoughts and charts below to keep the discussion going. Your support helps keep this content free and reach more people! 🚀
--------------------------------------------------------------------------------------------------------------------
Disclosure: I am part of Trade Nation's Influencer program and receive a monthly fee for using their TradingView charts in my analysis.

EurJpy- Ready to rise at 166?Since mid-March, EURJPY has been in a consolidation phase. Except for the early April spike down, the pair has respected a pretty clear range between the 161.00 support and the 163.30 resistance.
Now, however, EURJPY looks ready to break to the upside. A sustained price above 163.30 would confirm this breakout and open the door for bullish momentum.
🔍 My strategy:
I’m looking to buy dips, ideally around the 162.50 area.
If the price drops and breaks below 161, that would invalidate the setup.
On the upside, the first major target is the 166.00 resistance zone.
Disclosure: I am part of Trade Nation's Influencer program and receive a monthly fee for using their TradingView charts in my analyses and educational articles.

Mid Term Short on EURJPYIn the short term, I predict a bounce back to the trendline as we sweep some liquidity around this current location. If/When we break the 155 support, we will hit a minimum of 140 and even lower.
This is an idea. If you agree with the fundamentals of the chart you can follow my trade.
Short-term target with price reversal from 1.55
Target 1 - 159
Target 2 - 161.500 (I will look for a reversal and short from this location)
Price target with price breaking below 1.55 support zone
Short Term Target - 140
Mid Term Target - 135

EURJPY is in the Sell Trend after testing Lower HighHello Traders
In This Chart EURJPY HOURLY Forex Forecast By FOREX PLANET
today CADJPY analysis 👆
🟢This Chart includes_ (EURJPY market update)
🟢What is The Next Opportunity on EURJPY Market
🟢how to Enter to the Valid Entry With Assurance Profit
This CHART is For Trader's that Want to Improve Their Technical Analysis Skills and Their Trading By Understanding How To Analyze The Market Using Multiple Timeframes and Understanding The Bigger Picture on the Charts

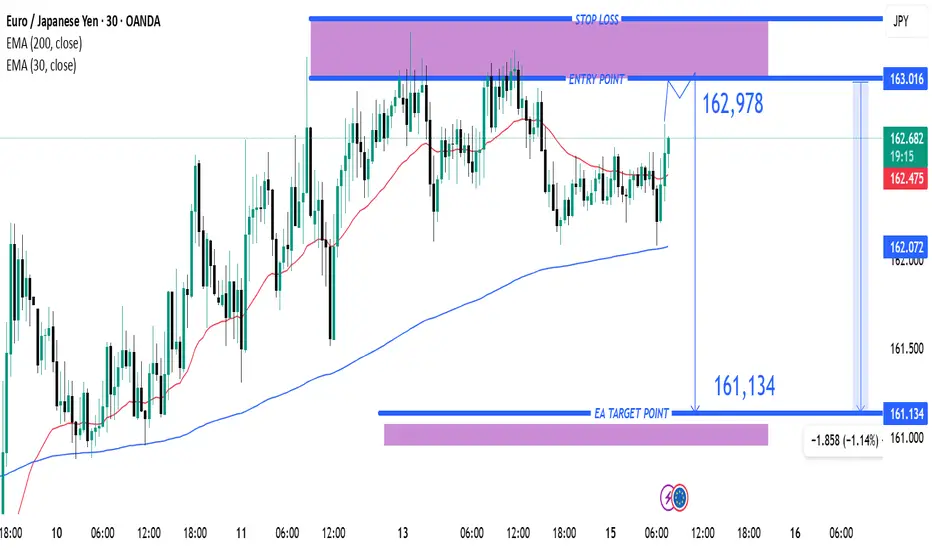
EUR/JPY Short Setup – Bearish Reversal Targeting 161.134 with TiEMA 30 (red): Currently at 162.470
EMA 200 (blue): Currently at 162.071
Trade Setup:
Entry Point: Around 162.978
Stop Loss: Slightly above 163.016 (highlighted in purple zone)
Target (Take Profit): 161.134 (labeled as “EA TARGET POINT”)
Analysis:
Trend: The pair has been trending upwards recently, as shown by the price staying above the 200 EMA.
Current Price: 162.604, just below the proposed entry.
Risk/Reward:
Risk: ~3.8 pips (entry to stop loss)
Reward: ~184.4 pips (entry to target)
This implies a favora
Setup of the Week: EURJPY Long Toward LiquidityI'm currently watching EURJPY for a potential long setup. Price is showing signs of bullish structure, and there’s a clean upside target sitting at 164.20, where equal highs rest on the weekly chart. That level also ends in a .20—an institutional number often used for stop placement—which adds confluence that price may be drawn toward it.
Why I'm Bullish
The Euro is showing strength across the board this week, supporting directional alignment.
Structure is starting to build bullish pressure, especially as price grinds upward toward liquidity.
We have weekly equal highs at 164.20, which is a clear magnet. (zoom out)
This setup is pretty straightforward: I’m anticipating that price wants to make a move toward those untouched highs. No extra complexity needed.
Recent Price Action
Looking at structure from April 9th:
Price sold off, took out a daily low, and then reversed sharply—classic manipulation and reclaim. The idea is that smart money will need to close those sell orders out if price returns to that zone.
The April 9th move down into 160 created what I believe is an institutional footprint.
This move took out liquidity, reversed hard, and left behind a zone I expect to be defended.
On Sunday’s weekly open, price quickly ran last week’s high, then reversed hard during the Tokyo session—a likely short-term trap. This tells me we might see some short-term bearish pressure before a larger move up, which is fine since I want price to return to the institutional buy zone around 160.00–160.30.
📍 Key Levels
Buy Zone: 160.00–160.30
This is where volume flooded in to drive the initial bullish manipulation move. If price returns, I expect heavy buying interest to step in.
Trap Confirmation: 162.80
During London open today, price ran a low, then reclaimed a high, and retested 162.80—another institutional level (ends in .80). That area acted as a trap and likely marked the start of the move down. We should see price stay under this move for this idea to work.
Target: 164.20
That’s the weekly equal high. Liquidity sits above there. If we return to the buy zone and bulls step in, I’ll be looking to ride the move up into that level.
Summary
I’m looking to long EURJPY on a retracement into 160.00–160.30, ideally after a stop hunt or false breakdown into that zone. The goal is to ride the volume push up toward the weekly target of 164.20, where stops likely sit from early sellers who might take a trendline break trade. If price respects the London trap at 162.80 and moves lower, I’ll be watching closely for reaction and confirmation in the buy zone.
Let me know your thoughts below or if you're watching the same levels.

EURJPYThe pair gave us a bearish impulse, after an impulse we expect a consolidation and continuation
EUR/JPY "The Yuppy" Forex Bank Heist Plan (Swing / Day Trade)🌟Hi! Hola! Ola! Bonjour! Hallo! Marhaba!🌟
Dear Money Makers & Robbers, 🤑 💰💸✈️
Based on 🔥Thief Trading style technical and fundamental analysis🔥, here is our master plan to heist the EUR/JPY "The Yuppy" Forex Market. Please adhere to the strategy I've outlined in the chart, which emphasizes long entry. Our aim is to escape near the high-risk ATR Zone. Risky level, overbought market, consolidation, trend reversal, trap at the level where traders and bearish robbers are stronger. 🏆💸"Take profit and treat yourself, traders. You deserve it!💪🏆🎉
Entry 📈 : "The heist is on! Wait for the MA breakout (163.500) then make your move - Bullish profits await!"
however I advise to Place Buy stop orders above the Moving average (or) Place buy limit orders within a 15 or 30 minute timeframe most recent or swing, low or high level for Pullback entries.
📌I strongly advise you to set an "alert (Alarm)" on your chart so you can see when the breakout entry occurs.
Stop Loss 🛑: "🔊 Yo, listen up! 🗣️ If you're lookin' to get in on a buy stop order, don't even think about settin' that stop loss till after the breakout 🚀. You feel me? Now, if you're smart, you'll place that stop loss where I told you to 📍, but if you're a rebel, you can put it wherever you like 🤪 - just don't say I didn't warn you ⚠️. You're playin' with fire 🔥, and it's your risk, not mine 👊."
📍 Thief SL placed at the recent/swing low level Using the 4H timeframe (5100) Day trade basis.
📍 SL is based on your risk of the trade, lot size and how many multiple orders you have to take.
🏴☠️Target 🎯: 165.700 (or) Escape Before the Target
🧲Scalpers, take note 👀 : only scalp on the Long side. If you have a lot of money, you can go straight away; if not, you can join swing traders and carry out the robbery plan. Use trailing SL to safeguard your money 💰.
💰💵💸EUR/JPY "The Yuppy" Forex Market Heist Plan (Scalping/Day) is currently experiencing a bullishness,., driven by several key factors. 👇👇👇
📰🗞️Get & Read the Fundamental, Macro, COT Report, Quantitative Analysis, Sentimental Outlook, Intermarket Analysis, Future trend targets..., go ahead to check 👉👉👉🔗
⚠️Trading Alert : News Releases and Position Management 📰 🗞️ 🚫🚏
As a reminder, news releases can have a significant impact on market prices and volatility. To minimize potential losses and protect your running positions,
we recommend the following:
Avoid taking new trades during news releases
Use trailing stop-loss orders to protect your running positions and lock in profits
💖Supporting our robbery plan 💥Hit the Boost Button💥 will enable us to effortlessly make and steal money 💰💵. Boost the strength of our robbery team. Every day in this market make money with ease by using the Thief Trading Style.🏆💪🤝❤️🎉🚀
I'll see you soon with another heist plan, so stay tuned 🤑🐱👤🤗🤩

EURJPY Short Term Buy Idea Update!!!Hi Traders, on March 27th I shared this idea "EURJPY - Expecting The Price To Bounce Higher Further"
Expected bullish continuation higher until the two Fibonacci support zones hold. You can read the full post using the link above.
Price is moving as per the plan!!!
Price respecting the second Fibonacci support zone and bounces higher. My bullish view still remains.
If you enjoy this idea, don’t forget to LIKE 👍, FOLLOW ✅, SHARE 🙌, and COMMENT ✍! Drop your thoughts and charts below to keep the discussion going. Your support helps keep this content free and reach more people! 🚀
--------------------------------------------------------------------------------------------------------------------
Disclosure: I am part of Trade Nation's Influencer program and receive a monthly fee for using their TradingView charts in my analysis.

"EUR/JPY Trendline Break & RBR Zone Setup"🔹 Trendline Breakout
* ✍️ A descending trendline was clearly broken
* 📉 This signals a shift from bearish to bullish sentiment
* 🚀 Potential for a strong move upward
🔵 RBR Zone (Rally-Base-Rally)
* 📦 Marked as a demand zone
* 🧲 Price dipped into this zone and bounced — bullish sign!
* ✅ Ideal entry area for long trades
🎯 Target Point: 164.208
* 📈 This aligns with a previous swing high
* 🎯 Potential move: +309.8 pips / +1.92%
* 🥅 Clear bullish target if the momentum holds
🛑 Stop Loss: 160.455
* 🧱 Placed just below the demand zone
* 💡 Gives the trade breathing room
* 🔐 Risk-managed setup
📊 Indicators & Price Action
* 📍 Current Price: 161.443
* 📈 Above the DEMA (9) = Short-term bullish
* 🟢 Price action supports long entry
Summary
* 📌 Bias: Bullish
* 🎯 Target: 164.208
* 🛑 Stop: 160.455
* ⚖️ Risk-Reward: Excellent (R:R ≈ 1:3+)

EUR/JPY Bullish Reversal Setup – Entry, Stop Loss & Target StratEMA (30) - Red Line (160.596): Short-term trend.
EMA (200) - Blue Line (161.267): Long-term trend, currently above the 30 EMA indicating a bearish macro trend.
2. Entry Zone:
Marked in purple between 159.751 and 160.161, suggesting a buy (long) opportunity if price retests this demand/support zone.
3. Stop Loss:
Set just below the entry zone at 158.907, protecting against deeper bearish momentum.
4. Target Zone:
163.025 is the profit target, with a purple rectangle showing a resistance/supply zone around that level.
5. Price Action:
The price is currently consolidating near the ent

EURJPY Bearish Breakout!
HI,Traders !
EUR-JPY broke the rising
Support line and the breakout
Is confirmed so we are
Bearish biased and we
Will be expecting a
Further move down !
Comment and subscribe to help us grow !

EUR/JPY "The Yuppy" Forex Bank Heist Plan (Swing/Day)🌟Hi! Hola! Ola! Bonjour! Hallo! Marhaba!🌟
Dear Money Makers & Robbers, 🤑 💰💸✈️
Based on 🔥Thief Trading style technical and fundamental analysis🔥, here is our master plan to heist the EUR/JPY "The Yuppy" Forex Market. Please adhere to the strategy I've outlined in the chart, which emphasizes long entry. Our aim is the high-risk ATR Zone. Risky level, overbought market, consolidation, trend reversal, trap at the level where traders and bearish robbers are stronger. 🏆💸"Take profit and treat yourself, traders. You deserve it!💪🏆🎉
Entry 📈 : "The heist is on! Wait for the MA breakout (164.000) then make your move - Bullish profits await!"
however I advise to Place Buy stop orders above the Moving average (or) Place buy limit orders within a 15 or 30 minute timeframe most recent or swing, low or high level.
📌I strongly advise you to set an "alert (Alarm)" on your chart so you can see when the breakout entry occurs.
Stop Loss 🛑: "🔊 Yo, listen up! 🗣️ If you're lookin' to get in on a buy stop order, don't even think about settin' that stop loss till after the breakout 🚀. You feel me? Now, if you're smart, you'll place that stop loss where I told you to 📍, but if you're a rebel, you can put it wherever you like 🤪 - just don't say I didn't warn you ⚠️. You're playin' with fire 🔥, and it's your risk, not mine 👊."
📍 Thief SL placed at the recent/swing low level Using the 4H timeframe (161.000) Day / swing trade basis.
📍 SL is based on your risk of the trade, lot size and how many multiple orders you have to take.
🏴☠️Target 🎯: 167.000 (or) Escape Before the Target
🧲Scalpers, take note 👀 : only scalp on the Long side. If you have a lot of money, you can go straight away; if not, you can join swing traders and carry out the robbery plan. Use trailing SL to safeguard your money 💰.
EUR/JPY "The Yuppy" Forex Market Heist Plan (Swing / Day Trade) is currently experiencing a bullishness,., driven by several key factors.👇👇👇
📰🗞️Get & Read the Fundamental, Macro, COT Report, Quantitative Analysis, Sentimental Outlook, Intermarket Analysis, Future trend targets..., go ahead to check 👉👉👉🔗
⚠️Trading Alert : News Releases and Position Management 📰 🗞️ 🚫🚏
As a reminder, news releases can have a significant impact on market prices and volatility. To minimize potential losses and protect your running positions,
we recommend the following:
Avoid taking new trades during news releases
Use trailing stop-loss orders to protect your running positions and lock in profits
💖Supporting our robbery plan 💥Hit the Boost Button💥 will enable us to effortlessly make and steal money 💰💵. Boost the strength of our robbery team. Every day in this market make money with ease by using the Thief Trading Style.🏆💪🤝❤️🎉🚀
I'll see you soon with another heist plan, so stay tuned 🤑🐱👤🤗🤩

EUR/JPY Bullish Breakout Setup with 2.02% Target PotentialEMA 30 (red): 160.813
EMA 200 (blue): 161.441
---
Highlighted Zones & Points:
1. Entry Point:
Marked around 160.719 (just below EMA 30)
Positioned in a demand/support zone (highlighted purple box)
2. Resistance Point:
Marked at 161.799
Serves as a minor resistance level before the major target
3. EA Target Point:
Final target is 163.880
This represents a potential move of 3.253 units or 2.02%
---
Interpretation:
Bullish Bias: The chart suggests a bullish setup, anticipating a breakout above EMA 200 and the resistance point toward the target of 163…

EUR/JPY Falling Wedge Breakout | Bullish Potential Ahead🔍 Chart Overview: EUR/JPY – Daily Timeframe
This chart illustrates the price action of the Euro against the Japanese Yen and highlights a Falling Wedge Pattern developing over several months. This is a classic bullish continuation/reversal setup, supported by key technical levels.
📐 1. Chart Pattern: Falling Wedge
A falling wedge is a bullish chart pattern that occurs when the market consolidates between two downward-sloping trendlines.
Characteristics Seen in the Chart:
Converging Trendlines: The upper (resistance) and lower (support) boundaries are both sloping downward, indicating a narrowing price range.
Volume (not shown) usually decreases during the formation, followed by a surge on breakout.
Multiple Touch Points: The price action respects both boundaries multiple times, confirming the pattern's validity.
🏛️ 2. Key Levels
✅ Support Level (Demand Zone):
Marked around 156.000 – 158.000
Multiple bounces from this area, indicating strong buying interest.
Aligned with the lower wedge trendline and historical price reaction zones.
🚫 Resistance Level (Supply Zone / Breakout Zone):
Around 164.500 – 166.000
Price repeatedly failed to break this level, confirming it as a strong supply area.
Confluence of horizontal resistance and the upper wedge boundary.
📊 3. Trade Setup
💼 Entry Strategy:
Confirmation Buy: Enter a long position upon a daily candle close above the wedge resistance (around 166.000).
Aggressive traders may consider an earlier entry near the wedge’s support with a tight stop.
🎯 Target:
The projected target is 172.962, calculated based on the height of the wedge pattern added to the breakout point.
This aligns with a previous swing high area, serving as a logical profit-taking zone.
🛑 Stop Loss:
Positioned at 155.576, just below the key support zone.
This allows the trade room to breathe while protecting against a full pattern failure.
⚖️ 4. Risk Management
Risk-to-Reward Ratio (RRR): Target around 172.962 and Stop Loss at 155.576 offer a favorable RRR of approximately 2.5:1 or more, depending on entry.
Position Sizing: Use appropriate lot size based on your account risk tolerance (e.g., 1-2% of equity per trade).
📅 5. Timeframe Outlook
Medium to Long-Term Setup: Since this is a daily chart, the trade may take weeks to months to fully play out.
Patience and proper trade management are essential.
🔎 6. Additional Notes
Retest Opportunity: If price breaks out, look for a retest of the resistance zone as new support before continuation to the upside.
Fundamental Factors: Keep an eye on EUR and JPY economic data, ECB and BoJ policy announcements, and global risk sentiment, which can influence the pair.
🧭 Professional Takeaway
This is a textbook bullish falling wedge pattern within a well-defined technical structure. The chart provides:
A clear pattern breakout level,
Strong historical support/resistance zones,
A defined risk management plan,
And a realistic price target based on technical projection.
If you are a swing trader or position trader, this setup offers a high-probability opportunity with favorable risk-reward dynamics—provided a breakout is confirmed.

EUR/JPY "The Yuppy" Forex Bank Heist Plan (Scalping / Day Trade)🌟Hi! Hola! Ola! Bonjour! Hallo! Marhaba!🌟
Dear Money Makers & Robbers, 🤑 💰💸✈️
Based on 🔥Thief Trading style technical and fundamental analysis🔥, here is our master plan to heist the EUR/JPY "The Yuppy" Forex Market. Please adhere to the strategy I've outlined in the chart, which emphasizes long entry. Our aim is the high-risk Red Zone. Risky level, overbought market, consolidation, trend reversal, trap at the level where traders and bearish robbers are stronger. 🏆💸"Take profit and treat yourself, traders. You deserve it!💪🏆🎉
Entry 📈 : "The heist is on! Wait for the MA breakout (163.000) then make your move - Bullish profits await!"
however I advise to Place Buy stop orders above the Moving average (or) Place buy limit orders within a 15 or 30 minute timeframe most recent or swing, low or high level.
📌I strongly advise you to set an alert on your chart so you can see when the breakout entry occurs.
Stop Loss 🛑:
Thief SL placed at the recent/swing low level Using the 30 mins timeframe (161.500) swing trade basis.
SL is based on your risk of the trade, lot size and how many multiple orders you have to take.
🏴☠️Target 🎯: 166.000 (or) Escape Before the Target
🧲Scalpers, take note 👀 : only scalp on the Long side. If you have a lot of money, you can go straight away; if not, you can join swing traders and carry out the robbery plan. Use trailing SL to safeguard your money 💰.
EUR/JPY "The Yuppy" Forex Market Heist Plan (Scalping / Day Trade) is currently experiencing a bullishness,., driven by several key factors.
📰🗞️Get & Read the Fundamental, Macro, COT Report, On Chain Analysis, Sentimental Outlook, Intermarket Analysis, Future trend targets.. go ahead to check 👉👉👉
📌Keep in mind that these factors can change rapidly, and it's essential to stay up-to-date with market developments and adjust your analysis accordingly.
⚠️Trading Alert : News Releases and Position Management 📰 🗞️ 🚫🚏
As a reminder, news releases can have a significant impact on market prices and volatility. To minimize potential losses and protect your running positions,
we recommend the following:
Avoid taking new trades during news releases
Use trailing stop-loss orders to protect your running positions and lock in profits
💖Supporting our robbery plan 💥Hit the Boost Button💥 will enable us to effortlessly make and steal money 💰💵. Boost the strength of our robbery team. Every day in this market make money with ease by using the Thief Trading Style.🏆💪🤝❤️🎉🚀
I'll see you soon with another heist plan, so stay tuned 🤑🐱👤🤗🤩

EURJPY on the Edge of Collapse: Ready for the Drop? Hi Traders ! The price has formed a Head and Shoulders (H&S) pattern on the daily (1D) chart and is approaching the neckline. If it breaks this level with strong momentum, we could see a significant decline, targeting the 135.000 - 140.000 zone.
Key Levels:
✅ Confirmation: Clear break of the trendline.
❌ Stop-loss: Above the right shoulder 165.000.
🎯 Bearish target: 135.000 - 140.000.
We’ll wait for confirmation before taking action. Stay tuned!
Disclaimer: This is not financial advice. Do your own research before making any trading decisions.

EUR/JPY Technical Analysis: Key Support Test and Potential BreakThe image is a technical analysis chart for the EUR/JPY currency pair on a 3-hour timeframe. Here’s a breakdown of the analysis:
Key Elements of the Chart:
1. Support & Resistance Levels:
A resistance level is marked near 161.100.
A support zone is highlighted in purple around the 160.820 - 161.100 area.
A stop-loss level is indicated below 160.820, around 160.259.
2. Exponential Moving Averages (EMA):
200 EMA (Blue Line): 161.100, indicating a long-term trend support.
30 EMA (Red Line): 161.889, representing a short-term trend resistance.
3. Trade Setup:
The price is currently testing the support zone.
A potential long entry (buy position) is anticipated if price bounces from the support level.
Target Point (Take Profit) is set at 164.241.
Risk-

EURJPY Double Top - Bearish Reversal Ahead Toward Target!🔍 Chart Analysis: Identifying the Double Top Pattern
The EURJPY (Euro/Japanese Yen) 1-hour chart shows a classic Double Top pattern, which is a strong bearish reversal formation. This pattern occurs when the price reaches a significant resistance level twice but fails to break above it, indicating a potential shift from bullish momentum to bearish control.
1️⃣ Top 1: The first peak formed as buyers pushed the price higher, but strong resistance forced a pullback.
2️⃣ Top 2: The price attempted to break the same resistance level again but failed, forming a second peak at approximately 164.165, confirming that sellers are overpowering buyers.
3️⃣ Neckline (Support Level): The critical support level around 160.000 acted as a trigger for the bearish move. Once this level broke, the double top pattern was confirmed.
📌 Key Levels and Market Structure
🔹 Resistance (164.165): The highest level where sellers dominated, preventing further upward movement.
🔹 Support/Neckline (160.000): This level acted as a crucial pivot. Once broken, it signaled a trend reversal.
🔹 Take Profit Levels:
TP1 – 159.036: This serves as the first profit target, aligning with a prior demand zone.
TP2 – 157.200: The full projected downside move based on the double top pattern.
🔹 Stop Loss (SL): Above 164.165, ensuring a risk-managed approach in case of trend invalidation.
📉 Trading Strategy: How to Trade This Setup?
1️⃣ Entry Confirmation:
The ideal entry was after the price broke the neckline at 160.000 and retested it as resistance.
A breakdown candle with high volume confirmed seller dominance.
2️⃣ Stop-Loss Placement:
A stop-loss above 164.165 provides room for price fluctuations while protecting against false breakouts.
3️⃣ Profit Targets:
TP1: 159.036, securing partial profits.
TP2: 157.200, completing the double top measured move.
📊 Market Psychology & Price Action Insights
The double top pattern reflects a shift in market sentiment from bullish to bearish.
The repeated rejection at 164.165 signals a lack of buying strength, increasing the probability of a downward move.
The breakdown of the 160.000 neckline confirms that sellers have taken control.
The price action also shows a lower-high formation, reinforcing bearish momentum.
✅ Conclusion: Bearish Bias Until 157.200
This setup strongly favors short positions, as long as the price stays below 162.500.
A break above 164.165 invalidates the bearish setup, signaling a potential reversal.
Until then, the market remains bearish, with TP1 & TP2 as achievable downside targets.
💬 What’s your outlook on EURJPY? Drop your analysis below! 👇

EURJPY SELL/SHORTBy utilizing Fibonacci retracement levels, historical patterns, , we can formulate a hypothesis that the market might follow a similar trajectory if bearish sentiment prevails.
