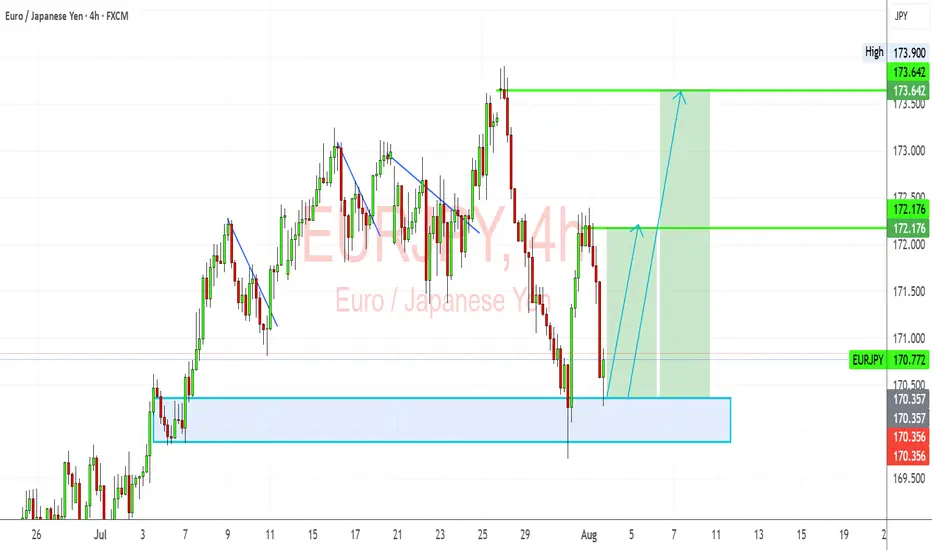
EURJPY: Bullish Rebound from Key Demand ZoneEURJPY has bounced off a critical demand zone and is showing signs of a bullish recovery. Despite the recent pullback, the pair’s structure remains fundamentally and technically bullish, driven by JPY weakness and EUR resilience.
Technical Analysis (4H Chart)
Pattern: Price tested a strong demand zone near 170.35–170.50 and rejected it aggressively.
Current Level: 170.77, starting a potential bullish leg toward higher resistance levels.
Key Support Levels:
170.35 – key demand zone and invalidation level for bulls.
169.90 – deeper support if demand zone breaks.
Resistance Levels:
172.17 – first bullish target and interim resistance.
173.64 – major target if bullish continuation sustains.
Projection: A successful rebound from 170.35 could drive price toward 172.17 initially, then 173.64 if momentum holds.
Fundamental Analysis
Bias: Bullish.
Key Fundamentals:
EUR: ECB’s slower path toward easing supports EUR stability relative to JPY.
JPY: Weakness persists as BoJ maintains dovish bias, though FX intervention risk limits JPY downside speed.
Global Sentiment: Mild risk-on mood supports EUR strength against JPY.
Risks:
BoJ verbal intervention or actual FX intervention could trigger temporary JPY strength.
Sharp reversal in global risk sentiment could weaken EUR/JPY.
Key Events:
ECB speeches and data (CPI, growth updates).
BoJ FX comments and broader market risk appetite.
Leader/Lagger Dynamics
EUR/JPY is a leader among JPY pairs, often moving in sync with GBP/JPY and CHF/JPY. Its movement also tends to precede confirmation in risk-sensitive JPY crosses.
Summary: Bias and Watchpoints
EUR/JPY is bullish from the 170.35 demand zone, with a potential move toward 172.17 and 173.64. Key watchpoints include ECB communication, BoJ stance, and market risk sentiment. As long as 170.35 holds, bulls remain in control.
Eurjpyforecast
How I’m Trading the EURJPY Break of Structure Setup📈 EURJPY Analysis Update 🔍
I'm currently watching EURJPY closely. On the weekly timeframe, the pair is clearly in a strong bullish trend 🚀. Price has recently tapped into a previous daily bullish order block 🧱 — a key zone of interest.
Now, I’m watching for a break of structure (BoS) 📉 followed by a bullish continuation, especially if price pulls back into the fair value gap (FVG) 📊 near the current low.
As always, this setup — along with all key details and trade considerations — is fully broken down in the 🎥 video.
⚠️ This is for educational purposes only and not financial advice.

Trading the Pullback on EURJPY My Trade PlanThe EURJPY is clearly in a strong bullish trend 📈, as shown by a consistent pattern of higher highs and higher lows on the 1H timeframe ⏱️. In this video, I’m looking to capitalize on a pullback as a potential buy opportunity 🎯.
We dive into my entry strategy, explore how to align with the prevailing trend, and break down key concepts such as price action, market structure, and smart pullback zones 🧠📊.
⚠️ As always, this is for educational purposes only — not financial advice.

RESET PRICE FOR EJEurjpy has gone down but only to clear stops and lows but we keep following the trend because it is the only true direction for now
UP TREND Simple up trend that is being followed and respected here by the price , we BULLS are in control
EURJPY Bullish Setup: Waiting for the Optimal Retrace EntryThe EURJPY is currently in a strong bullish trend 📈🔥. I’m anticipating a retracement into the Fibonacci 50–61.8% zone 🔄, which aligns with the equilibrium of the current price swing ⚖️. This potential pullback could present an optimal entry 🎯 — provided we see a bullish break of market structure 🔓📊 during the move down.
🛑 Stops and targets, as discussed in the video, are shared for educational purposes only — this is not financial advice 📚🚫. Please ensure you do your own analysis and risk assessment 🧠📉.

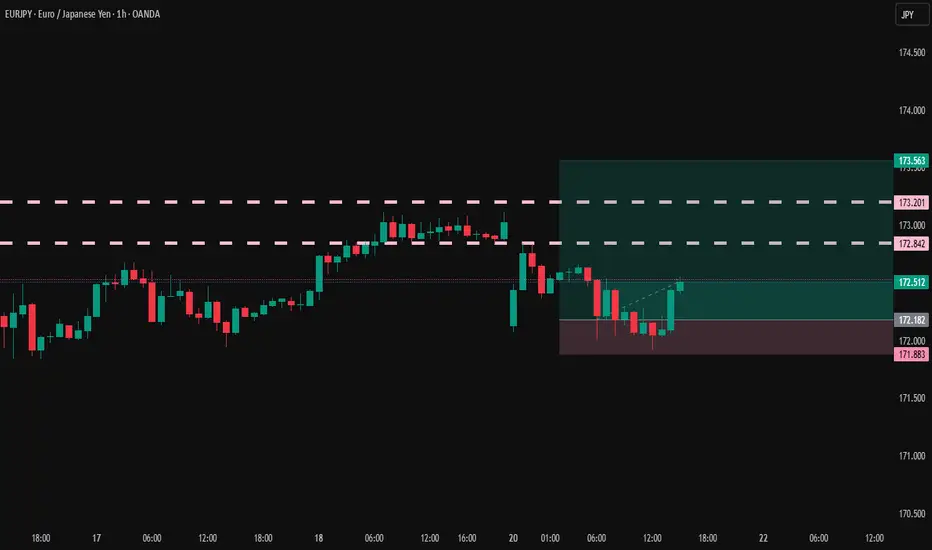
EURJPY: Bullish Trend ContinuationPrice remains in a strong uptrend, now trading above the 172.00 psychological level, targeting new liquidity above.
D1 Key Levels:
Support: 170.50 – 171.00 (daily demand zone + origin of breakout)
Resistance: Hasn't found a ceiling yet. Next key levels are psychological round numbers (173.00, 174.00).
H4 Demand Zone (Pullback Area): 171.20 – 171.50
Watch for retracement into this zone for a high-probability buy setup.
H1 OB: 171.30 – 171.50 (clean mitigation zone)
Monitor M15 for bullish BOS after price taps into this zone for confirmation.
M15 Optimal Plan:
Wait for pullback into 171.30–171.50
Confirm entry with M15 bullish BOS + displacement
🟢Entry Zone: 171.30 – 171.50 (after confirmation)
SL: 170.90
TP1: 172.80
TP2: 173.50
TP3: 174.20
Breakout Alternative: If price rallies above 172.80 early in the week, look for a breakout entry on retest.
Invalidation: H4 closes below 170.50

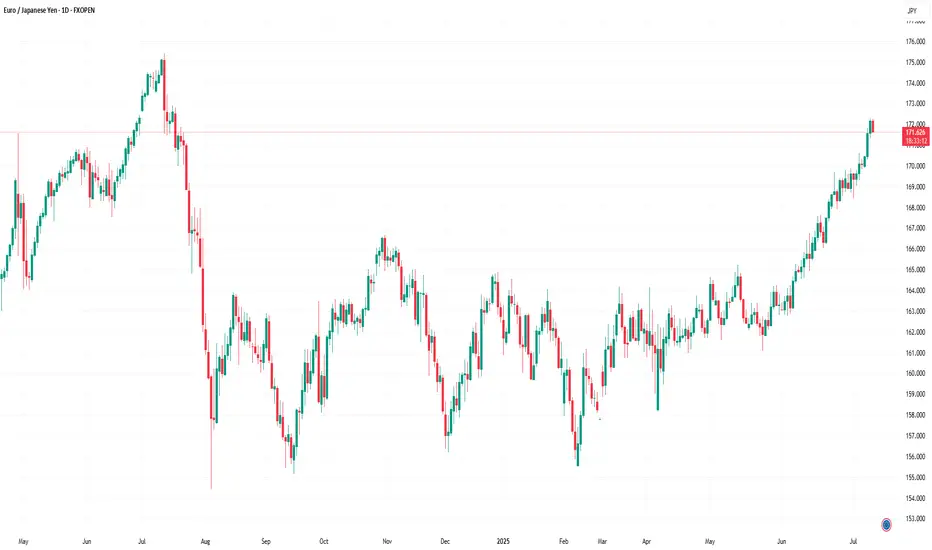
EUR/JPY Hits 12-Month HighEUR/JPY Hits 12-Month High
As the chart indicates, the EUR/JPY pair has risen above ¥172 per euro — a level last seen in July 2024.
Since early June, the exchange rate has increased by approximately 5.6%. This upward movement is driven by a combination of factors, including:
→ Divergence in central bank policy: The European Central Bank’s key interest rate remains significantly higher than that of the Bank of Japan, making the euro more attractive in terms of yield compared to the yen.
→ US trade tariffs on Japan: The potential imposition of 25% tariffs by the United States on Japanese goods poses a threat to Japan’s export-driven economy, placing downward pressure on the national currency.
→ Eurozone expansion and consolidation: News of Bulgaria’s potential accession to the euro area is strengthening investor confidence in the single currency.
→ Weakness in the US dollar: As the US Dollar Index fell to its lowest level since early 2022 this July, demand for the euro has grown, positioning it as a key alternative reserve currency.
Can the rally continue?
Technical Analysis of EUR/JPY
For several months, the pair traded within a range of approximately ¥156–165 per euro, but has recently broken above the upper boundary of this channel. Based on technical analysis, the width of the previous range implies a potential price target in the region of ¥174 per euro.
It is noteworthy that the rally gained momentum (as indicated by the arrow) following the breakout above the psychological threshold of 170, a sign of bullish market dominance. At the same time, the RSI has surged to a multi-month high, signalling moderate overbought conditions.
Under these circumstances, the market may be vulnerable to a short-term correction, potentially:
→ Towards the lower boundary of the ascending channel (shown in orange);
→ To retest the psychological support around ¥170.
That said, a reversal of the prevailing trend would likely require a significant shift in the fundamental backdrop — for example, progress towards a trade agreement between Japan and the United States.
This article represents the opinion of the Companies operating under the FXOpen brand only. It is not to be construed as an offer, solicitation, or recommendation with respect to products and services provided by the Companies operating under the FXOpen brand, nor is it to be considered financial advice.
EURJPY Bullish Breakout!
HI,Traders !
#EURJPY is trading in an
Uptrend an the pair made a
Bullish breakout of the key
Horizontal level of 169.790
Which is confirmed so after
pullback we will
Be expecting a further
Bullish continuation !
Comment and subscribe to help us grow !

EURJPY: Trading Above Major QP 170. Strong Bullish Trend EJ broke above the key psychological level of 170.00, and has not found major resistance yet. Expecting a bullish trend continuation as long as price stays above 169.
* M30 Bullish Choch
* Creating new HHs and HLs
* M30/H1 Bearish Break Block
* M30/H1 Bullish FVG (50% filled)
🟢Entry: 168.40 – 168.60
Stop Loss: 168.00
TP1: 169.80
TP2: 170.50
TP3: 171.20
Breakout Option: If price pushes above 170.50 early in the week, consider breakout entry on retest.
Invalidation: Bias shifts to neutral if H4 closes below 169.00.

EURJPY - Looking To Sell Pullbacks In The Short TermM15 - Strong bearish move.
Lower lows on the moving averages of the MACD.
No opposite signs.
Currently it looks like a pullback is happening.
Expecting bearish continuation until the two Fibonacci resistance zones hold.
If you enjoy this idea, don’t forget to LIKE 👍, FOLLOW ✅, SHARE 🙌, and COMMENT ✍! Drop your thoughts and charts below to keep the discussion going. Your support helps keep this content free and reach more people! 🚀
--------------------------------------------------------------------------------------------------------------------

The Correlation Between EURJPY and NASDAQ You Shouldn't IgnoreCurrently keeping a close eye on EURJPY — price action has been bullish 📈, showing a strong upward push on the daily timeframe 🕒.
Right now, we’re seeing a bit of indecision 🤔, which is fairly typical for a Monday session as the market finds its footing.
🔍 I’m watching for continuation to the upside, as long as NASDAQ remains bullish. That said, NASDAQ is looking quite overextended 🧗, and a pullback could trigger a short-term retracement in the euro as well — these two tend to move in correlation 🔗, so keep a close watch on NAS100 for early clues.
If EURJPY consolidates sideways ⏸️, and we then get a clear break of market structure to the upside 🚀, I’ll be looking for a long setup on the retest and failure of the range floor — textbook continuation play 🎯.
As always, this is not financial advice — full breakdown in the video 🎥.

EURJPYAs our followers may remember, we already secured a great profit on EURJPY.
Now, we're once again waiting for price to revisit our key level — so we can potentially catch another high-probability setup.
📌 Always remember:
The market is unpredictable.
We're not here to predict — we're here to react, using technical analysis, clear setups, proper risk and trade management.
❌ If a level breaks, we don’t panic.
✅ Instead, we patiently wait for a pullback and take advantage of the next smart entry.

EURJPY: A Big Move In Making, Please Share Your Views! Date: 22/06/2025
Hello everyone,
I hope you’re all having a good weekend. As we previously discussed, we expected a sharp decline in Europe/JPY, but unfortunately, it didn’t work out in our favour due to the extremely bullish US dollar. This led to the crossing and invalidation of our two selling zones.
Looking at next week’s price projection, we can confirm that the price is heading towards 170.50 and may be selling at this level. Therefore, we will be keeping a stop loss at 171.50.
Once the trade is activated, we can set our target at 166.0, 163.50, and the final target will be placed at 158.50.
If you like our work, please like our idea.
Good luck and trade safely next week.

EURJPY Setup Alert!
We’re waiting for the price to reach our marked level.
No emotional trades — let the setup come to you! ⏳
Levels are shown on the chart.
Follow us here: forexCSP

#EURJPY: Major Swing Sell +1100 Pips, One Not To Miss! The Japanese Yen (JPY) is most likely to continue its bullish trend, as the Dollar Index (DXY) is expected to decline due to the ongoing conflict between Israel and Iran. Historically, JPY and CHF, alongside gold and silver, have been favoured by global investors and remain bullish. Strong fundamentals and technical support further support our analysis.
The 167-169 price region remains a critical point for sellers, where we anticipate significant selling volume. There are two entry points to consider: one near the current price and another slightly further away. Please monitor volume and use smaller time frames for entries.
Our Swing Target is at 154, but you can also target smaller zones once the trade is activated. For instance, set take-profit levels at 164, 160, and finally, at 154.
To encourage and support us, you can like the idea, comment on it, or share it.
Team Setupsfx_
❤️❤️🚀🚀

EURJPY: Buy The Dip Or Breakout ContinuationI'm looking to buy EJ...
If price retraces early next week, monitor 167.40–167.70 zone for bullish reaction and confirmation. Wait for M15 bullish BOS after price taps 167.40–167.70. If confirmed, execute long entry from this discounted range.
Entry: 167.40 – 167.70
Stop Loss: 167.10
TP1: 168.60
TP2: 169.20
TP3: 170
If price breaks and closes above 168.60, look for a retest for breakout continuation.
Trigger: Break + H1 candle close above 168.60
Entry on Retest: 168.60 – 168.70
Stop Loss: 168.20
Target: 169.50 – 170.00
Invalidation: H4 structure break below 167.00 would weaken bullish outlook short term
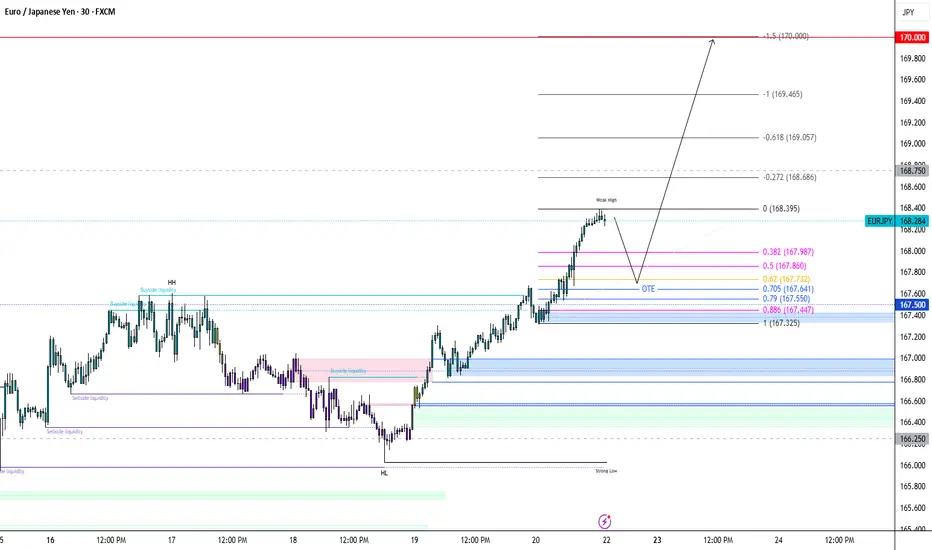
EURJPY LONG FORECAST Q2 W25 D19 Y25EURJPY LONG FORECAST Q2 W25 D19 Y25
Professional Risk Managers👋
Welcome back to another FRGNT chart update📈
Diving into some Forex setups using predominantly higher time frame order blocks alongside confirmation breaks of structure.
Let’s see what price action is telling us today! 👀
💡Here are some trade confluences📝
✅Weekly 50 EMA
✅15' Order block identification
✅Daily Order block rejection
✅4H order block identification
🔑 Remember, to participate in trading comes always with a degree of risk, therefore as professional risk managers it remains vital that we stick to our risk management plan as well as our trading strategies.
📈The rest, we leave to the balance of probabilities.
💡Fail to plan. Plan to fail.
🏆It has always been that simple.
❤️Good luck with your trading journey, I shall see you at the very top.
🎯Trade consistent, FRGNT X

EURJPY Trade IdeaEURJPY is maintaining a strong bullish structure on the 1H chart, with price action consistently forming higher highs and higher lows.
My targets are set at the next resistance levels for partial and extended profits, with a final target at the upper resistance if bullish momentum persists.
Stop loss is placed just below the previous swing low.

Technical Analysis: JPY Price Action Near Resistance – Potential📊 Technical Analysis: JPY Price Action Near Resistance – Potential Reversal Ahead? ⚠️
---
🔍 Overview:
This chart illustrates the recent price action of a JPY-based asset (likely a JPY forex pair), currently testing a major resistance zone around the 165.286–165.500 area. The market is reacting sharply at this level, suggesting a possible rejection and correction downward. The setup is marked with well-defined support/resistance levels and potential retracement targets.
---
🟧 Key Zones:
🛑 Resistance Zone (165.286 – 165.500): Price is currently reacting at this overhead supply zone. This level has historically rejected bullish attempts, as seen in previous price action.
🟩 Support Zone (161.302 – 161.550): This demand zone has served as a strong base previously and is marked as the final potential retracement level (labeled "4") in the chart.
---
🔻 Retracement Levels:
Labeled as 1 through 4 in purple lines:
1. Level 1 – 163.948 🟣: Initial minor support; might provide a short-term pause if price pulls back.
2. Level 2 – 162.803 🔄: Mid-level support; watch for consolidation or bounce.
3. Level 3 – 162.091 🧲: Stronger support and possible bounce level.
4. Level 4 – 161.550 🛡️: Key support aligning with historical demand zone. A break below this could signal trend reversal.
---
🔄 Price Projection:
The curved arrow indicates a potential correction from the resistance zone down toward the support levels, especially targeting Zone 4. This move reflects a typical market reaction when price meets strong resistance after a steep rally.
---
📈 Strategic Implications:
For Bulls 🐂: Wait for confirmation of support at any of the retracement levels (especially 3 or 4) before entering.
For Bears 🐻: This is an optimal area to look for short entries, especially if bearish candlestick patterns confirm rejection from the resistance zone.
---
✅ Conclusion:
Price is at a critical decision point near major resistance. A bearish reversal is likely if the resistance holds, with a corrective move toward 161.302–161.550 being the most probable target range. Traders should watch for confirmation signals before committing to positions.
---
📌 Tip: Keep an eye on candlestick patterns and volume at the resistance zone to validate the reversal hypothesis.

EURJPY - Look for Short (SWING) 1:XX!It’s been a while since I last shared a trading idea — here’s one for you.
EURJPY has spent the past few weeks in an accumulation phase and now looks poised to shift into a distribution phase to the downside. Let’s see how it unfolds.
Disclaimer:
This is simply my personal technical analysis, and you're free to consider it as a reference or disregard it. No obligation! Emphasizing the importance of proper risk management—it can make a significant difference. Wishing you a successful and happy trading experience!
