Eurjpyprediction


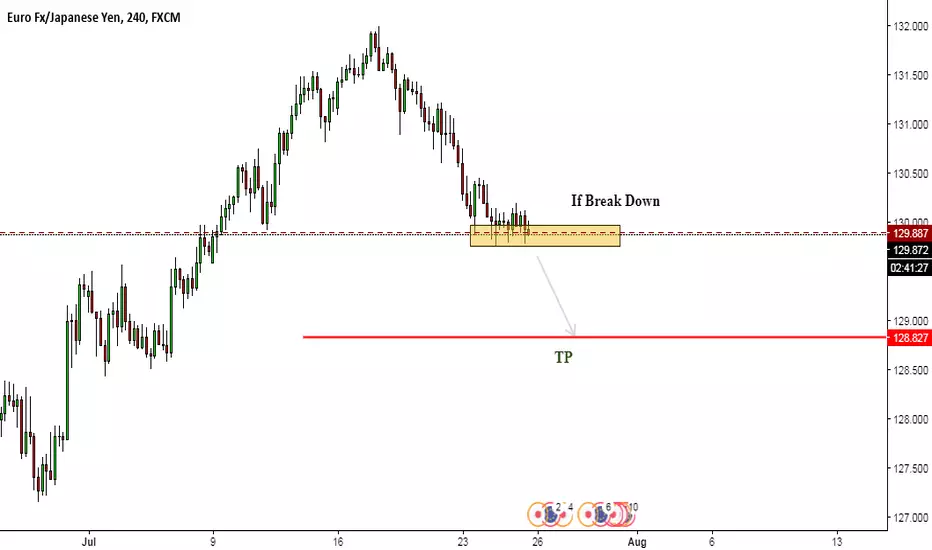
EURJPY - SELL - UPDATE FOR YOU GUYSEURJPY as previously analysed retraced to
Fibonacci retracement level of 0.5. i am ultimately
expecting this to go down
once my support line is broken (blue line) i am entering
the sell down.
See previous analysis
PLEASE LIKE, COMMENTS AND FOLLOW FOR MORE

EURJPY - THE WEEK UPDATEEURJPY should retrace to Fibonacci retracement
level of 0.618 or even 0.5. i am ultimately expecting
this to go down
once my support line is broken (blue line) i am entering
the sell down.
See previous analysis
PLEASE LIKE, COMMENTS AND FOLLOW FOR MORE

EURJPY BullishNeutral Long, just and idea on how EURJPY can turnout.
GREEN and YELLOW lines are support lines!

EURJPY SELLPLEASE SEE PREVIOUS BELOW
i am expecting this to go a lot low in a couple of weeks. but as you all know, there will be a reversal.


EUR/JPY - 100 Pips+ Bearish OpportunityEUR/JPY has been in consolidation since the beginning of the month.
As we can see on the 4H chart, the prices are in between the 200 EMA and 50 EMA. Meaning that a breakout in either direction is imminent. Most probably a bearish breakout since the 8H confirms weakness.
SL should be put above the 50 EMA on the 4H chart, preferably a few pips above it to leave enough space for the pair to move in case of volatility.
*If the pair does not break the 131 level but rather finds support on top, then we would have a breakout to the upside.
Trade safe.


EURJPY - ANALYSIS FOR THE DAYHey folks,
Here we have the analysis for EURJPY for the day.
We're still expecting it to come up one more time to then drop away from the structure.
Waiting for an H1 pattern, maybe also looking for a M15 entry!

EURJPY - UPDATEHey folks,
Same as EURUSD, this pair has played out beautifully until now! Even using the news to form our second leg ;)
Let's see what this market brings us either today or tomorrow.
Keep in mind, when they move we move.

EURJPY - Analysis for the weekHey folks,
Here's EURJPY for the beginning of the week.
Same as EURUSD, we're in a peak formation 50 above the quarterpoint and had interaction with the 50 EMA.
We're expecting a move up into the stophunt zone and look for a move down.
We'll keep you up to date:)


EURJPY - Intra Day ShortHey Guys,
Entered EURJPY short at 10:45 CEST.
Confluences:
- M formation at HOD
- Morning Star Pattern
- TDI Divergence
- Speed into Level 3
We trade under strict rules, once price closes above 13 EMA we're gonna kill the trade and take a scratch.

EURJPY Possible Sell setupEURJPY rallied nicely after a double bottom on 4hourly chart, for now price action is struggling heading up, i am expecting a pullback to be setting up, so watch this market for a possible short.


eurjpy - potential long - bullish divergence 4HI have been selling EURJPY from the very top .. closing my positions because spotted a Bullish Divergence. Please don't enter blindly and follow risk management. It'll be a short term bullish , please follow my other chart for long term trade.
Please hit LIKE to support and FOLLOW.
Long Term Chart :

eurjpy - short -- i am already in trade but never publishedI have been riding his short from the very top.. It has broken major trendline resistance, expecting a pullback or may continue to downtrend.. Targets on chart..
Please hit LIKE to support and follow for more ideas.
Vinny

Bank of Japan continues to disappoint buyers of yenThe current week is extremely busy in terms of activity of the Central Banks. The Bank of Japan, the Fed, the Bank of England (not counting the meetings and decisions of less significant Central Banks such as the Bank of India) announce their decisions on the parameters of monetary policies. So far, everything passes without surprises. Initially, the Bank of Japan, and then the Fed, left the parameters unchanged. But if the dollar by and large ignored the results of FOMC meeting, then the reaction to the decision of the Bank of Japan was more aggressive. Therefore, let's talk in detail about this, as well as the prospects for the Japanese yen in this light.
The Bank of Japan has traditionally left the parameters of monetary policy unchanged. What played a cruel joke with the yen. The fact is that many expected hints or direct indications of a gradual departure from the ultra-soft monetary policy in Japan. But this did not follow. The Bank of Japan once again confirmed adherence to ultra-low rates both in the short and long-term periods.
That is, the basic reason for the weakening of the yen has not disappeared anywhere and does not plan to do so in the foreseeable future. At the same time, the consensus on the market is that the ECB will start raising rates in 2019.
Thus, the fundamental basis contributes to the growth of the EURJPY pair. Moreover, the weakness of gold recently shows that the demand for safe heaven assets is weak, which means that this factor will not be able to support the Japanese yen, which is traditionally considered a safe haven in the foreign exchange market.
Given that recent macroeconomic statistics also play against the yen (Japan's industrial production fell sharply in June: -2.1% at the forecast of -0.3%, and unemployment on the contrary grew 2.4% vs. the forecast of 2.3%), there is every reason to expect further growth of the EURJPY pair. The minimum growth targets for the pair are around 131.50-132.00, but it is possible that the euro will strengthen against the yen up to 135 in the foreseeable future.
Our recommendations - buying a pair from the current prices.

EURJPY Sell Opportunity...Guys EURJPY Possible downward Keep watch and take profit
Disclaimer:
The information contained in this presentation is solely for educational purposes. Does do not constitute investment advice. I may or I may not take the trade.
The risk of trading in securities markets can be substantial. You should carefully consider if engaging in such activity is suitable for your own financial situation.
I am not responsible for any liabilities arising from the result of your market involvement or individual trade activities.
Hope this idea will inspire some of you! Don't forget to hit the like/follow button if you feel like this post deserves it
EURJPY 200 pips trade aheadEURJPY broke out the downtrend line earlier this month, price action is making marginal highs, i am expecting a pullback to be setting up for a test of the downtrend line. Look for sell setups.
Happy Trading.
