EUR/JPY Again Below My Res , Short Setup Valid To Get 150 Pips !Here is my opinion on EUR/JPY On 2H T.F , We have a fake breakout and Gap and the price back again below my res area and closed with 4H Candle below it , so i have a confirmation and i`m waiting the price to go back to retest this strong res and give me any bearish price action and then we can enter a sell trade and targeting 100 : 150 pips . if we have a daily closure above my res then this analysis will not be valid anymore .
Eurjpyshort

EURJPY – DAILY FORECAST Q3 | W31 | D29 | Y25📊 EURJPY – DAILY FORECAST
Q3 | W31 | D29 | Y25
Daily Forecast 🔍📅
Here’s a short diagnosis of the current chart setup 🧠📈
Higher time frame order blocks have been identified — these are our patient points of interest 🎯🧭.
It’s crucial to wait for a confirmed break of structure 🧱✅ before forming a directional bias.
This keeps us disciplined and aligned with what price action is truly telling us.
📈 Risk Management Protocols
🔑 Core principles:
Max 1% risk per trade
Only execute at pre-identified levels
Use alerts, not emotion
Stick to your RR plan — minimum 1:2
🧠 You’re not paid for how many trades you take, you’re paid for how well you manage risk.
🧠 Weekly FRGNT Insight
"Trade what the market gives, not what your ego wants."
Stay mechanical. Stay focused. Let the probabilities work.
OANDA:EURJPY

EURJPY ANALYSISAfter seeing the previous daily candle close as an engulfing and trading below the moving average we could be looking for further sell off but with the fundamentals coming out for the day we could see slowed movement till the news comes out

EURJPY Q3 | D25 | W30 | Y25📊 EURJPY Q3 | D25 | W30 | Y25
Daily Forecast🔍📅
Here’s a short diagnosis of the current chart setup 🧠📈
Higher time frame order blocks have been identified — these are our patient points of interest 🎯🧭.
It’s crucial to wait for a confirmed break of structure 🧱✅ before forming a directional bias.
This keeps us disciplined and aligned with what price action is truly telling us.
📈 Risk Management Protocols
🔑 Core principles:
Max 1% risk per trade
Only execute at pre-identified levels
Use alerts, not emotion
Stick to your RR plan — minimum 1:2
🧠 You’re not paid for how many trades you take, you’re paid for how well you manage risk.
🧠 Weekly FRGNT Insight
"Trade what the market gives, not what your ego wants."
Stay mechanical. Stay focused. Let the probabilities work.
FRGNT
OANDA:EURJPY

EURJPY: MSS on H4 Signals Bearish Shift Toward Weekly FVGGreetings Traders,
In today’s analysis of EURJPY, we observe that a Market Structure Shift (MSS) has recently occurred on the H4 timeframe, indicating a potential change in directional bias. This suggests that price may begin to draw toward the Weekly Fair Value Gap (FVG), presenting a favorable opportunity to align with bearish order flow.
Higher Timeframe Context:
The weekly timeframe currently shows an unfilled Fair Value Gap (FVG) to the downside, acting as the primary draw on liquidity. This macro bearish draw adds weight to the idea of shorting the pair from premium levels. On the H4—our intermediate timeframe—we now have structural confirmation via a bearish MSS, aligning the two timeframes toward downside targets.
Key Observations on H4:
Bearish Order Block in Premium: Price has recently retraced into an H4 bearish order block situated within premium pricing. This zone acts as institutional resistance and is currently showing signs of rejection.
Confirmation Zone: This H4 bearish order block is being monitored for M15 confirmation entries, as we look for price to break lower from this key institutional level.
Engineered Support & Resting Liquidity: Just above the weekly FVG lies an engineered support zone—characterized by equal lows—suggesting that liquidity has been pooled there. This area serves as a high-probability draw for institutional price delivery.
Trading Plan:
Entry Strategy: Seek lower timeframe (M15) confirmation around the H4 bearish order block before initiating short positions.
Targets: The first target lies at the H4 internal liquidity pool within discounted pricing. The longer-term objective is the weekly FVG, where liquidity is likely to be delivered next.
For a detailed analysis, please watch this weeks Forex Outlook:https://www.tradingview.com/chart/EURNZD/BZC9xW1L-July-21-Forex-Outlook-Don-t-Miss-These-High-Reward-Setups/
Maintain patience, follow your confirmation rules, and always adhere to sound risk management principles.
Kind Regards,
The_Architect 🏛️📉

EURJPY Q3 | D21 | W30 | Y25📊EURJPY Q3 | D21 | W30 | Y25
Daily Forecast 🔍📅
Here’s a short diagnosis of the current chart setup 🧠📈
Higher time frame order blocks have been identified — these are our patient points of interest 🎯🧭.
It’s crucial to wait for a confirmed break of structure 🧱✅ before forming a directional bias.
This keeps us disciplined and aligned with what price action is truly telling us.
📈 Risk Management Protocols
🔑 Core principles:
Max 1% risk per trade
Only execute at pre-identified levels
Use alerts, not emotion
Stick to your RR plan — minimum 1:2
🧠 You’re not paid for how many trades you take, you’re paid for how well you manage risk.
🧠 Weekly FRGNT Insight
"Trade what the market gives, not what your ego wants."
Stay mechanical. Stay focused. Let the probabilities work.
FRGNT 📊

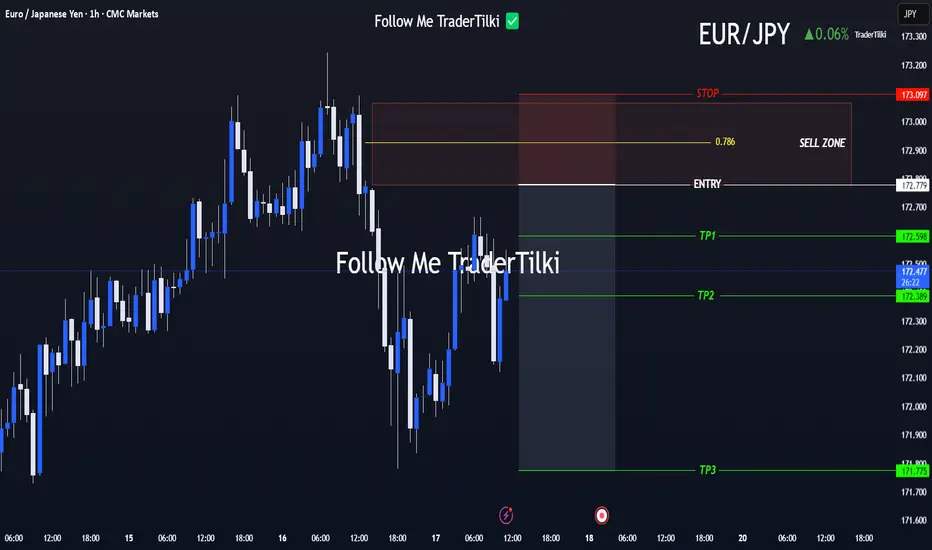
Clear Entry, Clear Targets! Strategy Kicks Off with EUR/JPYHey everyone 👋
📌 SELL LIMIT ORDER / EUR/JPY Key Levels
🟢 Entry: 172,779
🎯 Target 1: 172.598
🎯 Target 2: 172.389
🎯 Target 3: 171,775
🔴 Stop: 173.097
📈 Risk/Reward Ratio: 3.17
I double-checked the levels and put together a clean, focused analysis just for you. Every single like seriously boosts my motivation to keep sharing 📈 Your support means the world to me!
Huge thanks to everyone who likes and backs this work 💙
Our goals are crystal clear, our strategy is solid. Let’s keep moving forward with confidence and smart execution!
EURJPY SHORT – DAILY FORECAST Q3 | W29 | D15 | Y25💼 EURJPY SHORT – DAILY FORECAST
Q3 | W29 | D15 | Y25
📊 MARKET STRUCTURE SNAPSHOT
EURJPY is currently reacting from a key higher time frame supply zone, with price action showing weakness at premium levels. Structure and momentum are now aligning for a short opportunity backed by multi-timeframe confluence.
🔍 Confluences to Watch 📝
✅ Daily Order Block (OB)
Strong reaction and early signs of distribution.
Previous bullish momentum is losing steam; structure is flattening with rejection wicks forming.
✅ 4H Order Block
Break of internal structure (iBoS) confirms a short-term bearish transition.
✅ 1H Order Block
1H structure shift bearish
📈 Risk Management Protocols
🔑 Core principles:
Max 1% risk per trade
Only execute at pre-identified levels
Use alerts, not emotion
Stick to your RR plan — minimum 1:2
🧠 You’re not paid for how many trades you take, you’re paid for how well you manage risk.
🧠 Weekly FRGNT Insight
"Trade what the market gives, not what your ego wants."
Stay mechanical. Stay focused. Let the probabilities work.
🏁 Final Thoughts from FRGNT
📌 The structure is clear.
The confluences are stacked.
Let execution follow discipline, not emotion.

EURJPY SHORT – DAILY FORECAST Q3 | W29 | D14 | Y25 GAP SHORT!!!!💼 EURJPY SHORT – DAILY FORECAST
Q3 | W29 | D14 | Y25
📊 MARKET STRUCTURE SNAPSHOT
EURJPY is currently reacting from a key higher time frame supply zone, with price action showing weakness at premium levels. Structure and momentum are now aligning for a short opportunity backed by multi-timeframe confluence.
🔍 Confluences to Watch 📝
✅ Daily Order Block (OB)
Strong reaction and early signs of distribution.
Previous bullish momentum is losing steam; structure is flattening with rejection wicks forming.
✅ 4H Order Block
Break of internal structure (iBoS) confirms a short-term bearish transition.
✅ 1H Order Block
1H structure shift bearish
📈 Risk Management Protocols
🔑 Core principles:
Max 1% risk per trade
Only execute at pre-identified levels
Use alerts, not emotion
Stick to your RR plan — minimum 1:2
🧠 You’re not paid for how many trades you take, you’re paid for how well you manage risk.
🧠 Weekly FRGNT Insight
"Trade what the market gives, not what your ego wants."
Stay mechanical. Stay focused. Let the probabilities work.
🏁 Final Thoughts from FRGNT
📌 The structure is clear.
The confluences are stacked.
Let execution follow discipline, not emotion.

EURJPY SHORT DAILY FORECAST Q3 D1 W27 Y25EURJPY SHORT DAILY FORECAST Q3 D1 W27 Y25
Professional Risk Managers👋
Welcome back to another FRGNT chart update📈
Diving into some Forex setups using predominantly higher time frame order blocks alongside confirmation breaks of structure.
Let’s see what price action is telling us today! 👀
💡Here are some trade confluences📝
✅Daily Order block identified
✅4H Order Block identified
✅1H Order Block identified
🔑 Remember, to participate in trading comes always with a degree of risk, therefore as professional risk managers it remains vital that we stick to our risk management plan as well as our trading strategies.
📈The rest, we leave to the balance of probabilities.
💡Fail to plan. Plan to fail.
🏆It has always been that simple.
❤️Good luck with your trading journey, I shall see you at the very top.
🎯Trade consistent, FRGNT X

EURJPY SHORT DAILY FORECAST Q3 D30 W27 Y25EURJPY SHORT DAILY FORECAST Q3 D30 W27 Y25
Professional Risk Managers👋
Welcome back to another FRGNT chart update📈
Diving into some Forex setups using predominantly higher time frame order blocks alongside confirmation breaks of structure.
Let’s see what price action is telling us today! 👀
💡Here are some trade confluences📝
✅Daily Order block identified
✅4H Order Block identified
✅1H Order Block identified
🔑 Remember, to participate in trading comes always with a degree of risk, therefore as professional risk managers it remains vital that we stick to our risk management plan as well as our trading strategies.
📈The rest, we leave to the balance of probabilities.
💡Fail to plan. Plan to fail.
🏆It has always been that simple.
❤️Good luck with your trading journey, I shall see you at the very top.
🎯Trade consistent, FRGNT X

Eur/Jpy breaks the previous🔍 Key Observations:
Supply Zone (169.713):
Price is approaching a marked supply zone, where sellers previously stepped in with strong momentum. This zone could act as a resistance area, potentially rejecting price downward.
Previous Low Break:
The structure shows that price broke below a previous low, indicating bearish pressure and a possible shift in market sentiment.
Demand Zone Below (~168.700):
There's a strong demand zone marked below the current price, which may serve as a target for short sellers or an area for bullish entries if reached.
Projected Move (Orange Arrows):
The orange path suggests a potential move:
Price may first retest the supply zone around 169.713.
A rejection from that level could trigger a downward move, breaking recent support levels.
The price may bounce slightly midway before continuing the drop toward the demand zone.
RSI Indicator (Relative Strength Index):
Currently at 54.80 (blue line), the RSI is nearing overbought territory but not yet extreme. This leaves room for a bit more upside before a potential reversal, aligning with the idea of testing the supply zone first.

EURJPY : m30 (Short Position)By analyzing the 30-minute time frame and observing liquidity at the lows, I have a bearish scenario from 169.10 down to 168.20

EURJPY SHORT FORECAST Q2 W26 D26 Y25EURJPY SHORT FORECAST Q2 W26 D26 Y25
Professional Risk Managers👋
Welcome back to another FRGNT chart update📈
Diving into some Forex setups using predominantly higher time frame order blocks alongside confirmation breaks of structure.
Let’s see what price action is telling us today! 👀
💡Here are some trade confluences📝
✅Weekly Order Block Identified
✅Daily Order block identified
✅4H Order Block identified
✅15' Order block identified
🔑 Remember, to participate in trading comes always with a degree of risk, therefore as professional risk managers it remains vital that we stick to our risk management plan as well as our trading strategies.
📈The rest, we leave to the balance of probabilities.
💡Fail to plan. Plan to fail.
🏆It has always been that simple.
❤️Good luck with your trading journey, I shall see you at the very top.
🎯Trade consistent, FRGNT X

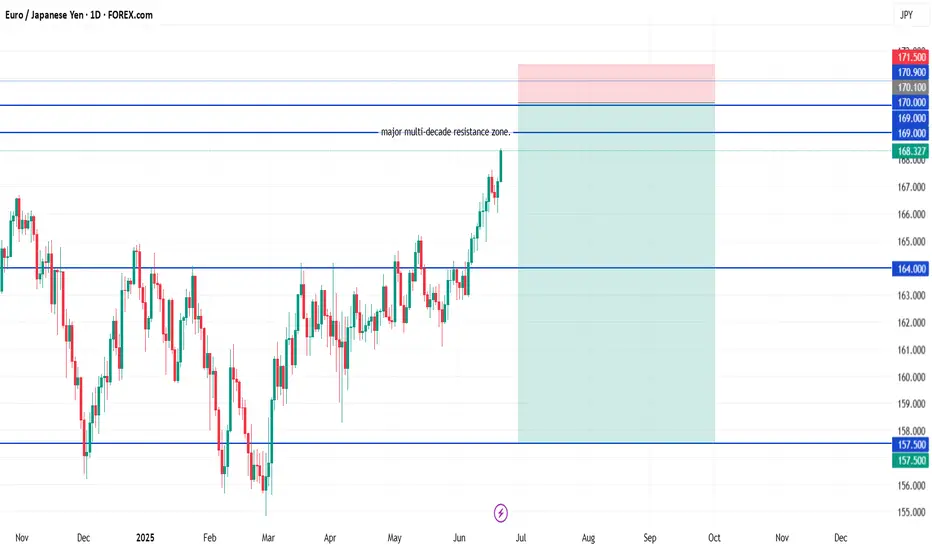
EURJPY: A Big Move In Making, Please Share Your Views! Date: 22/06/2025
Hello everyone,
I hope you’re all having a good weekend. As we previously discussed, we expected a sharp decline in Europe/JPY, but unfortunately, it didn’t work out in our favour due to the extremely bullish US dollar. This led to the crossing and invalidation of our two selling zones.
Looking at next week’s price projection, we can confirm that the price is heading towards 170.50 and may be selling at this level. Therefore, we will be keeping a stop loss at 171.50.
Once the trade is activated, we can set our target at 166.0, 163.50, and the final target will be placed at 158.50.
If you like our work, please like our idea.
Good luck and trade safely next week.

EUR/JPY Short✅ EUR/JPY Swing Short Setup (Multi-Entry)
🎯 Entries:
Entry 1: 169.00 (light position)
Entry 2: 170.10 (core entry)
Entry 3: 170.90 (final top entry)
🛡️ Stop Loss (Unified):
171.50
Placed above the entire resistance zone and previous all-time wick highs, allowing for normal trap behavior without overexposure.
🎯 Take Profits:
TP1: 164.00
TP2: 157.50
You can scale out partially at TP1 or run the full position to TP2 depending on how momentum builds.
#EURJPY: Major Swing Sell +1100 Pips, One Not To Miss! The Japanese Yen (JPY) is most likely to continue its bullish trend, as the Dollar Index (DXY) is expected to decline due to the ongoing conflict between Israel and Iran. Historically, JPY and CHF, alongside gold and silver, have been favoured by global investors and remain bullish. Strong fundamentals and technical support further support our analysis.
The 167-169 price region remains a critical point for sellers, where we anticipate significant selling volume. There are two entry points to consider: one near the current price and another slightly further away. Please monitor volume and use smaller time frames for entries.
Our Swing Target is at 154, but you can also target smaller zones once the trade is activated. For instance, set take-profit levels at 164, 160, and finally, at 154.
To encourage and support us, you can like the idea, comment on it, or share it.
Team Setupsfx_
❤️❤️🚀🚀

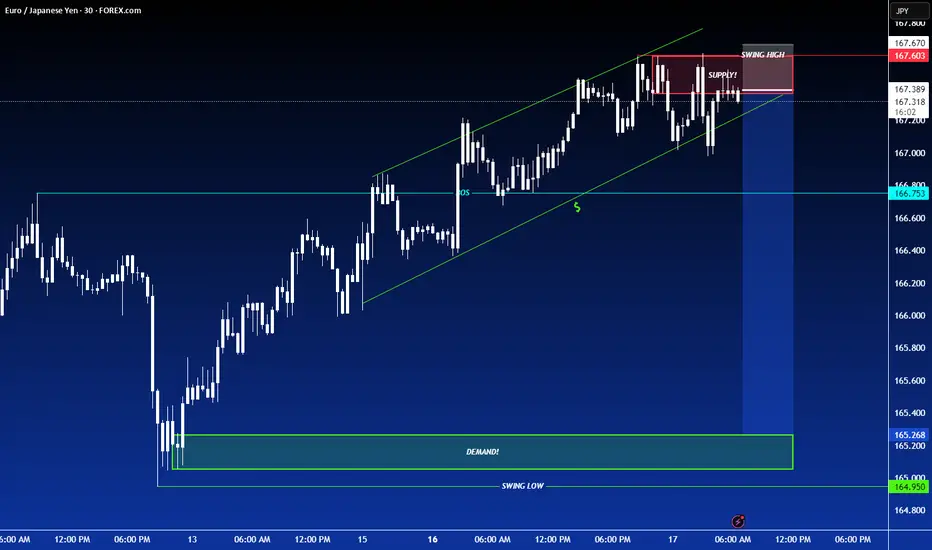
SHORT ON EUR/JPYEJ has created a (Rising Channel) with a (Double Top) at a major resistance zone.
Both Chart Patterns are Bearish Reversal Patterns.
I will be Selling EJ to the next demand level as it seeks out liquidity to the downside for 100-200 pips.
EURJPY Breaks Out From Major Zone, Eyes Higher LevelsEURJPY Update, structure remains bullish
The pair has officially broken above a key resistance zone, showing solid bullish intent. This breakout is even more meaningful when you look at how price has been consistently supported by the long-term rising trendline. Every time price touched this trendline, it bounced with strength — and this time is no different.
The recent move suggests that buyers are firmly in control, and with the structure now pushing above resistance, momentum could continue to build.
As long as EURJPY holds above this breakout zone, the path of least resistance is to the upside.
DYOR, NFA

SHORT ON EUR/JPYOn the 1 min Timeframe EJ has given us a choc (change of character) to the downside with a nice break and retest to a major supply area.
The JPY index is bullish which should cause EJ to fall.
I will be selling EJ to the next level of demand looking to catch 100-200 pips.

EUR/JPY Short🎯 Trade Setup Plan
👇 Aggressive Entry (Riskier)
Sell Limit: 164.90
SL: 165.90
TP1: 160.00
TP2: 157.00
TP3 (optional): 155.00
Use this only if you want to catch the wick, but recognize the higher chance of being swept.
✅ Conservative Entry (Recommended)
Wait for a daily candle close under 162.00 after touching 164. That confirms rejection.
Entry: On next day’s minor retest (e.g., 162.50–163.00)
SL: 165.50 (above recent highs)
TP1: 160.00
TP2: 157.00
TP3: 155.00
Risk: 1–2% depending on confirmation strength
📌 Optional Breakout Plan (In case resistance breaks cleanly)
Buy Stop: 165.60
SL: 164.30
TP: 170.00 (weekly resistance)
Use only if a strong daily close above 165 confirms breakout.

EURJPY SHORT FORECAST Q2 W24 D10 Y25EURJPY SHORT FORECAST Q2 W24 D10 Y25
Professional Risk Managers👋
Welcome back to another FRGNT chart update📈
Diving into some Forex setups using predominantly higher time frame order blocks alongside confirmation breaks of structure.
Let’s see what price action is telling us today! 👀
💡Here are some trade confluences📝
✅Weekly 50 EMA target
✅15' Order block identification
✅Daily Order block rejection
✅Ultimate high short
🔑 Remember, to participate in trading comes always with a degree of risk, therefore as professional risk managers it remains vital that we stick to our risk management plan as well as our trading strategies.
📈The rest, we leave to the balance of probabilities.
💡Fail to plan. Plan to fail.
🏆It has always been that simple.
❤️Good luck with your trading journey, I shall see you at the very top.
🎯Trade consistent, FRGNT X

Technical Analysis: JPY Price Action Near Resistance – Potential📊 Technical Analysis: JPY Price Action Near Resistance – Potential Reversal Ahead? ⚠️
---
🔍 Overview:
This chart illustrates the recent price action of a JPY-based asset (likely a JPY forex pair), currently testing a major resistance zone around the 165.286–165.500 area. The market is reacting sharply at this level, suggesting a possible rejection and correction downward. The setup is marked with well-defined support/resistance levels and potential retracement targets.
---
🟧 Key Zones:
🛑 Resistance Zone (165.286 – 165.500): Price is currently reacting at this overhead supply zone. This level has historically rejected bullish attempts, as seen in previous price action.
🟩 Support Zone (161.302 – 161.550): This demand zone has served as a strong base previously and is marked as the final potential retracement level (labeled "4") in the chart.
---
🔻 Retracement Levels:
Labeled as 1 through 4 in purple lines:
1. Level 1 – 163.948 🟣: Initial minor support; might provide a short-term pause if price pulls back.
2. Level 2 – 162.803 🔄: Mid-level support; watch for consolidation or bounce.
3. Level 3 – 162.091 🧲: Stronger support and possible bounce level.
4. Level 4 – 161.550 🛡️: Key support aligning with historical demand zone. A break below this could signal trend reversal.
---
🔄 Price Projection:
The curved arrow indicates a potential correction from the resistance zone down toward the support levels, especially targeting Zone 4. This move reflects a typical market reaction when price meets strong resistance after a steep rally.
---
📈 Strategic Implications:
For Bulls 🐂: Wait for confirmation of support at any of the retracement levels (especially 3 or 4) before entering.
For Bears 🐻: This is an optimal area to look for short entries, especially if bearish candlestick patterns confirm rejection from the resistance zone.
---
✅ Conclusion:
Price is at a critical decision point near major resistance. A bearish reversal is likely if the resistance holds, with a corrective move toward 161.302–161.550 being the most probable target range. Traders should watch for confirmation signals before committing to positions.
---
📌 Tip: Keep an eye on candlestick patterns and volume at the resistance zone to validate the reversal hypothesis.
