#EURJPY #UPDATE WAVE BIn the daily time and H4, an ascending channel is completing wave B. This corrective wave can be completed in two areas. The first PRZ range or the second red box range, which is 1.618 Fibo and the resistance range and daily supply. After the end of this wave, we should wait for a sharp correction wave C. After completing this wave (b), we will check the range of wave C.
Eurjpysignal

EUR/ JPY !! 25/1/2024 Trendline , touch EMA SELL NOW⭐️ Smart investment, Strong finance
⭐️ Personal comments NOVA:
The price is in a very nice downward trendline, along with touching the EMA, setting up a SELL signal
⭐️ SET UP EUR/ JPY PRICE:
🔥SELL zone: 160.800 - 160.950 SL 161.300
TP1: 160.510
TP2: 160.210
TP3: 159.820
⭐️ Technical analysis:
Based on technical indicators EMA 34, EMA89 and support resistance areas to set up a reasonable SELL order.
⭐️ NOTE:
Note: Nova wishes traders to manage their capital well
- take the number of lots that match your capital
- Takeprofit equal to 4-6% of capital account
- Stoplose equal to 2-3% of capital account
- The winner is the one who sticks with the market the longest

DeGRAM | EURJPY break above / close aboveEURJPY is making higher highs and higher closes on the 4 hourly chart, indicating a bullish trend.
Price rebounded from the reaction zone.
The market broke and closed above the reaction zone, which is the support level.
We expect a breakout of the level, a pullback to it, and then a continuation of the trend since the major trend is bullish.
-------------------
Share your opinion in the comments and support the idea with like. Thanks for your support!

EURJPY Short setupEURJPY looks heavy. It has broken down the main trendline, and i can see bearish divergence on H4 and H1 timeframe. Actually is stuck in a small range, and it looks like it's accumulating to perform an explosive move. 159.000 is a daily support, so i expect the price there as a target for a short

EURJPY: Yen strengthens ahead of Bank of Japan meeting; The markCurrency stability is a hot topic in financial markets today as investors prepare for meetings of major central banks in Japan and Europe. The Japanese yen registered a notable gain, trading at 147.74 yen against the dollar, as markets awaited the Bank of Japan's upcoming monetary policy meeting. The bank is expected to maintain negative interest rates, a stance that has gained further support following Japan's recent earthquake.
The dollar index of the US dollar against a basket of major currencies was little changed at 103.24. Meanwhile, the euro fell slightly to trade at $1.0888, while the pound rose slightly to $1.27095. Investors are also adjusting their expectations for the U.S. Federal Reserve's next interest rate move. The interest rate cut was originally expected to occur in early March, but the forecast was pushed back to May due to strong U.S. economic indicators. This suggests that the Fed may take a more cautious approach to monetary policy changes, despite previous expectations for rate cuts.
All eyes are also on the European Central Bank (ECB), which will discuss its own monetary policy on Thursday. Given the impact on global supply chains, particularly those that affect trade routes through the Red Sea, the ECB may have to balance the need to support economic growth with the pressures of external trade challenges. The turmoil has led to a reassessment of the timing of potential interest rate cuts by the ECB as it considers the impact of these issues on the broader economic situation.

EURJPY SHORT
The analysis of the pair suggests that the upward correction is close to completion and this week we can expect the continuation of the downward movement. All this means that it is time to cover longs and take short positions.
Recommendations.
1. Levels for short entry: 161.50; 163.40.
2. Target: 156.00
3. Pay attention to the size of swaps on short positions of your broker. On this pair, the swap can be strongly negative. In our case, the swap is 0.5 p., which is acceptable.
4. Now you need to be very careful with long positions and be sure to insure yourself with a stop order.
5. Take a closer look at the situation, as it is a shame to miss such an opportunity.

EURJPY - Long after filling the imbalance ✅Hello traders!
‼️ This is my perspective on EURJPY.
Technical analysis: We can see here that price changed the character and started to form higher lows and higher highs, so I look for a long position. I want price to make a retracement to fill the imbalance lower and then to reject from institutional big figure 159.000
Like, comment and subscribe to be in touch with my content!

DeGRAM | EURJPY completion AB=CD patternEURJPY is making higher highs and higher closes, indicating a bullish trend.
Price broke and closed above the resistance level that became support.
The market is creating an AB=CD pattern.
We expect a breakout of the level, a pullback to it, and then a continuation of the trend.
-------------------
Share your opinion in the comments and support the idea with like. Thanks for your support!
EURJPY: Latest information on market trends in the Asian session
There wasn't much news of note on the day, except for some news regarding the energy market.
Qatar has reportedly suspended LNG transport through the Bab el-Mandeb Strait (Suez Canal). Houthis fire cruise missile at US Navy ship
Oil prices have risen, but not by a large amount
Political news:
William Lai was elected president of Taiwan in Saturday's election, despite the Democratic Progressive Party (DPP) losing a majority of seats in parliament. Senate Democratic Leader Schumer said Congressional leadership approved the temporary funding measure.
Forex market:
The People's Bank of China this month kept its medium-term financing (MLF) interest rate unchanged at 2.5%, despite widespread (but conflicting) expectations that it would cut it by 10 basis points. . This comes despite China's continued deflation and reflects the People's Bank of China's concerns that a weaker yuan could lead to capital outflows. The dollar/yen exchange rate rose during the session, weighing on the yen as the two-year Japanese government bond yield fell below zero. The US dollar has weakened against the euro, pound and Canadian dollar. The Australian dollar and New Zealand dollar underperformed. Offshore yuan gains during session

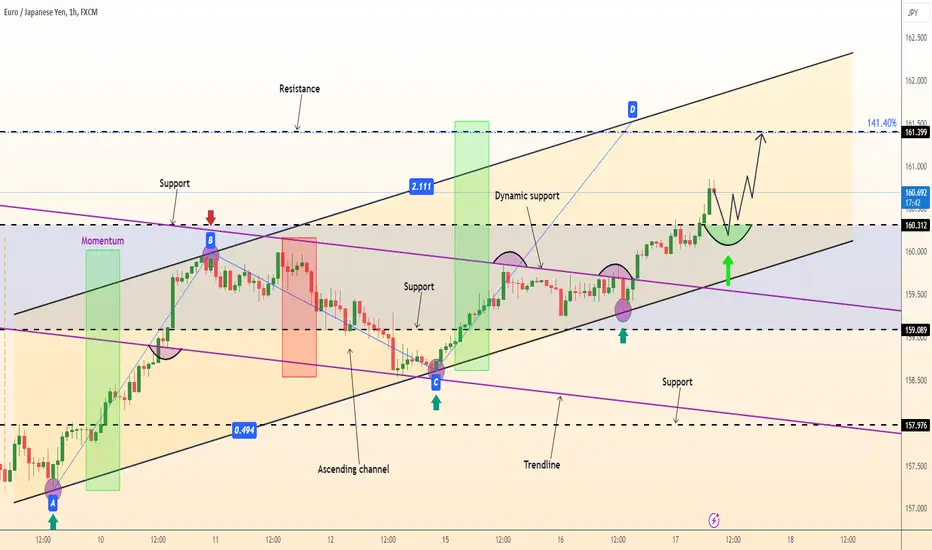
EURJPY : Long Trade , 4hHello traders, we want to check the EURJPY chart. The price is in an ascending channel and after breaking the specified resistance area, it has pulled back to this level again. We expect this level to maintain the upward trend of the price and the price will grow up to around 161.300. Good luck.

EURJPY SELL I Potential Downside from Resistance|AnalysisHello Traders, here is the full analysis.
Watch strong action at the current levels for SELL . GOOD LUCK! Great SELL opportunity EURJPY
I still did my best and this is the most likely count for me at the moment.
Support the idea with like and follow my profile TO SEE MORE.
Traders, if you liked this idea or if you have your own opinion about it, write in the comments. I will be glad 🤝
Patience is the If You Have Any Question, Feel Free To Ask 🤗
Just follow chart with idea and analysis and when you are ready come in THE GROVE | VIP GROUP, earn more and safe, wait for the signal at the right moment and make money with us💰

EURJPY → Bulls consolidate gains- The EUR/JPY is seen at 159.40 with 0.30% losses.
- The cross rallied 1.30% on Wednesday, towards 160.00, it highest since the beginning of December.
- Daily chart indicators reveal a stagnant yet optimistic RSI and a leveled-off MACD histogram, hinting at a steady buying momentum.
- Charts suggest bullish control overall despite consolidation in four-hour chart indicators.

EURJPY 11/01Pair : EURJPY ( Euro / Japanese Yen )
Description :
Rising Wedge as an Corrective Pattern in Long Time Frame with the Rejection from the Upper Trend Line. Completed " 1234 " Impulsive Wave and Completed the Break of Structure and Retracement with Strong Divergence

EURJPY - Long opportunity ✅Hello traders!
‼️ This is my perspective on EURJPY.
Technical analysis: We can see here that price changed the character and started to form higher lows and higher highs, so I look for a long position. I want price to make a retracement to fill the imbalance lower and then to reject from bullish order block.
Like, comment and subscribe to be in touch with my content!

EURJPY: Japanese yen suffers big loss due to doubts about Bank o
Asian trading volumes on Monday were slightly affected by the Japanese holiday. The yen rose 0.1% after falling to nearly 145 yen to the dollar on Friday.
The earthquake that hit central Japan also caused the Japanese currency to suffer its worst weekly decline since late 2022. Post-disaster economic stimulus and recovery measures could delay the Bank of Japan's plans to start tightening its ultra-easy monetary policy, which is expected to put strong pressure on the yen.
The current focus is on Tokyo's December CPI inflation data, which is often used as an indicator of national inflation in Japan.

EURJPY → Bulls regain 157.00- EUR/JPY's marginal decline influenced risk aversion, as the pair fluctuates within a narrow range.
- Downward trend persists, with potential supports at 157.03, 156.42 and 156.00 level.
- Buyers aim to overcome hurdles at 158.00 and 159.00.


EURJPY H2 / LOOKING FOR A SHORT TRADE OPPORTUNITY 📉Hello Traders!
This is my idea related to EURJPY H2. I see a retracement from the resistance level of the channel and also a small retracement (15M - 30M), to close the imbalance and to react from OB. Now I see a good opportunity to execute a short trade until the price of 155.800.
Traders, if you liked my idea or if you have a different vision related to this trade, write in the comments. I will be glad to see your perspective.
____________________________________
Follow, like, and comment to see my content:
www.tradingview.com

EUR/JPY Sell Idea based on Price Channel reversalHello traders and the entire Tradingview community! Hope you had a great weekend!
Taking a look at the EURJPY, we can see a price channel as indicated in my chart.
The price channel has been working for more than 4 weeks now. As you can already see,
price has reversed after hitting the upper trend line of the channel many times in the past.
This time too, EJ is showing signs of reversal after hitting the upper TL of the channel.
I am already holding sell positions in EJ@158.50 and I expect EJ to fall further in the
next few days.

EURJPY H4 / TRADE ANALYSIS, LONG OPPORTUNITY 📈 Hello Traders!
This is my idea related to EURJPY H4. I expect a retracement until the resistance level at the price of 154.000 and after that a Bullish move until the price of 158.400.
Traders, if you liked my idea or if you have a different vision related to this trade, write in the comments. I will be glad to see your perspective.
____________________________________
Follow, like, and comment to see my content:
www.tradingview.com

DeGRAM | EURJPY double testEURJPY is testing the resistance. It tested the resistance twice.
It created a false breakout of the level at 158.500.
Price movement is gaining momentum on 1-hourly timeframe, and we might see a sharp bearish move.
We expect a pullback and bearish move since it printed the pinbar at resistance.
-------------------
Share your opinion in the comments and support the idea with like. Thanks for your support!

EURJPYEURJPY BUY
TP in the chart
SL in the chart
Good luck guys
Note: To reduce the risk on your balance
you have to use only 2% of your balance.
-
-
-
-
-
-❤️If you have any questions, please, ask me in the comment section.
Please, support my work with like, thank you!❤️.

DeGRAM | EURJPY opportunity to shortEURJPY tested the upper border of the descending channel.
The market fell below the 157.500 resistance level, which is essentially a false breakout.
Price action is printing lower lows and lower closes, indicating a bearish trend on the 4-hourly chart.
We expect a bearish move, breaking through the ascending channel.
-------------------
Share your opinion in the comments and support the idea with like. Thanks for your support!
