EURJPY buy signal. Don't forget about stop-loss.
Write in the comments all your questions and instruments analysis of which you want to see.
Friends, push the like button, write a comment, and share with your mates - that would be the best THANK YOU.
P.S. I personally will open entry if the price will show it according to my strategy.
Always make your analysis before a trade
Eurjpysignal

EURJPY - Short active !!Hello traders!
‼️ This is my perspective on EURJPY.
Technical analysis: Here we are in a bearish market structure from 4H timeframe perspective, so I look for a short. I expect bearish continuation after price filled the gap. As well we have hidden divergence for sell.
Like, comment and subscribe to be in touch with my content!

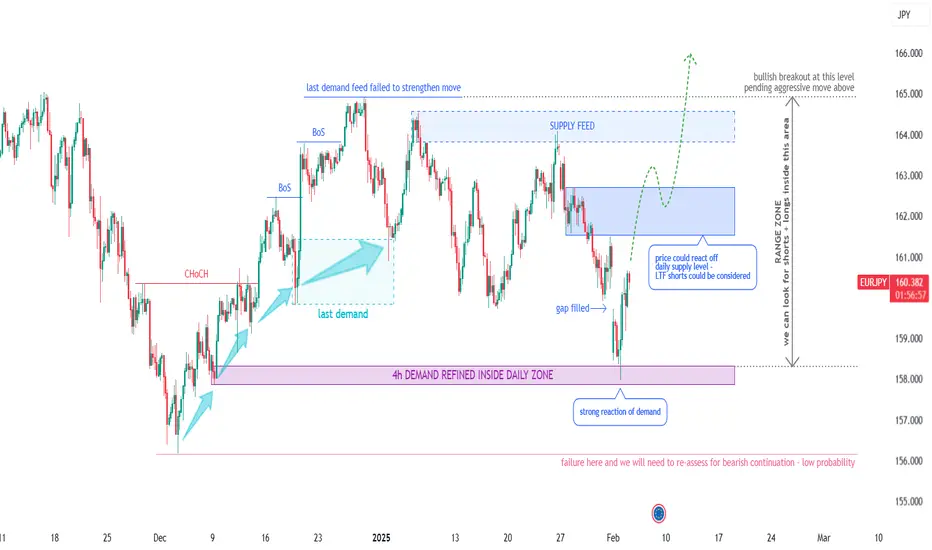
EURJPY Potential Longs - Short & Long Term (Technical Analysis)Technical Outlook:
Looking at previous price movement, we see it's been trending up since August 2024, with the last reaccumulation phase ending in early 2024. We recently saw a demand chain, but the last push couldn't quite hit new highs. Supply then took over, driving the price back down to a daily demand level. At this point, we've seen some strong bullish reactions on the lower timeframes, which is interesting and here's why -
Potential Scenarios & Probabilities:
Scenario 1 (High Probability) – Demand should regain control, leading to a bullish breakout.
Scenario 2 (Medium Probability) - Price could range within the ascending channel for a while.
Scenario 3 (Low Probability) – The bulls might disengage, resulting in a bearish break and continuation thereafter.
Trading Considerations:
Price is currently in a discounted zone within the ascending channel (158.000 – 168.000) . We can look for trading opportunities within this range, focusing on strong supply and demand areas, anticipating the eventual bullish breakout. A long position closer to the bottom of the range could turn into a swing trade. If you're trading inside the range on lower time frames, it's smart to keep an eye on volume, overbought/oversold levels, and relative currency strength.
Final Notes:
With the price moving sideways for a good six months, range trading is definitely a possibility. But the real goal is to catch that bullish breakout when it happens, and it looks like it's getting close. As always, manage your risk carefully, and don't hesitate to take the trade when the setup is right – assuming you've got a solid plan and a clear target in mind.
OANDA:EURJPY
DeGRAM | EURJPY got out from the channelEURJPY is under an ascending channel above the trend lines.
The price is moving from the upper boundary of the channel and resistance level.
The chart formed a harmonic pattern, exited the channel and then fell under the support level, which coincides with the 50% retracement level.
We expect the decline to continue after consolidation under the trend line.
-------------------
Share your opinion in the comments, and support the idea with a like. Thanks for your support!

euraud analysis elliot. Don't forget about stop-loss.
Write in the comments all your questions and instruments analysis of which you want to see.
Friends, push the like button, write a comment, and share with your mates - that would be the best THANK YOU.
P.S. I personally will open entry if the price will show it according to my strategy.
Always make your analysis before a trade

EURJPY buy signal. Don't forget about stop-loss.
Write in the comments all your questions and instruments analysis of which you want to see.
Friends, push the like button, write a comment, and share with your mates - that would be the best THANK YOU.
P.S. I personally will open entry if the price will show it according to my strategy.
Always make your analysis before a trade

eurjpy buy signal. Don't forget about stop-loss.
Write in the comments all your questions and instruments analysis of which you want to see.
Friends, push the like button, write a comment, and share with your mates - that would be the best THANK YOU.
P.S. I personally will open entry if the price will show it according to my strategy.
Always make your analysis before a trade

EURJPY Bearish Bias!
HI,Traders !
EUR-JPY has Heading for retest a
Horizontal resistance
Of 164.677 and as the
Pair is locally overbought
We will be expecting a
Local bearish correction !
Comment and subscribe to help us grow!

DeGRAM | EURJPY fixed over the channelEURJPY is above the descending channel between the trend lines.
The price is moving from the dynamic support and has already consolidated above the descending channel.
The chart retains the harmonic pattern and is now testing the 62% retracement level.
We expect the growth to continue after consolidation above the resistance level.
-------------------
Share your opinion in the comments, and support the idea with a like. Thanks for your support!

EURJPY LongHi Everyone,
Hope you're ok. Here is our signal for EURJPY. I hope that it brings profit for you all.
We want the 15 minute candle to close above the entry, and then respect the entry. Then we will enter.
RiskReward is essential. If you are blowing an account, only once, you are doing something wrong. Probably your lot size is too big. Take the time to learn.
EURJPY Buy 🦇
📈Entry: 162.160
⚠️SL: 160.435
✔️TP1: 163.899
✔️TP2: 165.902
✔️TP3: 168.548
Happy trading hope you all make lovely profit. Drop me a like if you do.
Best wishes

DeGRAM | EURJPY rebound from the trend lineEURJPY is in a descending channel between the trend lines.
The chart has formed a harmonic pattern.
The price is moving from the lower boundary of the channel and dynamic support.
We expect a rebound.
-------------------
Share your opinion in the comments, and support the idea with a like. Thanks for your support!

EURJPY - Short from bearish OB !!Hello traders!
‼️ This is my perspective on EURJPY.
Technical analysis: Here we are in a bearish market structure from 4H timeframe perspective, so I look for a short. I want price to go a little bit higher to fulfill the imbalance and then to reject from bearish OB.
Fundamental news: On Friday (GMT+2) we will see results of Interest Rate in Japan, news with high impact on currency.
Like, comment and subscribe to be in touch with my content!

EURJPY Bearish Breakout!
HI,Traders !
EUR-JPY broke the rising
Support line and the breakout
Is confirmed So after the retest strong horizontal
Resistance is ahead at 162.291 we will so we are
Bearish biased and we Will be expecting a
Further move down !
Comment and subscribe to help us grow!

EUR/JPY AnalysisTechnically EUR/JPY is looking bearish in 4 hour timeframe.
You can see chart for more understanding.
OANDA:EURJPY

EUR/JPY "The Dragon" Forex Market Heist Plan on Bullish🌟Hi! Hola! Ola! Bonjour! Hallo!🌟
Dear Money Makers & Robbers, 🤑 💰
Based on 🔥Thief Trading style technical and fundamental analysis🔥, here is our master plan to heist the EUR/JPY "The Dragon" Forex market. Please adhere to the strategy I've outlined in the chart, which emphasizes long entry. Our aim is the high-risk Red Zone. Risky level, overbought market, consolidation, trend reversal, trap at the level where traders and bearish robbers are stronger. 👀 Be wealthy and safe trade.💪🏆🎉
Entry 📈 : You can enter a Bull trade after the MA Breakout,
however I advise placing Buy limit orders within a 15 or 30 minute timeframe. Entry from the most recent or closest low or high level should be in retest.
Stop Loss 🛑: Using the 2h period, the recent / nearest low or high level.
Goal 🎯: 167.000 (or) Escape before the target
Scalpers, take note : only scalp on the Long side. If you have a lot of money, you can go straight away; if not, you can join swing traders and carry out the robbery plan. Use trailing SL to safeguard your money 💰.
Warning⚠️ : Our heist strategy is incompatible with Fundamental Analysis news 📰 🗞️. We'll wreck our plan by smashing the Stop Loss 🚫🚏. Avoid entering the market right after the news release.
Fundamental Outlook 📰🗞️
Based on the fundamental analysis, the EUR/JPY pair is expected to move in a bullish trend, with the Euro expected to strengthen against the Yen. The Eurozone's improving economic indicators, accommodative monetary policy, and expansionary fiscal policy are expected to support the Euro, while Japan's slowing economic growth, low inflation rate, and contractionary fiscal policy are expected to weaken the Yen.
Economic Indicators: The Eurozone's economic indicators, such as GDP growth rate, inflation rate, and unemployment rate, are expected to improve in the coming months.
Monetary Policy: The European Central Bank (ECB) is expected to maintain its accommodative monetary policy, which could support the Euro.
Fiscal Policy: The Eurozone's fiscal policy is expected to be expansionary, which could support economic growth.
Trade Balance: The Eurozone's trade balance is expected to improve, which could support the Euro.
Interest Rates: The ECB is expected to keep interest rates low, which could support the Euro.
Japan's Economic Indicators
Economic Growth: Japan's economic growth is expected to slow down in the coming months.
Inflation Rate: Japan's inflation rate is expected to remain low, which could weaken the Yen.
Monetary Policy: The Bank of Japan (BOJ) is expected to maintain its accommodative monetary policy, which could weaken the Yen.
Fiscal Policy: Japan's fiscal policy is expected to be contractionary, which could weaken the economy.
Trade Balance: Japan's trade balance is expected to deteriorate, which could weaken the Yen.
Comparative Analysis
GDP Growth Rate: The Eurozone's GDP growth rate is expected to be higher than Japan's.
Inflation Rate: The Eurozone's inflation rate is expected to be higher than Japan's.
Interest Rates: The ECB's interest rates are expected to be higher than the BOJ's.
Trade Balance: The Eurozone's trade balance is expected to be better than Japan's.
Please note that this is a general analysis and not personalized investment advice. It's essential to consider your own risk tolerance and market analysis before making any investment decisions.
Take advantage of the target and get away 🎯 Swing Traders Please reserve the half amount of money and watch for the next dynamic level or order block breakout. Once it is resolved, we can go on to the next new target in our heist plan.
Keep in mind that these factors can change rapidly, and it's essential to stay up-to-date with market developments and adjust your analysis accordingly.
💖Supporting our robbery plan will enable us to effortlessly make and steal money 💰💵 Tell your friends, Colleagues and family to follow, like, and share. Boost the strength of our robbery team. Every day in this market make money with ease by using the Thief Trading Style.🏆💪🤝❤️🎉🚀
I'll see you soon with another heist plan, so stay tuned 🫂

eurjpy buy signal. Don't forget about stop-loss.
Write in the comments all your questions and instruments analysis of which you want to see.
Friends, push the like button, write a comment, and share with your mates - that would be the best THANK YOU.
P.S. I personally will open entry if the price will show it according to my strategy.
Always make your analysis before a trade

EUR/JPY "The Yuppy" Forex Market Heist Plan on Bullish🌟Hi! Hola! Ola! Bonjour! Hallo!🌟
Dear Money Makers & Robbers, 🤑 💰
Based on 🔥Thief Trading style technical and fundamental analysis🔥, here is our master plan to heist the EUR/JPY "The Yuppy" Forex market. Please adhere to the strategy I've outlined in the chart, which emphasizes long entry. Our aim is the high-risk Red Zone. Risky level, overbought market, consolidation, trend reversal, trap at the level where traders and bearish robbers are stronger. 👀 Be wealthy and safe trade.💪🏆🎉
Entry 📈 : You can enter a Bull trade at any point,
however I advise placing Buy limit orders within a 15 or 30 minute timeframe. Entry from the most recent or closest low or high level should be in retest.
Stop Loss 🛑: Using the 30min period, the recent / nearest low or high level.
Goal 🎯: 165.000
Scalpers, take note : only scalp on the Long side. If you have a lot of money, you can go straight away; if not, you can join swing traders and carry out the robbery plan. Use trailing SL to safeguard your money 💰.
Warning⚠️ : Our heist strategy is incompatible with Fundamental Analysis news 📰 🗞️. We'll wreck our plan by smashing the Stop Loss 🚫🚏. Avoid entering the market right after the news release.
Fundamental Outlook 📰🗞️
Based on the fundamental analysis, I would conclude that the EUR/JPY (Euro/Japanese Yen) pair is: Bullish
Reasons:
Interest rate differential: The European Central Bank's (ECB) interest rate (2.50%) is higher than the Bank of Japan's (BoJ) interest rate (0.10%), making the EUR more attractive to investors.
Economic growth: The Eurozone's economy is expected to grow at a faster pace than Japan's, driven by the strong labor market and increasing business investment.
Monetary policy: The ECB's hawkish stance and potential interest rate hikes are expected to support the EUR, while the BoJ's dovish stance and potential monetary policy easing could weaken the JPY.
Trade balance: The Eurozone's trade balance is expected to remain in surplus, driven by the strong demand for European exports, which could support the EUR.
Japanese economic slowdown: Japan's economy is expected to slow down, driven by the aging population and decreasing labor force, which could lead to a decline in the JPY.
However, it's essential to consider the following risks:
Global economic slowdown: A slowdown in global economic growth could reduce demand for the EUR and drive down prices.
Eurozone debt crisis: The Eurozone's debt crisis could resurface, potentially weakening the EUR and driving down prices.
Trade tensions: Escalating trade tensions between the Eurozone and other countries could negatively impact the EUR and drive down prices.
Bullish Scenario:
Interest rate differential, economic growth, and monetary policy support the EUR
Japanese economic slowdown and trade balance support the bullish case
Key Fundamental Indicators:
Eurozone GDP growth: 1.5% (2023 estimate)
Japan GDP growth: 0.5% (2023 estimate)
ECB interest rate: 2.50%
BoJ interest rate: 0.10%
Eurozone trade balance: €20 billion (2023 estimate)
Japan trade balance: ¥500 billion (2023 estimate)
Please note that this is a general analysis and not personalized investment advice. It's essential to consider your own risk tolerance and market analysis before making any investment decisions.
Take advantage of the target and get away 🎯 Swing Traders Please reserve the half amount of money and watch for the next dynamic level or order block breakout. Once it is resolved, we can go on to the next new target in our heist plan.
Keep in mind that these factors can change rapidly, and it's essential to stay up-to-date with market developments and adjust your analysis accordingly.
💖Supporting our robbery plan will enable us to effortlessly make and steal money 💰💵 Tell your friends, Colleagues and family to follow, like, and share. Boost the strength of our robbery team. Every day in this market make money with ease by using the Thief Trading Style.🏆💪🤝❤️🎉🚀
I'll see you soon with another heist plan, so stay tuned 🫂

EURJPY Bullish Trend: Key Levels, Entry Points & Targets👀 👉 The EURJPY pair has been trending bullish, which is evident on the daily timeframe. In the video, I discuss the trend, highlight key support and resistance levels where I’m considering entries, and outline my target and stop-loss levels. ⚠️ This content is for educational purposes only and does not constitute financial advice.


EURJPY BUY | Potential Upsides | LONGEURJPY is moving in an UP trend channel.
The chart broke through the dynamic Resistance line, which now acts as support.
We expect a decline in the channel after testing the current level which suggests that the price will continue to rise
Hello Traders, here is the full analysis.
I think we can soon see more fall from this range! GOOD LUCK! Great BUY opportunity EURJPY
I still did my best and this is the most likely count for me at the moment.
-------------------
Traders, if you liked this idea or if you have your own opinion about it, write in the comments. I will be glad

DeGRAM | EURJPY breakout of the trend lineEURJPY is in an ascending channel above the trend line.
The chart broke the descending structure, consolidated above the trend line and approached the resistance level.
We expect the price growth to continue in case of successful consolidation above the resistance.
-------------------
Share your opinion in the comments, and support the idea with a like. Thanks for your support!

EUR/JPY "The Yuppy" Forex Market Bullish Heist Plan🌟Hi! Hola! Ola! Bonjour! Hallo!🌟
Dear Money Makers & Robbers, 🤑 💰
Based on 🔥Thief Trading style technical analysis🔥, here is our master plan to heist the EUR/JPY "The Yuppy" Forex market. Please adhere to the strategy I've outlined in the chart, which emphasizes long entry. Our aim is the high-risk Red Zone. Risky level, overbought market, consolidation, trend reversal, trap at the level where traders and bearish robbers are stronger. 👀 So Be Careful, wealthy and safe trade.💪🏆🎉
Entry 📈 : You can enter a trade at any point,
however I advise placing Buy limit orders within a 15 or 30 minute timeframe. Entry from the most recent or closest low level should be in retest.
Stop Loss 🛑: Using the 4H period, the recent / nearest low or high level.
Goal 🎯: 166.500
Scalpers, take note : only scalp on the Short side. If you have a lot of money, you can go straight away; if not, you can join swing traders and carry out the robbery plan. Use trailing SL to safeguard your money 💰.
Warning⚠️ : Our heist strategy is incompatible with Fundamental Analysis news 📰 🗞️. We'll wreck our plan by smashing the Stop Loss 🚫🚏. Avoid entering the market right after the news release.
Take advantage of the target and get away 🎯 Swing Traders Please reserve the half amount of money and watch for the next dynamic level or order block breakout. Once it is resolved, we can go on to the next new target in our heist plan.
💖Supporting our robbery plan will enable us to effortlessly make and steal money 💰💵 Tell your friends, Colleagues and family to follow, like, and share. Boost the strength of our robbery team. Every day in this market make money with ease by using the Thief Trading Style.🏆💪🤝❤️🎉🚀
I'll see you soon with another heist plan, so stay tuned 🫂
