EUR/NZD "Euro vs Kiwi" Forex Market Bearish Heist Plan🌟Hi! Hola! Ola! Bonjour! Hallo!🌟
Dear Money Makers & Robbers, 🤑 💰
Based on 🔥Thief Trading style technical and fundamental analysis🔥, here is our master plan to heist the EUR/NZD "Euro vs Kiwi" Forex Market. Please adhere to the strategy I've outlined in the chart, which emphasizes short entry. Our aim is the high-risk Green Zone. Risky level, oversold market, consolidation, trend reversal, trap at the level where traders and bullish thieves are getting stronger. 🏆💸Book Profits Be wealthy and safe trade.💪🏆🎉
Entry 📈 : "The vault is wide open! Swipe the Bearish loot at any price - the heist is on!
however I advise to Place Sell limit orders within a 15 or 30 minute timeframe. Entry from the most recent or closest low or high level should be in retest.
Stop Loss 🛑: Thief SL placed at 1.84000 (swing Trade Basis) Using the 4H period, the recent / swing high or low level.
SL is based on your risk of the trade, lot size and how many multiple orders you have to take.
Target 🎯: 1.80400 (or) Escape Before the Target
Scalpers, take note 👀 : only scalp on the Short side. If you have a lot of money, you can go straight away; if not, you can join swing traders and carry out the robbery plan. Use trailing SL to safeguard your money 💰.
📰🗞️Fundamental, Macro, COT, Sentimental Outlook:
EUR/NZD "Euro vs Kiwi" Forex Market is currently experiencing a Bearish trend., driven by several key factors.
🔱 Fundamental Analysis
New Zealand Trade Balance: July trade balance: -NZ$963M monthly, -NZ$9,290M annualized.
Chinese Loan Prime Rates: August 1-Year Loan Prime Rate: 3.35%, 5-Year Loan Prime Rate: 3.85%.
German PPI: July PPI: +0.2% monthly, -0.8% annualized.
🔱 Macroeconomic Trends
Current Macroeconomic Trends
- GDP Growth Rate: Eurozone's GDP growth rate is expected to slow down in the coming months, while New Zealand's economy is anticipated to remain stable.
- Inflation Rate: Eurozone's inflation rate is currently at 1.0% annualized, while New Zealand's inflation rate is at 1.5% annualized.
- Unemployment Rate: Eurozone's unemployment rate stands at 7.5%, whereas New Zealand's unemployment rate is at 3.9%.
- Interest Rates: European Central Bank's (ECB) main refinancing rate is 0.0%, and Reserve Bank of New Zealand's (RBNZ) official cash rate is 1.5%.
Upcoming Macroeconomic Events
- Federal Reserve Rate Decision: The upcoming Federal Reserve rate decision may impact EUR/NZD.
- European Central Bank Rate Decision: ECB's rate decision will also influence the pair.
- New Zealand GDP Growth Rate: Q3 GDP growth rate announcement may affect NZD.
🔱 COT Report
The latest COT report shows that speculative traders are net short on the EUR/NZD pair, indicating a bearish sentiment
🔱 Technical Analysis
Trend Lines: Descending Tenkan-sen, ascending Kijun-sen.
Chart Patterns: Bearish harmonic pattern.
Moving Averages:
50-Day SMA: 1.7945
100-Day SMA: 1.8051
200-Day SMA: 1.8335
Relative Strength Index (RSI): 42.12 (neutral).
Bollinger Bands: Upper: 1.8232, Lower: 1.7632.
MACD: Bearish crossover.
Stochastic Oscillator: Oversold region.
Fibonacci Levels: 23.6% retracement at 1.8115.
🔱 Positioning Data
Institutional Traders: 55% long, 45% short.
Retail Traders: 70% short, 30% long.
Market Sentiment: Bearish (60%).
🔱 Market Outlook
- Market Sentiment: Bearish
- Institutional Traders: 42% bullish, 30% bearish, 28% neutral
- Banks: 40% bullish, 32% bearish, 28% neutral
- Hedge Funds: 45% bullish, 27% bearish, 28% neutral
- Corporate Traders: 38% bullish, 35% bearish, 27% neutral
- Retail Traders: 48% bearish, 25% bullish, 27% neutral
🔱 Overall Outlook
The overall outlook for the EUR/NZD pair is bearish. The pair has broken out of a triangle pattern, and speculative traders are net short. Institutional traders are positioning themselves for a potential drop, and retail traders are also bearish.
Eurnzdidea

EUR/NZD "Euro vs Kiwi" Forex Market Bearish Heist Plan🌟Hi! Hola! Ola! Bonjour! Hallo!🌟
Dear Money Makers & Robbers, 🤑 💰🐱👤🐱🏍
Based on 🔥Thief Trading style technical and fundamental analysis🔥, here is our master plan to heist the EUR/NZD "Euro vs Kiwi" Forex Market. Please adhere to the strategy I've outlined in the chart, which emphasizes short entry. Our aim is the high-risk Green Zone. Risky level, oversold market, consolidation, trend reversal, trap at the level where traders and bullish robbers are stronger. 🏆💸Book Profits Be wealthy and safe trade.💪🏆🎉
Entry 📈 : "The vault is wide open! Swipe the Bearish loot at any price - the heist is on!
however I advise placing Sell limit orders within a 15 or 30 minute timeframe. Entry from the most recent or closest low or high level should be in retest.
Stop Loss 🛑: Thief SL placed at 1.83500 (swing Trade Basis) Using the 4H period, the recent / swing high or low level.
SL is based on your risk of the trade, lot size and how many multiple orders you have to take.
Target 🎯: 1.80000 (or) Escape Before the Target
🧲Scalpers, take note 👀 : only scalp on the Short side. If you have a lot of money, you can go straight away; if not, you can join swing traders and carry out the robbery plan. Use trailing SL to safeguard your money 💰.
📰🗞️Fundamental, Macro, COT, Sentimental Outlook:
The EUR/NZD "Euro vs Kiwi" Forex Market is currently experiencing a Bearish trend., driven by several key factors.
⭐Fundamental Analysis
Economic Indicators: Eurozone's GDP growth rate expected to slow down to 1.2% in 2025
Monetary Policy: European Central Bank (ECB) expected to maintain dovish stance
Trade Balance: Eurozone's trade balance expected to remain in surplus
Inflation Rate: Eurozone's inflation rate expected to rise to 2.0% in 2025
⭐Macro Economics
Global Economic Trends: Ongoing global economic recovery expected to drive up demand for commodities
Commodity Prices: Commodity prices expected to rise by 5% in 2025
Interest Rates: Central banks expected to maintain low interest rates in 2025
Currency Flows: Currency flows expected to remain stable, with no significant changes in currency exchange rates
⭐Intermarket Analysis
Correlation Analysis: EUR/NZD pair positively correlated with EUR/USD pair
Commodity Analysis: EUR/NZD pair negatively correlated with gold
Equity Analysis: EUR/NZD pair positively correlated with Euro Stoxx 50 index
⭐COT Data
Non-Commercial Traders (Institutional):
Net Short Positions: 45%
Open Interest: 120,000 contracts
Commercial Traders (Companies):
Net Long Positions: 35%
Open Interest: 60,000 contracts
Non-Reportable Traders (Small Traders):
Net Short Positions: 20%
Open Interest: 30,000 contracts
⭐Technical Analysis
Trend: Bearish trend
Support Zone: 1.80000 - 1.81000
Resistance Zone: 1.84000
RSI(7): 24.55, indicating oversold conditions
STOCH(5,3,3): 20.56, indicating a potential reversal
⭐Sentimental Analysis
Institutional Sentiment: 45% bullish, 55% bearish
Retail Sentiment: 50% bullish, 50% bearish
Market Mood: Bearish, with a sentiment score of -0.5
⭐Market News and Events
Economic Indicators: Monitor economic indicators, such as GDP growth rates and inflation rates, to gauge the overall health of the economy.
Central Bank Decisions: Keep an eye on central bank decisions, such as interest rate changes, to anticipate potential market movements.
Geopolitical Events: Monitor geopolitical events, such as trade tensions and elections, to identify potential market risks.
⭐Next Move Prediction
Based on the analysis, the next move prediction is:
Short-term (1-3 days): Bearish, targeting 1.80000
Medium-term (1-2 weeks): Neutral, with a potential reversal to 1.84000
Long-term (1-3 months): Bearish, targeting 1.75000
⭐Positioning
Risk-Reward Ratio: Aim for a risk-reward ratio of 1:3 or higher
Position Sizing: Optimal position size is 2% of the trading account, based on a risk-reward ratio of 1:2
Stop-Loss: Set a stop-loss above 1.8350 for bearish trades
⚠️Trading Alert : News Releases and Position Management 📰 🗞️ 🚫🚏
As a reminder, news releases can have a significant impact on market prices and volatility. To minimize potential losses and protect your running positions,
we recommend the following:
Avoid taking new trades during news releases
Use trailing stop-loss orders to protect your running positions and lock in profits
📌Please note that this is a general analysis and not personalized investment advice. It's essential to consider your own risk tolerance and market analysis before making any investment decisions.
📌Keep in mind that these factors can change rapidly, and it's essential to stay up-to-date with market developments and adjust your analysis accordingly.
💖Supporting our robbery plan will enable us to effortlessly make and steal money 💰💵 Tell your friends, Colleagues and family to follow, like, and share. Boost the strength of our robbery team. Every day in this market make money with ease by using the Thief Trading Style.🏆💪🤝❤️🎉🚀
I'll see you soon with another heist plan, so stay tuned 🤑🐱👤🤗🤩

EUR/NZD AnalysisEUR/NZD is in the bullish scenario, and I am seeing a retracement in it onto the marked zone, and after it will go again in the upword direction

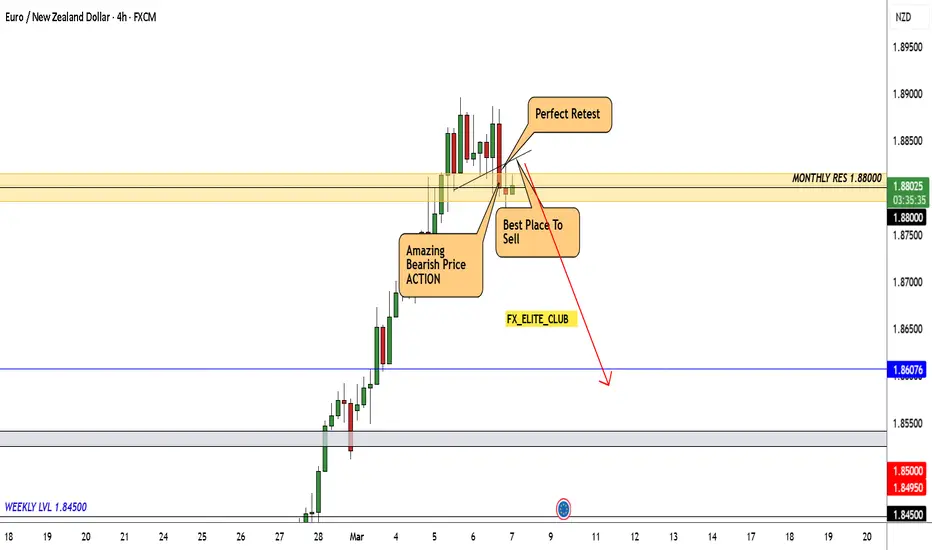
EUR/NZD Finally Gave A BEARISH P.A,Let`s Sell It To Get 250 PipsHere is my opinion about EUR/NZD , Pre starting giving amazing bearish price action and finally we have a good breakout and head and shoulders pattern in 2h time frame , i`m selling this pair and targeting 250 pips .
This Is An Educational + Analytic Content That Will Teach Why And How To Enter A Trade
Make Sure You Watch The Price Action Closely In Each Analysis As This Is A Very Important Part Of Our Method
Disclaimer : This Analysis Can Change At Anytime Without Notice And It Is Only For The Purpose Of Assisting Traders To Make Independent Investments Decisions.
eurnzd sell signal. Don't forget about stop-loss.
Write in the comments all your questions and instruments analysis of which you want to see.
Friends, push the like button, write a comment, and share with your mates - that would be the best THANK YOU.
P.S. I personally will open entry if the price will show it according to my strategy.
Always make your analysis before a trade

EURNZD Will Keep Falling!
HI,Traders !
EUR-NZD is going down
And the pair broke the
Key horizontal level
Of 1.827184 so we are
Bearish biased and we
Will be expecting a
Further move down !
Comment and subscribe to help us grow !

EURNZD AnalysisEURNZD Analysis
The EURNZD pair is currently in a bearish trend on the daily time frame, making it a favorable candidate for short positions. Notably, on the 4-hour chart, the pair has broken out of a sideways rectangle pattern, retested the breakout level, and is now expected to move lower toward the next structural support level. This price action reinforces the bearish momentum and suggests further downside potential.
In my view, the bearish outlook for EURNZD is well-supported by the confirmed breakout and retest of the rectangle pattern, coupled with the broader downtrend on the daily chart. However, it is crucial to monitor how the price behaves around the next support level. A decisive break below this level would likely confirm the continuation of the downtrend, while a rejection or consolidation could signal a temporary pause or reversal.
What are your thoughts on this analysis? Are there any additional factors or levels you believe should be considered?

#EURNZD 4HEURNZD (4H Timeframe) Analysis
Market Structure:
The price is forming a flag pattern, which is generally considered a continuation pattern. This indicates that the market is in a temporary consolidation phase before potentially resuming its previous upward trend.
Forecast:
A buy opportunity may arise if the price breaks above the flag resistance, confirming bullish momentum.
Key Levels to Watch:
- Entry Zone: A buy position can be considered after a confirmed breakout above the flag pattern.
- Risk Management:
- Stop Loss: Placed below the recent swing low to minimize risk.
- Take Profit: Target key resistance zones based on previous price action.
Market Sentiment:
The flag pattern suggests that the market is pausing before continuing its upward movement. Waiting for a breakout confirmation will help validate the trade setup.

EURNZD - Looking To Buy Pullbacks In The Short TermH1 - Bullish trend pattern
Strong bullish momentum
Until the strong support zone holds I expect the price to move higher further after pullbacks.

EURNZD Will Keep Falling!
HI,Traders !
EUR-NZD is going down
And the pair broke the
Key horizontal level
Of 1.828800 so we are
Bearish biased and we
Will be expecting a
Further move down !
Comment and subscribe to help us grow !

eurnzd sell signal. Don't forget about stop-loss.
Write in the comments all your questions and instruments analysis of which you want to see.
Friends, push the like button, write a comment, and share with your mates - that would be the best THANK YOU.
P.S. I personally will open entry if the price will show it according to my strategy.
Always make your analysis before a trade

EUR/NZD Best Place To Sell To Get 250 Pips For Free ! We have an old res here pushed the price 2 times to downside very hard , so i`, looking to sell this pair when the price touch this area again and give me any good bearish price action and i`m targeting 250 pips . just wait the price to touch the area and give us a good bearish price action to confirm the entry .
This Is An Educational + Analytic Content That Will Teach Why And How To Enter A Trade
Make Sure You Watch The Price Action Closely In Each Analysis As This Is A Very Important Part Of Our Method
Disclaimer : This Analysis Can Change At Anytime Without Notice And It Is Only For The Purpose Of Assisting Traders To Make Independent Investments Decisions.

#EURNZD 2HEURNZD (2H Timeframe) Analysis
Market Structure:
The price is currently testing the upper boundary of a channel, which acts as a key resistance level. This indicates a potential bearish scenario if the price fails to break above and instead respects the resistance.
Forecast:
A sell opportunity may arise if the price retests the channel resistance and confirms rejection, signaling the potential for a move toward the channel's lower boundary.
Key Levels to Watch:
- Entry Zone: After the price retests the channel resistance and shows signs of rejection.
- Risk Management:
- Stop Loss: Placed above the channel resistance or the recent swing high to minimize risk.
- Take Profit: Target the midline or the lower boundary of the channel for potential downside movement.
Market Sentiment:
The current price action at the channel resistance indicates a bearish bias, with sellers likely to dominate if the resistance holds. Waiting for confirmation of a retest ensures a strategic entry aligned with market momentum.

EURNZD Will Fall!
HI,Traders !
EUR-NZD made a retest
Of the horizontal resistance
Level of 1.844603 and we are
Already seeing a local
Bearish reaction so
We will be expecting a
Further move down!
Comment and subscribe to help us grow!

EURNZD - ShortEURNZD Analysis - SHORT 👆
In this Chart EURNZD H4 Timeframe: By Nii_Billions.
❤️This Chart is for EURNZD market analysis.
❤️Entry, SL, and Target is based off our Strategy.
This chart analysis uses multiple timeframes to analyze the market and to help see the bigger picture on the charts.
The strategy uses technical and fundamental factors, and market sentiment to predict a BEARISH trend in EURNZD, with well-defined entry, stop loss, and take profit levels for risk management.
🟢This idea is purely for educational purposes.🟢
❤️Please, support our work with like & comment!❤️

EUR/NZD "Euro vs Kiwi" Forex Market Heist Plan on Bearish🌟Hi! Hola! Ola! Bonjour! Hallo!🌟
Dear Money Makers & Robbers, 🤑 💰
Based on 🔥Thief Trading style technical and fundamental analysis🔥, here is our master plan to heist the EUR/NZD "Euro vs Kiwi" Forex market. Please adhere to the strategy I've outlined in the chart, which emphasizes short entry. Our aim is the high-risk Green Zone. Risky level, oversold market, consolidation, trend reversal, trap at the level where traders and bullish robbers are stronger. 👀 So Be wealthy and safe trade.💪🏆🎉
Entry 📉 : You can enter a Bearish trade at any point.
however I advise placing sell limit orders within a 15 or 30 minute timeframe. Entry from the most recent or closest high level should be in retest.
Stop Loss 🛑: Using the 2h period, the recent / nearest high level.
Goal 🎯: 1.82700(OR) Before escape in the bank
Scalpers, take note : only scalp on the Short side. If you have a lot of money, you can go straight away; if not, you can join swing traders and carry out the robbery plan. Use trailing SL to safeguard your money 💰.
Warning⚠️ : Our heist strategy is incompatible with Fundamental Analysis news 📰 🗞️. We'll wreck our plan by smashing the Stop Loss 🚫🚏. Avoid entering the market right after the news release.
Fundamental Outlook 📰🗞️
Considering these factors, the EUR/NZD pair may experience a Bearish trend in the short-term, driven by:
The fundamental analysis indicates that the New Zealand dollar is strengthening against the euro, due to various economic factors such as:
Improved economic growth: New Zealand's economy is showing signs of improvement, with a growth rate of 1.2% in the second quarter of 2024.
Higher interest rates: The Reserve Bank of New Zealand (RBNZ) has raised interest rates, which has led to a stronger New Zealand dollar.
Stronger commodity prices: Commodity prices, such as dairy and meat, have risen, which has benefited the New Zealand economy.
Fundamental Indicators:
New Zealand economic growth: 1.2% (Q2 2024)
Interest rate differential: 2.5% (RBNZ) vs 1.5% (ECB)
Trade balance: New Zealand: -NZD 1 billion (Q2 2024), Eurozone: €10 billion (Q2 2024)
Commodity prices: Dairy: +5% (Q2 2024), Meat: +3% (Q2 2024)
Market Sentiment:
Bearish sentiment: 60%
Bullish sentiment: 40%
Neutral sentiment: 0%
Please note that this is a general analysis and not personalized investment advice. It's essential to consider your own risk tolerance and market analysis before making any investment decisions.
Take advantage of the target and get away 🎯 Swing Traders Please reserve the half amount of money and watch for the next dynamic level or order block breakout. Once it is resolved, we can go on to the next new target in our heist plan.
Keep in mind that these factors can change rapidly, and it's essential to stay up-to-date with market developments and adjust your analysis accordingly.
💖Supporting our robbery plan will enable us to effortlessly make and steal money 💰💵 Tell your friends, Colleagues and family to follow, like, and share. Boost the strength of our robbery team. Every day in this market make money with ease by using the Thief Trading Style.🏆💪🤝❤️🎉🚀
I'll see you soon with another heist plan, so stay tuned 🫂

EURNZD Bearish Breakout!HI,Traders !
EUR-NZD is trading in a
Downtrend and the pair
Broke out of the bearish
Flag pattern so we are
Bearish biased and we
Will be expecting a
Further move down !
Comment and subscribe to help us grow!

EurNzd Short after daily rejection Price rejects 1.84538 nicely and the daily candle closes bearish. Hence I already got my confirmation for sell entry come London session or New York session.
I'll be posting my insight for the sell afterwards.
Kindly boost if you find this insightful 🫴

EurNzd sell anticipation.I will be looking to go short on the KIWI after getting outta the buy at 1.84339. then carefully study price actions around 1.84538 to get confirmation on reversal.
Are you gonna hop on this with me or you have different insight?
Lemme know I'm the comments.

EUR/NZD "EURO vs Kiwi" Forex Market Heist Plan on Bearish🌟Hi! Hola! Ola! Bonjour! Hallo!🌟
Dear Money Makers & Robbers, 🤑 💰
Based on 🔥Thief Trading style technical and fundamental analysis🔥, here is our master plan to heist the EUR/NZD "EURO vs Kiwi" Forex market. Please adhere to the strategy I've outlined in the chart, which emphasizes short entry. Our aim is the high-risk Green Zone. Risky level, oversold market, consolidation, trend reversal, trap at the level where traders and bullish robbers are stronger. 👀 So Be Careful, wealthy and safe trade.💪🏆🎉
Entry 📉 : You can enter a Bearish trade at any point.
however I advise placing sell limit orders within a 15 or 30 minute timeframe. Entry from the most recent or closest high level should be in retest.
Stop Loss 🛑: Using the 2H period, the recent / nearest high level.
Goal 🎯: 0.82100
Scalpers, take note : only scalp on the Short side. If you have a lot of money, you can go straight away; if not, you can join swing traders and carry out the robbery plan. Use trailing SL to safeguard your money 💰.
Warning⚠️ : Our heist strategy is incompatible with Fundamental Analysis news 📰 🗞️. We'll wreck our plan by smashing the Stop Loss 🚫🚏. Avoid entering the market right after the news release.
Fundamental Outlook 📰🗞️
Considering these factors, the EUR/NZD pair may experience a Bearish trend in the short-term, driven by:
The Eurozone's slow economic growth and low interest rates.
The New Zealand economy's moderate growth and neutral monetary policy stance.
The yield differential, which favors the New Zealand dollar.
Bearish Factors:
The Eurozone's slow economic growth and low interest rates.
The New Zealand economy's moderate growth and neutral monetary policy stance.
The yield differential, which favors the New Zealand dollar.
The potential for a decline in the Eurozone's trade balance surplus, which could reduce demand for the euro.
The RBNZ's potential to hike interest rates, which could increase the yield differential and support the New Zealand dollar.
Please note that this is a general analysis and not personalized investment advice. It's essential to consider your own risk tolerance and market analysis before making any investment decisions.
Take advantage of the target and get away 🎯 Swing Traders Please reserve the half amount of money and watch for the next dynamic level or order block breakout. Once it is resolved, we can go on to the next new target in our heist plan.
Keep in mind that these factors can change rapidly, and it's essential to stay up-to-date with market developments and adjust your analysis accordingly.
💖Supporting our robbery plan will enable us to effortlessly make and steal money 💰💵 Tell your friends, Colleagues and family to follow, like, and share. Boost the strength of our robbery team. Every day in this market make money with ease by using the Thief Trading Style.🏆💪🤝❤️🎉🚀
I'll see you soon with another heist plan, so stay tuned 🫂

#EURNZD 2HEURNZD 2-Hour Analysis
The EURNZD pair is forming a rising wedge pattern on the 2-hour chart, which often signals a potential bearish reversal. The price is trading near the wedge's upper levels, and a breakdown below the support line would confirm selling pressure, offering further sell opportunities.
Technical Outlook:
Pattern: Rising Wedge
Forecast: Bearish (Sell, and Sell More on Support Line Breakdown)
Entry Strategy: Initiate a sell position if the price shows bearish signals near the wedge's resistance. Add to the position or open new sell trades once the support line is broken and confirmed with a retest or bearish price action.
Traders should monitor indicators like RSI for overbought conditions or MACD for bearish crossovers to strengthen the case for a sell. Use proper risk management by setting stop-loss orders above the wedge resistance and targeting key support levels below the breakdown point.

EUR/NZD "Euro vs Kiwi" Forex Bank Heist Plan on BullishHello! My Dear Robbers / Money Makers & Losers, 🤑 💰
This is our master plan to Heist EUR/NZD "Euro vs Kiwi" Forex Bank Heist Plan based on Thief Trading style Technical Analysis.. kindly please follow the plan I have mentioned in the chart focus on Long entry. Our target is Red Zone that is High risk Dangerous level, market is overbought / Consolidation / Trend Reversal / Trap at the level Bearish Robbers / Traders gain the strength. Be safe and be careful and Be rich.
Entry 📈 : Can be taken Anywhere, What I suggest you to Place Buy Limit Orders in 15mins Timeframe Recent / Nearest Low Point take entry should be in pullback.
Stop Loss 🛑 : Recent Swing Low using 4H timeframe
Target 🎯 : 1.83500
Attention for Scalpers : Focus to scalp only on Long side, If you've got a lot of money you can get out right away otherwise you can join with a swing trade robbers and continue the heist plan, Use Trailing SL to protect our money 💰.
Warning : Fundamental Analysis news 📰 🗞️ comes against our robbery plan. our plan will be ruined smash the Stop Loss 🚫🚏. Don't Enter the market at the news update.
Loot and escape on the target 🎯 Swing Traders Plz Book the partial sum of money and wait for next breakout of dynamic level / Order block, Once it is cleared we can continue our heist plan to next new target.
💖Support our Robbery plan we can easily make money & take money 💰💵 Follow, Like & Share with your friends and Lovers. Make our Robbery Team Very Strong Join Ur hands with US. Loot Everything in this market everyday make money easily with Thief Trading Style.
Stay tuned with me and see you again with another Heist Plan..... 🫂

EURNZD next possible moveWe are waiting for our asset to reach our action zone, and based on the reaction, we’ll decide on our next moves.ALWAYS WAIT FOR A CONFIRMATION TO SEE IF THE PRICE VALIDATES THE ZONE.
