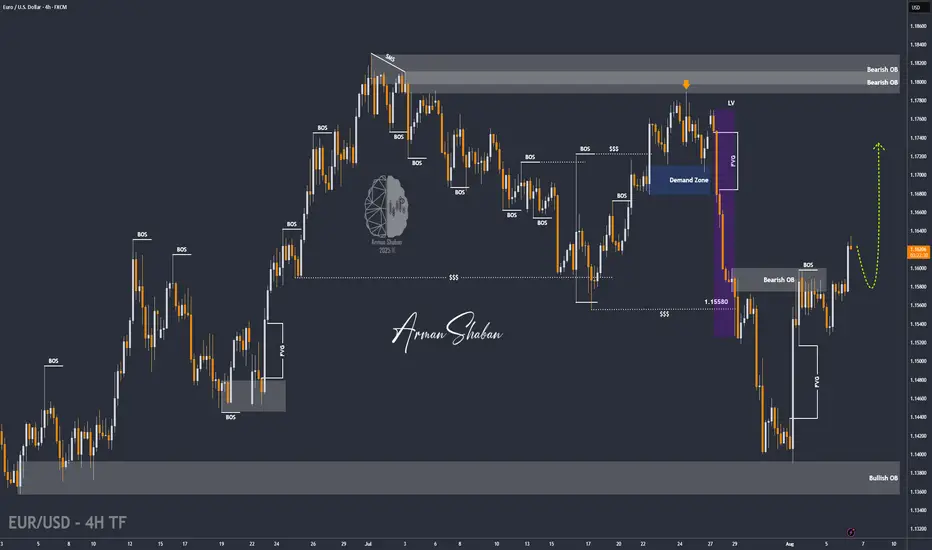
EUR/USD | Holding Above 1.16 Could Unlock More Upside! (READ IT)By analyzing the EURUSD chart on the 4-hour timeframe, we can see that the price reacted beautifully to all the marked zones on the chart. Especially after reaching the 1.14 demand area, it experienced a strong bullish move, rallying over 200 pips to hit 1.16. Currently, EURUSD is trading around 1.16220, and if it holds above the 1.16 level, we can expect further upside. The next bullish targets are 1.16435, 1.16780, 1.17100, and 1.17500.
Please support me with your likes and comments to motivate me to share more analysis with you and share your opinion about the possible trend of this chart with me !
Best Regards , Arman Shaban
Euro
DAX Resilience To Shine ThroughThe DAX Index continues to hold strength just beneath all-time highs, popping higher above 24,000 after three consecutive sessions of gains.
Bulls are keeping control through strong earnings in tech and auto sectors, combined with supportive macro tailwinds. However, the major resistance and previous ATH remain to be tested.
U.S. Interest Rate Path in Focus
The Federal Reserve held rates steady at its July meeting but left the door open for a possible cut in September, should inflation and labor market data soften.
Markets are pricing in an increasing probability of a cut, which is fueling optimism across global equities.
A dovish Fed supports global risk sentiment and weakens the USD, indirectly benefiting European exporters.
ECB Holds, But Dovish Undertone Grows
The European Central Bank left rates unchanged in its latest decision, but ECB President Christine Lagarde acknowledged that “disinflation is progressing” and that further tightening is unlikely.
Forward guidance was interpreted as dovish, with the market now expecting a cut by December, possibly sooner if economic activity remains sluggish.
A dovish ECB lowers borrowing costs and improves equity risk premiums, especially for cyclical-heavy indices like the DAX.
EU–U.S. Trade Tensions
Recent rhetoric from U.S. officials, including renewed tariff threats on European pharmaceutical and automotive exports, has reignited trade tensions.
The EU has signaled its willingness to respond proportionally, but negotiations are ongoing.
While no measures have been enacted yet, uncertainty over trade policy is capping some upside momentum in European equities.
German automakers and industrial exporters are vulnerable to tariffs. Continued trade uncertainty may limit gains unless diplomacy resolves key friction points.
The DAX remains resilient, buoyed by improving fundamentals, strong earnings, and global rate expectations.
The index is coiled just under a key psychological resistance at 24,000, with bulls eyeing a breakout toward the all-time high near 24,639.
Momentum remains favorable, but traders should watch macro headlines and volume closely around resistance zones.

Fundamental Market Analysis for August 5, 2025 EURUSDEvent to pay attention to today:
17:00 EET. USD - ISM Services PMI
EUR/USD continues to fall for the second day in a row, trading around 1.1560 during Tuesday's Asian session. The pair is devaluing amid the strengthening of the US dollar (USD) due to caution among traders caused by recent events in global trade and changes in expectations regarding monetary policy.
Market sentiment is becoming cautious due to growing concerns about the independence of the Federal Reserve (Fed). On Monday, Fed board member Adriana Kugler unexpectedly resigned. This event gave US President Donald Trump the opportunity to influence the central bank earlier than expected.
However, the US dollar may face difficulties amid growing chances of an interest rate cut by the US Federal Reserve (Fed) in September after weak labor market data reinforced concerns about the US economic outlook. Markets estimate the probability of a Federal Reserve rate cut next month at 91.6%.
By comparison, the European Central Bank (ECB) is expected to keep rates unchanged, as annual inflation in the eurozone remained at 2.0% in July, slightly above the forecast of 1.9%. Meanwhile, traders are cautious amid the introduction of 15% US tariffs on goods imported from the European Union (EU).
Trade recommendation: BUY 1.1580, SL 1.1500, TP 1.1685

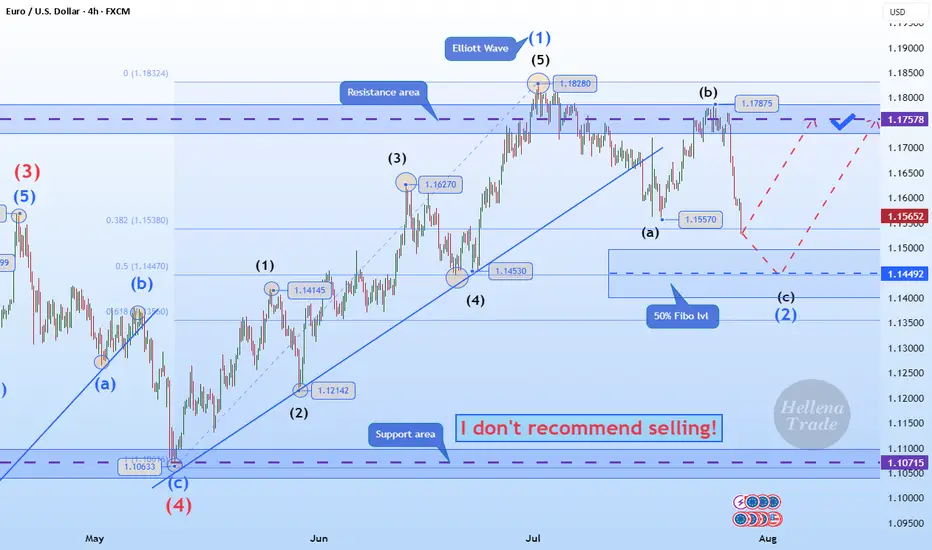
Hellena | EUR/USD (4H): LONG to the resistance area 1.17578.Colleagues, the price has made a strong downward movement, which can only mean one thing: the correction is not complete.
This means that the latest upward movement is wave “1” of medium order.
Therefore, I now expect the correction to end in wave “2” at the 50% Fibonacci level and thean upward movement to continue to at least the resistance level of 1.17578.
It is quite possible that after updating the level of 1.15570, the price will immediately begin an upward movement — this is a more risky option for entering a position.
Manage your capital correctly and competently! Only enter trades based on reliable patterns!
EURUSD Current Market Situation Technical Analysis Current Market Situation
The chart displays a Double Top pattern, a strong bearish reversal signal that often indicates the start of a downward move.
The price has already broken the neckline, and it is now approaching a retest of both the neckline and the broken trendline, which serves as a critical resistance area for potential bearish continuation.
Key Zones
Neckline Retest Zone: Around 1.1600, acting as immediate resistance.
Trendline Retest Zone: Between 1.1670 – 1.1700, serving as an additional resistance level to confirm the bearish bias.
Potential Scenarios
✅ Bearish Scenario (Preferred):
If price respects the retest zones and fails to break higher, we may see a decline toward:
Target 1: 1.1500
Target 2: 1.1400
Target 3: 1.1300
⚠ Bullish Scenario (Alternative):
A clear breakout and daily close above 1.1700 would invalidate the bearish outlook and could lead to a bullish reversal.
Conclusion
The market structure currently favors the bears.
Rejection from the neckline or trendline retest zones will provide a strong confirmation for sell positions.
⚠️ Trade at your own risk – We are not responsible for any losses.

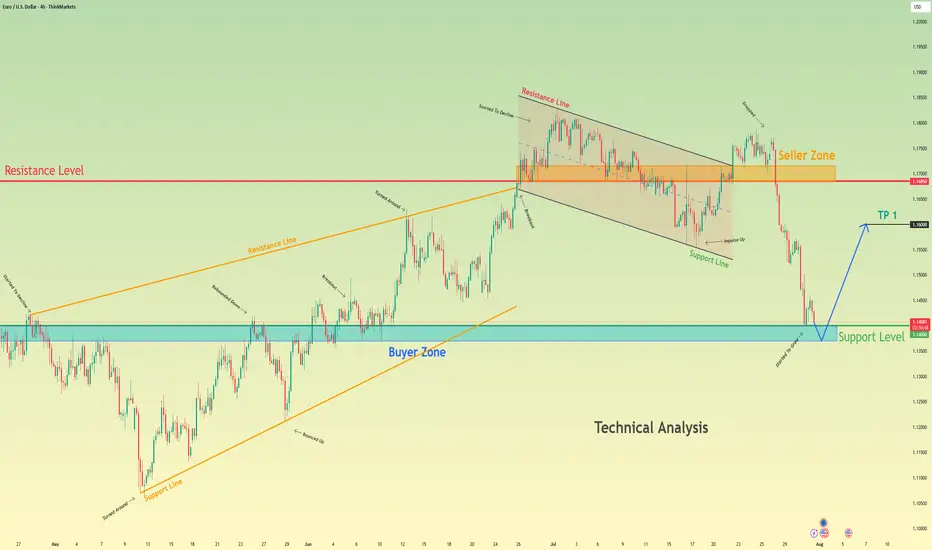
Euro bounce from buyer zone and start to move upHello traders, I want share with you my opinion about Euro. After a prolonged upward trend which formed a large rising wedge, the EURUSD faced a significant rejection from the seller zone near the 1.1685 resistance level. This failure to continue higher marked a key turning point, exhausting the bullish momentum and initiating a new bearish market phase. This new phase has since taken the form of a well-defined downward channel, within which the price has been undergoing a series of downward corrections and impulses. The most recent market action has been a sharp downward fall, accelerating the price's descent towards a critical area of historical significance. Currently, the pair is approaching the major support level at 1.1400, which also constitutes a strong buyer zone where demand has previously stepped in. The primary working hypothesis is a long, counter-trend scenario, which anticipates that the current bearish momentum will be absorbed by the strong demand within this buyer zone. A confirmed and strong rebound from this 1.1400 support area would signal a potential temporary bottom and the start of a significant upward correction. Therefore, the tp for this rebound is logically set at the 1.1600 level, a key psychological and technical point that represents a realistic first objective for a bounce of this nature. Please share this idea with your friends and click Boost 🚀
Disclaimer: As part of ThinkMarkets’ Influencer Program, I am sponsored to share and publish their charts in my analysis.
EURUSD NOWWe've got EURUSD now waiting for a mitigation of the OB to take 15m high or maybe shorting until 1D low. but most probably we take long because of a weak body close that signals a weak power of sellers.

LONG ON EUR/USDEUR/USD is currently at a major demand level after sweeping sell side liquidity.
The Dxy (Dollar) is overall bearish. I expect the dollar to fall and EUR/USD to rise to the previous high / supply level for over 200-300 pips.
News most likely will affect this pair in terms of volatility.

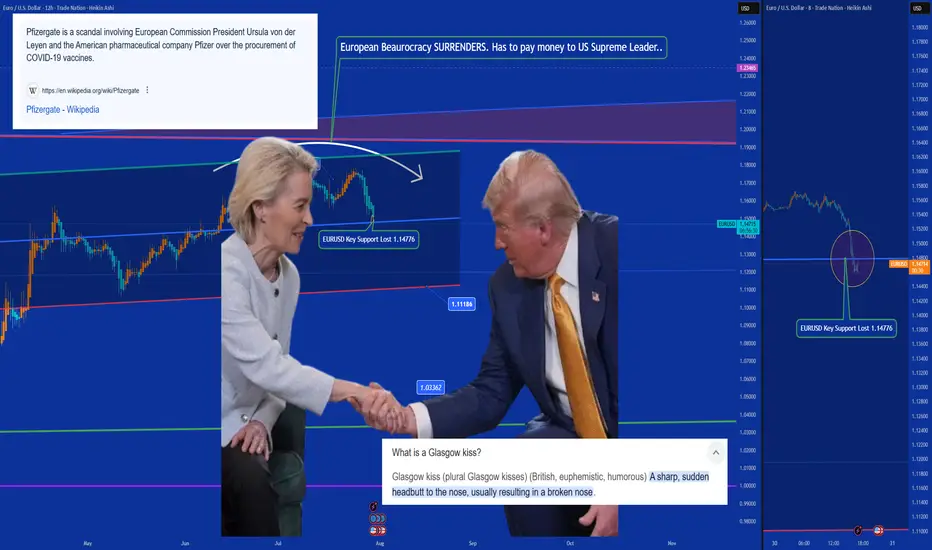
Ursulization = Bureaucracy > Democracy (a.k.a. The Glasgow Kiss)🤝💥 Ursulization – Bureaucracy Replaces Democracy (a.k.a. The Glasgow Kiss) 🇺🇸🇪🇺
📍Background:
The media spun it as a "15% tariff agreement"…
But in reality, this wasn’t diplomacy — it was a disguised capitulation.
And the stage? None other than Scotland, ancestral ground of Donald J. Trump.
So when Ursula von der Leyen came seeking a gentle diplomatic handshake…
What she received instead was the infamous Glasgow Kiss — sudden, sharp, and unmissable.
💥 What’s a Glasgow Kiss?
A British slang term for a violent headbutt to the face —
No grace. No warning. Just raw force.
💬 The Real Story:
Ursula von der Leyen — unelected, unaccountable —
signed off on $1.4 trillion in U.S.-bound capital flows:
💸 $750B to buy American energy
🛠 $600B in U.S. infrastructure, defense & industry
All to sidestep 50% tariffs the Trump team had ready to roll.
But here's the kicker:
She wasn’t acting on behalf of European citizens.
She was speaking for the bureaucracy, not the people.
🔥 Welcome to Ursulization:
Where democracy is sidelined by unelected power.
Where negotiations happen in silence.
Where scandals like PfizerGate get buried while the euro breaks down.
📉 EUR/USD just lost key support at 1.14776 —
The chart shows t he cost of surrender.
💉 PfizerGate Reminder:
Ursula already faced heat for secretive vaccine contracts with Pfizer.
Now, she’s handing over Europe’s industrial backbone —
To Trump. In Scotland. With no public mandate.
📌 Conclusion:
Trump didn’t compromise — he collided.
Europe didn’t resist — it surrendered.
This wasn’t diplomacy.
It was a Glasgow Kiss — a collision between legitimacy and bureaucratic power.
👑 One elected by the people (Trump). One not elected at all (Woke agenda style Ursula).
💰 One walks away with trillions (Trump). The other, with silence (Ursula 'Von der Pfizinen never electenen'').
One Love,
The FXPROFESSOR 💙
ps. Till we can bring Democracy and Europe back.
Disclosure: I am happy to be part of the Trade Nation's Influencer program and receive a monthly fee for using their TradingView charts in my analysis. Awesome broker, where the trader really comes first! 🌟🤝📈
The euro extends sharp losses following the US-EU tariff deal
The euro weakened sharply against the dollar amid views that the US-EU tariff deal favors the US. European leaders voiced mixed reactions. Germany’s Chancellor Merz welcomed the agreement as a safeguard against economic damage, while Hungary’s PM Orbán criticized it as a one-sided win for the US. Meanwhile, the IMF raised its eurozone growth forecast from 0.8% to 1.0% in its July outlook, citing the lower-than-expected tariff levels as supportive of the region’s economy.
EURUSD broke below the ascending trendline and briefly tested the support at 1.1520. EMA21 has death-crossed EMA78, indicating the potential extension of bearish momentum.
If EURUSD fails to hold above the support at 1.1520, the price could decline further toward 1.1450. Conversely, if EURUSD breaches above the resistance at 1.1590, the price may gain upward momentum toward 1.1640.

Should You Still Sell Your USD for EUR? A 2025 PerspectiveWith currency markets in constant flux, the decision to hold USD or convert to EUR carries major financial implications for investors, expatriates, businesses, and frequent travelers. As of July 29, 2025, the USD/EUR exchange rate is around 0.86–0.87, with $1 buying roughly €0.86. Is now the right time to sell your US dollars for euros? Here’s a balanced look at the latest data and forecasts.
Current Market Context: Dollar Weakness and Euro Stabilization
USD Slide in 2025: The US dollar has experienced its steepest decline in over three years, falling nearly 10% year-to-date. This sustained weakness is attributed to policy volatility, capital flowing out of the US, and narrowing interest rate differentials.
Key Exchange Rate: Recent rates hover between 0.85 and 0.87, representing moderate stability following a period of volatility.
Euro’s Resilience: While the euro has had its own struggles, from slower economic growth to political uncertainty in Germany and France, analysts forecast no major sustained fall for the euro through 2025.
2025 Forecasts: USD/EUR Direction—What Do the Experts Say?
Year-End 2025 Outlook: Major banks and forecasting firms expect the EUR/USD rate could climb even higher by year-end, meaning the euro could gain modestly versus the dollar if current trends continue.
Factors to Watch:
Fed Rate Cuts: Potential US rate cuts in Q3–Q4 remain a key driver for further USD weakness.
Trade & Tariff Uncertainty: Ongoing US tariff announcements and global trade tensions add volatility but also support safe haven flows to the dollar.
Eurozone Politics: Any resolution of political uncertainty in Europe could buoy the euro.
Most Important One: Fed's Money Printer...
Strategic Considerations: Should You Sell Now?
Locking in Current Rates: If you need euros to make payments, pay salaries, or make investments in the short term, converting a portion now could reduce your exposure to further USD downside.
If You Can Wait: Analysts see some chance for USD recovery in late Q3 or early 2026, but this is contingent on US policy stability and Fed decisions.
Averaging In: For larger transfers, consider splitting your transaction over time (also called dollar-cost averaging), which can help mitigate volatility.
Bottom Line
If you have an immediate need for euros, current rates present a reasonable opportunity. The dollar’s weakness throughout 2025 is well documented, but much of the pessimism may already be priced in. If you’re flexible with timing, monitor central bank policy signals throughout Q3/Q4, a more dovish Fed or unexpected eurozone stability could push rates further in your favor, but event risks remain elevated. Ultimately, a phased or hedged approach may offer both protection and potential upside
*not investment advice*
#forex #fx #dollar #usd #euro #eur #economy #trade #tariff #trading #indicator

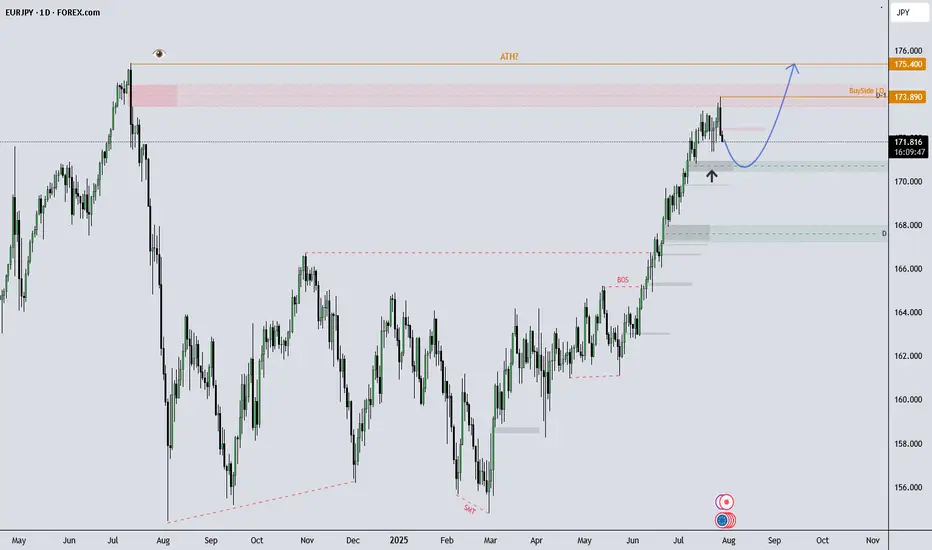
EURJPY Eyes New Highs After Pullback?What I see!
EURJPY Technical Outlook –
EURJPY remains in a strong uptrend and recently tapped into buy-side liquidity at 173.89, which now marks the All-Time High (ATH). After a brief rejection from that level, price is currently showing signs of a healthy pullback.
I’m observing the 170.00–171.00 zone, which aligns with previous demand. If price continues to respect this area, the overall bullish structure remains intact, with potential for a move back toward (and possibly beyond) the ATH.
A sustained break below 170.00 could indicate room for a deeper pullback, potentially toward the 168.00s, which would be a key area to monitor.
This analysis is shared for educational and discussion purposes only.
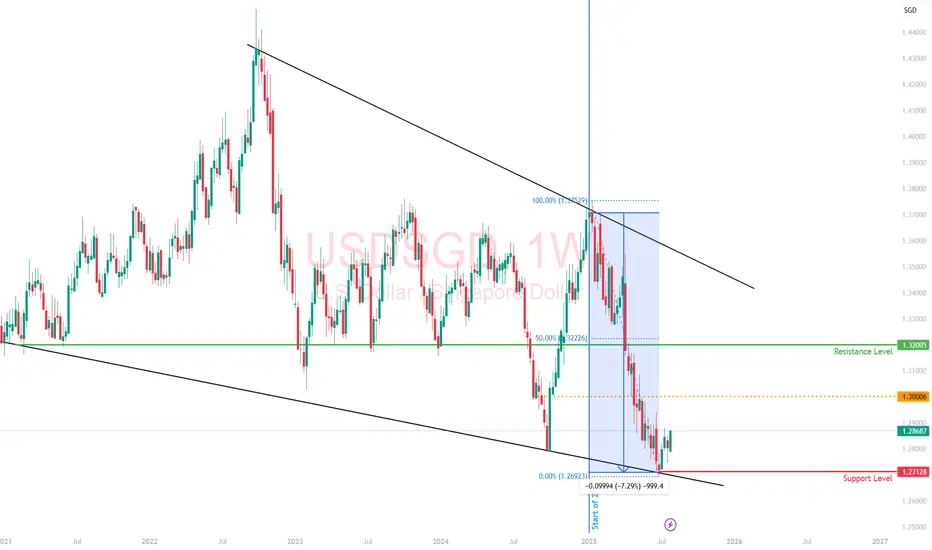
Singapore Dollar: Asia’s Quiet Safe Haven with Eyes on ParityThe Singapore dollar has quietly emerged as one of the strongest performers in Asia, gaining over 7% against the US dollar this year.
While much of the FX world fixates on the yen or franc in times of uncertainty, the SGD is carving out a niche as a regional safe-haven, driven not by size or liquidity, but by credibility.
The strength in the SGD isn’t just about USD weakness. Singapore's macro fundamentals
budget surpluses,
robust reserves, and
deep-rooted investor confidence
offer a kind of quiet strength that traders tend to overlook until it becomes obvious.
This makes the SGD a compelling hedge against both regional turmoil and global dollar decay.
As more global capital looks for stable homes outside of the traditional, Singapore’s financial system and currency are set to benefit.
The idea of SGD hitting parity with the USD, once dismissed as unrealistic, is now getting serious attention.
Analysts have suggested that it could happen within five years, but I wouldn’t be surprised if it comes sooner!
The greenback’s structural issues of twin deficits, political gridlock, and de-dollarization headwinds are no longer theoretical.
That said, liquidity is still a constraint. The SGD makes up just 2% of global FX turnover, and the MAS actively manages the currency to avoid excessive volatility.
This means that while the long-term trend favors SGD appreciation, traders betting on a rapid sprint to parity may be left waiting.
In my view, the SGD is one of the most underappreciated macro trades in FX.
EURUSD Will the 1D MA50 hold?The EURUSD pair has been trading within a Channel Up pattern since the April 21 2025 High. The price is right now on a strong pull-back and is about to test the 1D MA50 (blue trend-line) for the first time since May 12.
As long as the 1D candle closes above the 1D MA50, it will be a buy signal, targeting 1.19250 (a standard +3.20% rise).
If the candle closes below the 1D MA50, the buy will be invalidated and we will switch to a sell, targeting the 1D MA100 (green trend-line) at 1.14100.
-------------------------------------------------------------------------------
** Please LIKE 👍, FOLLOW ✅, SHARE 🙌 and COMMENT ✍ if you enjoy this idea! Also share your ideas and charts in the comments section below! This is best way to keep it relevant, support us, keep the content here free and allow the idea to reach as many people as possible. **
-------------------------------------------------------------------------------
Disclosure: I am part of Trade Nation's Influencer program and receive a monthly fee for using their TradingView charts in my analysis.
💸💸💸💸💸💸
👇 👇 👇 👇 👇 👇

EUR/CAD: Shorting the Climactic Rally Near 1.6000The strong rally in EUR/CAD has pushed the pair into extreme territory, approaching a major psychological and structural resistance zone. While momentum has been strong, this looks like a potential climactic or "blow-off" top, offering a highly favorable risk/reward opportunity to short the pair in alignment with the weak underlying Euro fundamentals.
The Fundamental Why 📰
The core thesis remains bearish for the Euro. The European Central Bank (ECB) maintains a distinctly dovish tone, signaling a willingness to ease policy further to support a slowing Eurozone economy. This fundamental headwind suggests that extreme rallies in Euro pairs are often exhaustive and present prime shorting opportunities.
The Technical Picture 📊
Major Supply Zone: The price is entering a critical multi-month supply zone between 1.5950 and the key psychological level of 1.6000. This is a major ceiling where significant selling pressure is anticipated.
Fibonacci Extension: This area aligns with a key Fibonacci extension level (1.272) from the last major impulse wave, a common zone where trending moves become exhausted and reversals begin.
Pronounced RSI Divergence: A clear bearish divergence is forming on the daily chart. As price makes this final push to a new high, the Relative Strength Index (RSI) is making a significantly lower high, signaling a deep exhaustion of buying momentum.
The Counter-Trade Rationale 🧠
This is a high-level fade. We are positioning for a reversal at a major, technically significant ceiling. The extreme price extension, combined with clear momentum divergence, indicates that the risk of buying at these highs is substantial. By shorting here, we are betting that the powerful technical resistance and weak fundamentals will trigger a significant correction.
The Setup ✅
📉 Pair: EUR/CAD
👉 Direction: Short
⛔️ Stop Loss: 1.63230
🎯 Entry: 1.59490
✅ Take Profit: 1.52008
⚖️ Risk/Reward: ≈ 2:1

Euro will rebound from support line of wedge to resistance levelHello traders, I want share with you my opinion about Euro. After breaking out decisively from a prior downward channel, the euro initiated a significant structural shift, moving from a clear downward trend into a new and more volatile market condition. This transition has led to the development of a large broadening wedge pattern, which is characterised by higher highs and lower lows, indicating an expansion in volatility as both buyers and sellers fight for control. The boundaries of this struggle are well-defined by a major buyer zone around 1.1650 and a formidable seller zone near 1.1750. Currently, the pair is in a corrective phase, moving downwards within the wedge after a recent upward rebound was rejected from the upper resistance line. The primary working hypothesis is a long scenario, which anticipates that this downward correction will find strong support at the confluence of the wedge's ascending support line and the horizontal buyer zone around 1.1650. A confirmed bounce from this critical area of support would validate the integrity of the broadening wedge pattern and likely trigger another powerful upward rotation. Therefore, the TP is strategically placed at the 1.1750 resistance level. Please share this idea with your friends and click Boost 🚀
Disclaimer: As part of ThinkMarkets’ Influencer Program, I am sponsored to share and publish their charts in my analysis.

SHORT ON EUR/NZDEZ Has given a nice CHOC to the downside with plenty of sell side liquidity to be collected.
I will be selling EZ to the next level of demand looking to catch 300-500 pips

Euro will rise a little and then start to fall to support lineHello traders, I want share with you my opinion about Euro. After a prolonged consolidation period, a strong upward trend was initiated from the buyer zone around 1.1285, propelling the EUR significantly higher. This initial impulsive move has since transitioned into a more complex and mature phase, taking the shape of a large upward wedge formation, a pattern which often signals underlying exhaustion in the prevailing trend. Currently, the pair is operating within this defined market zone, characterized by a clear ascending support line and a corresponding resistance line. The price action inside the wedge has become corrective, with the most recent upward correction originating from the support area near 1.1575. The working hypothesis is centered on a short-term bearish scenario, which anticipates that this current rally will fail as it approaches the upper boundary of the wedge. A rejection from this resistance would confirm that selling pressure is increasing and that the bullish momentum is waning. This would likely trigger a significant downward rotation within the structure, with the immediate objective being a retest of the main ascending support line. For this reason, the TP is strategically and logically placed at the 1.1665 level, as this point lies directly on the trend line and serves as the most critical test for the existing uptrend's viability. Please share this idea with your friends and click Boost 🚀
Disclaimer: As part of ThinkMarkets’ Influencer Program, I am sponsored to share and publish their charts in my analysis.

EUR/JPY: Bullish Thesis on Policy DivergenceOur primary thesis is built on a powerful confluence of compelling fundamental drivers and a clear technical structure. We are taking a long position in EUR/JPY with high conviction, anticipating significant upside fueled by a stark monetary policy divergence confirmed by a constructive chart formation.
📰 Fundamental Analysis: The core of this trade is the widening policy gap between the European Central Bank (ECB) and the Bank of Japan (BoJ). While the BoJ is only just beginning to exit its ultra-loose monetary policy, the global environment points toward continued JPY weakness. The upcoming high-impact US news will act as a major catalyst. A "risk-on" reaction to the data would significantly weaken the JPY, providing a strong tailwind for this trade.
📊 Technical Analysis: The chart structure for EUR/JPY is decidedly bullish. The pair has established a clear uptrend, and recent price action indicates a period of healthy consolidation above key support levels. This presents a strategic entry point, as the market appears to be gathering momentum for the next leg higher. The current setup suggests a low-risk entry into a well-defined upward trend.
🧠 The Trade Plan: Based on this synthesis, we are executing a precise trade with a favorable risk profile.
👉 Entry: 172.422
⛔️ Stop Loss: 171.292
🎯 Take Profit: 174.684
⚖️ Risk/Reward: 1:2

EUR/GBP: Bullish Stance Above 0.8640This signal outlines a tactical long entry on EUR/GBP, positioning for a bullish resolution from today's major fundamental events.
📰 Fundamental Thesis
This position is taken ahead of the two primary market movers: the ECB rate decision and the UK PMI data. The core thesis is that the ECB policy statement will be the dominant catalyst, providing strength to EUR that will outweigh the impact of the UK data release.
📊 Technical Thesis
The trade is defined by a sound technical structure. The stop loss is anchored beneath the critical support zone at 0.8640. The profit target is set to challenge the resistance area just above 0.8722. This setup offers a favorable and clearly defined risk-to-reward profile.
🧠 Risk Management
Execution is timed before extreme event-driven volatility. Adherence to the stop loss is critical to manage the inherent risk of this pre-news strategy.
Trade Parameters
⬆️ Direction: Long (Buy)
➡️ Entry: 0.86690
⛔️ Stop Loss: 0.86344
🎯 Target: 0.87382
✅ Risk/Reward: 1:2

Euro Futures (6E) – Bearish Drift Below ResistanceEuro Futures (6E) appears to be grinding lower showing clear signs of fading bullish momentum.
After a bounce off 1.16160 support on July 17, Euro Futures (6E) made a failed push into 1.17995 resistance on Tuesday, July 22, a level that’s acted as a firm ceiling since June 26.
Since then, price action has been in a descending broadening channel, often a precursor to further downside with expanding volatility as sellers control the tempo.
As of 5:20 AM GMT, the structure points to continued weakness. I expect 6E to settle around 1.17170 – 1.16990 by close of Wednesday, July 23, 2025.
📉 Bias: Bearish
🔍 Pattern: Broadening Descending Channel
🕒 Date: July 23, 2025

Trump did it again!Donald Trump did exactly what he did in his previous term: Dollar Devaluation .
Reason? Strengthening the US exports.
Will it work? We'll see.
What's your thoughts?
#dollar #forex #euro #devaluation #trump #exports #trading #algo

EURUSD Will the 1D MA50 hold?The EURUSD pair seems to be rebounding just before a 1D MA50 (blue trend-line) test, which is its short-term Support. At the same time it bounced off the 0.382 Fibonacci retracement level, which after a +6.92% rise, it resembles the March 27 rebound.
The 1D RSI is printing a standard bullish reversal setup, seen already 4 times since February, and a break above its MA will confirm it.
As long as the 1D MA50 holds, it may extend the uptrend to a new Channel Up (dashed), outside the blue one that may look for a new +6.92% rise. In that case our Target will be 1.21000.
If the 1D MA50 breaks, we will add one last buy at 1.14000, near the 1D MA100 (green trend-line).
-------------------------------------------------------------------------------
** Please LIKE 👍, FOLLOW ✅, SHARE 🙌 and COMMENT ✍ if you enjoy this idea! Also share your ideas and charts in the comments section below! This is best way to keep it relevant, support us, keep the content here free and allow the idea to reach as many people as possible. **
-------------------------------------------------------------------------------
Disclosure: I am part of Trade Nation's Influencer program and receive a monthly fee for using their TradingView charts in my analysis.
💸💸💸💸💸💸
👇 👇 👇 👇 👇 👇
