EUR/USD Retracement Into Demand ZoneHello guys!
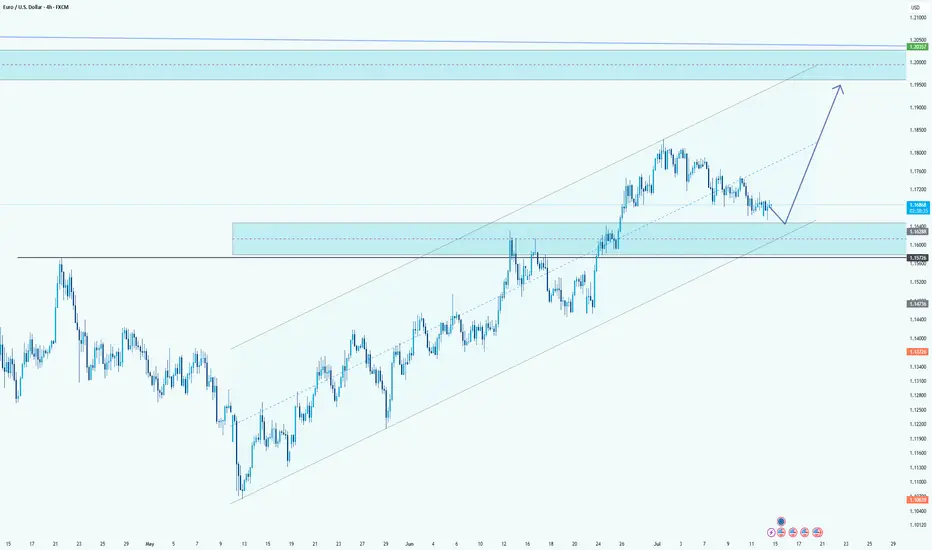
EUR/USD is currently undergoing a healthy retracement after an extended bullish trend within the ascending channel. The price is now approaching a key demand zone, which aligns perfectly with the mid-line of the channel structure.
This zone previously acted as a strong resistance area and is now expected to serve as support, confirming a classic flip in market structure. The reaction around the 1.16288 - 1.15774 area will be crucial.
If buyers step in here, the bullish momentum is likely to resume with the next major target being the upper resistance zone near 1.20000 , as projected by the upward arrow. The overall structure remains bullish as long as the price holds above the channel support and doesn't close below the last demand zone.
EURO-USD
EUR/USD Bearish Setup: QM + Breakout Play Targeting Demand Zone!Hello guys!
I think eurusd is bearish! why?
A Range: Market consolidated in a tight horizontal range before breaking out.
QM Pattern: A lower high and lower low structure indicates potential for a trend reversal.
Neckline Break: Bearish confirmation with a strong break and close below neckline support.
Retest Zone: Price is now revisiting the QM supply zone, offering a high-probability short setup.
Bearish Projection: The next expected move is a drop toward the S&D (Support & Demand) zone between 1.12640 and 1.11900, which aligns with historical demand and previous accumulation.
________________________
🎯 Bearish Target Zone:
First TP: 1.12640
Final TP: 1.11900 - 1.12080 (Demand Zone)

EURUSD | Short‑Term Pullback Meets First Support ZoneI know a lot of you have been watching EURUSD closely. With recent developments, we could see a modest dip before the next leg up in the euro.
What’s Driving the Dollar
End of Market Indecision
As uncertainty fades, the dollar’s safe‑haven appeal eases. Investors feel more confident stepping into riskier assets.
U.S.–China Dialogue
News that the U.S. and China are ready to resume high‑level talks removes a huge overhang. Less trade‑war fear means less upward pressure on USD.
Solid Economic Data
Last week’s jobless claims and employment figures were far from recession‑level weakness. That supports the dollar in the near term.
Short‑Term Outlook
Putting these factors together, EURUSD may unwind some of its recent gains. Sellers could push price lower into the blue box, which marks our first support area.
Long‑Term Perspective
Even so, remember that President Trump’s ongoing policy surprises tend to rattle confidence in the dollar over time. Once this short‑term pullback is over, the euro stands to resume its broader uptrend.
How to Trade It
Wait for price to dip into the blue box
Look for lower‑time‑frame bullish breaks confirmed by CDV signals
Enter a long only when you see a clean structure shift and volume support
If price breaks below the blue box without a retest, stay out or reassess
This approach keeps risk tight and lets the market prove itself first. Many traders jump in too early. If you follow these steps, you’ll join the move with conviction rather than guesswork. I’ve built my track record by trading exactly this way—patiently and with clear confirmations. Stay tuned and let’s capture the next leg up together.
📌I keep my charts clean and simple because I believe clarity leads to better decisions.
📌My approach is built on years of experience and a solid track record. I don’t claim to know it all but I’m confident in my ability to spot high-probability setups.
📌If you would like to learn how to use the heatmap, cumulative volume delta and volume footprint techniques that I use below to determine very accurate demand regions, you can send me a private message. I help anyone who wants it completely free of charge.
🔑I have a long list of my proven technique below:
🎯 ZENUSDT.P: Patience & Profitability | %230 Reaction from the Sniper Entry
🐶 DOGEUSDT.P: Next Move
🎨 RENDERUSDT.P: Opportunity of the Month
💎 ETHUSDT.P: Where to Retrace
🟢 BNBUSDT.P: Potential Surge
📊 BTC Dominance: Reaction Zone
🌊 WAVESUSDT.P: Demand Zone Potential
🟣 UNIUSDT.P: Long-Term Trade
🔵 XRPUSDT.P: Entry Zones
🔗 LINKUSDT.P: Follow The River
📈 BTCUSDT.P: Two Key Demand Zones
🟩 POLUSDT: Bullish Momentum
🌟 PENDLEUSDT.P: Where Opportunity Meets Precision
🔥 BTCUSDT.P: Liquidation of Highly Leveraged Longs
🌊 SOLUSDT.P: SOL's Dip - Your Opportunity
🐸 1000PEPEUSDT.P: Prime Bounce Zone Unlocked
🚀 ETHUSDT.P: Set to Explode - Don't Miss This Game Changer
🤖 IQUSDT: Smart Plan
⚡️ PONDUSDT: A Trade Not Taken Is Better Than a Losing One
💼 STMXUSDT: 2 Buying Areas
🐢 TURBOUSDT: Buy Zones and Buyer Presence
🌍 ICPUSDT.P: Massive Upside Potential | Check the Trade Update For Seeing Results
🟠 IDEXUSDT: Spot Buy Area | %26 Profit if You Trade with MSB
📌 USUALUSDT: Buyers Are Active + %70 Profit in Total
🌟 FORTHUSDT: Sniper Entry +%26 Reaction
🐳 QKCUSDT: Sniper Entry +%57 Reaction
📊 BTC.D: Retest of Key Area Highly Likely
📊 XNOUSDT %80 Reaction with a Simple Blue Box!
📊 BELUSDT Amazing %120 Reaction!
I stopped adding to the list because it's kinda tiring to add 5-10 charts in every move but you can check my profile and see that it goes on..

ECB decision shadowed by tariff risk Markets will be closely watching the European Central Bank’s (ECB) interest rate decision on April 17, with expectations for a seventh consecutive rate cut.
Despite this expectation, the euro surged to a three-year high against the US dollar last week, as traders continued to pull away from US assets.
The dollar index has dropped 4% since President Trump’s “Liberation Day” tariff announcements on April 2, falling below the key 100 level too.
At this stage, market participants will be looking for any signals on how the ECB might respond to the potential spillover effects of President Trump’s tariff measures. While some guidance may emerge around already-announced policies, the risk of further unpredictability remains high.
Trump being Trump, it is perhaps unlikely we have seen the last of his volatility-inducing tariff announcements. This can weigh further on the dollar, eroding confidence in the world’s reserve currency.

Euro may bounce up from support area to 1.0950 pointsHello traders, I want share with you my opinion about Euro. Analyzing the chart, we can observe how the price initially reached the support level that aligned with the buyer zone and broke through it. After that, the Euro moved into a wedge pattern, where it reversed near the resistance line and started to decline sharply toward the support line, forming a strong gap and breaking the support once again. Soon after, the price reversed direction and began to climb, breaking through the 1.0360 level again and rising to the resistance line of the wedge. A brief correction followed, bringing the price back down to the support level. From there, the market made a strong upward impulse, breaking out of the wedge and reaching the current support area. After the breakout, the price started moving within a triangle pattern. It broke above the 1.0785 level and climbed to the resistance line of the triangle. Then, a correction took place down to the support area, followed by a quick bounce back up to the resistance, from where the price recently started to decline. Given this structure, I expect the price to complete its correction at the support area and then bounce upward, breaking out of the triangle pattern. If this plays out, I anticipate further upward movement, with my target set at 1.0950 points. Please share this idea with your friends and click Boost 🚀

EUR/USD analysis – two Key Scenarioshello guys.
The EUR/USD pair has witnessed a strong bullish surge, breaking through key resistance levels. However, two possible scenarios emerge from this critical point:
🔴 First Scenario (Bullish Continuation):
Price could retrace to the 1.07-1.072 demand zone before resuming its upward trajectory.
If support holds, the pair may climb towards the 1.10-1.105 resistance zone, aligning with the upper boundary of the ascending channel.
🔵 Second Scenario (Bearish Reversal):
If bullish momentum fades, a deeper correction may follow, breaking below the key support zone.
This could lead the price toward the 1.04-1.043 area, marking a retest of previous lows and reinforcing bearish sentiment.
-------------------
Conclusion:
The current level serves as a critical decision point. If price sustains above support ($1.072-$1.068), bullish momentum may continue. However, a break below could signal a bearish correction, shifting market sentiment. Traders should watch key levels for confirmation of either scenario.

EURUSD Short IdeaTrade entered. Entry rules met.
Confluences:
✅ Bearish overall bias
✅ Bearish demand zone
✅ Bearish impulse crab pattern
✅ Bearish divergence
✅ Bearish break of structure
✅ Entering London close zone
✅ Price is in entry zone
✅ Required risk:reward met
⭐ I shared this watch zone in my weekly forex outlook this week, you can subscribe by clicking the link in my bio.

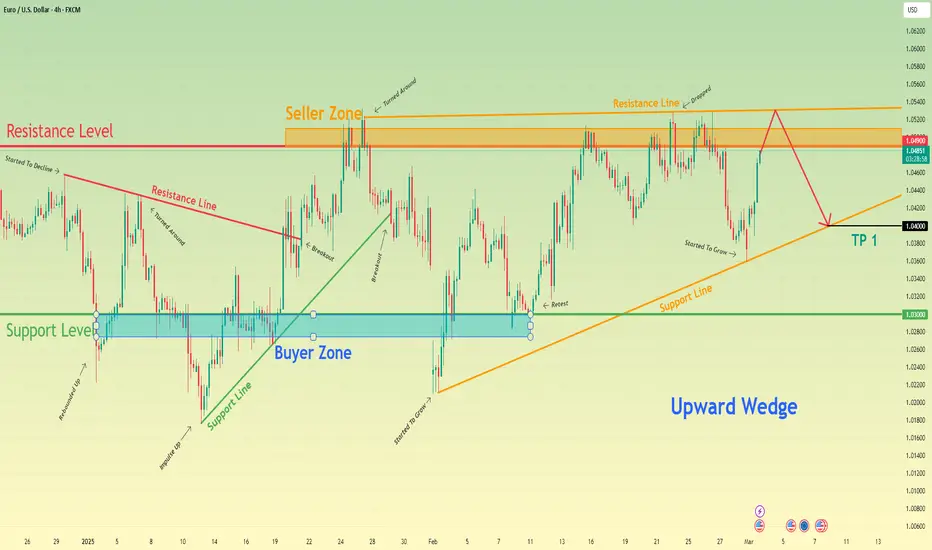
Euro can reach resistance line of wedge and then drop to $1.0400Hello traders, I want share with you my opinion about Euro. Observing the chart, we can see that the price reached the resistance line before beginning to decline. Shortly after, the Euro dropped to the support level, aligning with the buyer zone, then rebounded back to the resistance line before falling again and breaking below the 1.0300 level. Following that, the Euro made a strong upward move, pushing past the resistance level and briefly entering the seller zone. However, the price quickly reversed and started declining within a wedge pattern, eventually breaking through the support line as well. It then fell to the lower boundary of the wedge, forming a gap before beginning to climb again. Not long after, the Euro broke above the 1.0300 level, retested it, and surged toward the resistance level, where it immediately re-entered the seller zone. After some consolidation in this area, the price dropped back to the wedge’s support line, breaking below 1.0490 once again. Recently, however, it rebounded and is now trading near the 1.0490 resistance level. From my perspective, the Euro has the potential to rise toward the wedge’s resistance line, breaking above the resistance level before reversing downward. If that happens, I expect the price to break below 1.0490 again and continue falling toward the wedge’s support line. That’s why I’ve set my TP at 1.0400, as it aligns with this key level. Please share this idea with your friends and click Boost 🚀
EUR/USD: Double Top Formation with Potential Downside TargetTechnical Analysis:
The EUR/USD chart shows the formation of a double top pattern around the 1.0480 level, which is commonly interpreted as a bearish reversal signal. The price action highlights that the previous resistance level has been tested twice, with an inability to break above this level, suggesting that selling pressure is building. Additionally, a broken trendline (indicated in the chart) supports the likelihood of a downward move.
The price has already broken below the ascending trendline, confirming the weakening bullish momentum. The target for this pattern is located at around 1.0325, which aligns with previous support levels and the projected completion of the pattern.
________________________________________
Fundamental Analysis:
Fundamentally, several factors could contribute to a potential downside for EUR/USD:
Economic Data Releases:
The Eurozone has been facing challenges with economic growth, particularly due to inflationary pressures and the ongoing impact of global supply chain disruptions.
On the other hand, the US economy has shown resilience, with strong labor market reports and consumer spending data that may indicate continued strength. If these trends persist, the USD could gain strength relative to the EUR.
Monetary Policy Divergence:
The European Central Bank (ECB) has been cautious in raising interest rates, with a focus on stimulating growth in the region. This contrasts with the US Federal Reserve, which has been tightening its monetary policy more aggressively to combat inflation.
The divergence in monetary policy could continue to support the USD, adding downward pressure on the EUR/USD pair.
Geopolitical Events:
Ongoing geopolitical uncertainties, including the impact of global trade tensions and regional conflicts, could further affect the Eurozone's economic outlook, while the USD might benefit as a safe haven in times of uncertainty.
________________________________________
Conclusion: With both technical and fundamental factors pointing to a potential bearish scenario for EUR/USD, traders should be cautious of further downside movement. The key support around 1.0325 is critical, and a break below this level could open up further downside towards the next support levels.

Euro can reach resistance level, break it and continue to growHello traders, I want share with you my opinion about Euro. A few days ago, the price entered a wedge pattern, where it immediately rebounded from the support line into the seller's zone. It then started to decline, quickly dropping to the 1.0355 support level, which aligned with the buyer's zone. Following this, the Euro experienced a sharp gap down, breaking out of the wedge and falling below the support level. However, it soon reversed direction and began to rise, reaching the support level again and breaking through it. After that, the Euro continued moving upward within the range formed by the resistance and support lines. It first corrected to the support line before making a strong push toward the support-turned-resistance level. After breaking it and completing a retest, the price climbed further to the resistance line. From there, it briefly pulled back before making another upward move, reaching the seller's zone, which coincided with a key resistance level. The price consolidated near this level for some time before dropping to the support line. However, not long ago, it rebounded and started to rise again. In this scenario, I expect the price to continue its upward movement toward the resistance level. If it manages to break through, a retest could follow before further growth. Based on this, I have set my TP at 1.0580. Please share this idea with your friends and click Boost 🚀

Euro can bounce from support line of channel and continue growHello traders, I want share with you my opinion about Euro. A few days ago, the price entered a downward channel, breaking through the 1.0520 level, which aligned with the seller’s zone, and continued its decline. Shortly after, it dropped even lower but quickly rebounded, almost reaching the resistance line of the channel before falling back to the support line, breaking the 1.0285 level. Following this move, the price once again climbed to the resistance line but then swiftly dropped back before making a strong upward push, breaking the 1.0285 level and exiting the channel. After that, the Euro rallied toward the resistance level but soon pulled back into the buyer’s zone, forming a strong gap. From there, the price began moving inside an upward channel, rising to the resistance level, making a brief correction, and then climbing back to resistance. However, after this move, the Euro reversed and started to decline. Given this setup, I expect the price to reach the support line of the channel before continuing its upward movement within the channel, potentially breaking the resistance level. If this scenario plays out, I have set my TP at 1.0600 points. Please share this idea with your friends and click Boost 🚀

EUR/USD at a Crossroads: Will Trade Tensions Push It Lower? EUR/USD has been struggling to maintain momentum above the 1.0500 mark, facing renewed selling pressure as macroeconomic and geopolitical factors influence sentiment. With the US Dollar regaining strength and concerns about European economic stagnation growing, the pair remains vulnerable to further downside.
Technical Analysis:
Resistance Levels: 1.0532 (January 27 high), 1.0629 (December peak), 1.0744 (200-day SMA).
Support Levels: 1.0405 (55-day SMA), 1.0282 (February 10 low), 1.0209 (February 3 low), and 1.0176 (January 13 YTD low).
Indicators: The Relative Strength Index (RSI) is near 55, indicating modest momentum, while the Average Directional Index (ADX) remains around 15, suggesting a weakening trend.
Moving Averages: The 200-day SMA at 1.0744 serves as a key dynamic resistance, while the 55-day SMA at 1.0405 acts as interim support.
Fundamental Analysis:
Several key fundamental factors are exerting downward pressure on EUR/USD:
Trade Policy Uncertainty: While US tariff tensions have temporarily eased, lingering trade disputes, including a 10% duty on Chinese imports and potential EU-targeted tariffs, keep investors cautious.
Diverging Central Bank Policies: The Federal Reserve remains firm on keeping interest rates elevated, while the European Central Bank has begun rate cuts, signaling weaker economic confidence in the Eurozone.
Economic Growth Divergence: The US economy continues to show resilience with robust labor markets and stable inflation, while the Eurozone faces stagnation and potential contraction, particularly in Germany.
European Political Risks: Uncertainty in Germany and wider Eurozone economic struggles add to the Euro’s bearish outlook, making it less attractive compared to the US Dollar.
The EUR/USD pair is at a critical juncture, with key support levels in focus. Trade policies, central bank divergence, and economic growth disparities continue to drive market sentiment. This week is pivotal for the Eurozone, with key economic data releases culminating in Friday’s PMI figures, which could determine the pair’s next major move. Traders should remain cautious and closely monitor both technical and fundamental developments.
Note: Please remember to adjust this trade idea according to your individual trading conditions, including position size, broker-specific price variations, and any relevant external factors. Every trader’s situation is unique, so it’s crucial to tailor your approach to your own risk tolerance and market environment.

Euro may continue to rise inside wedge, after a small correctionHello traders, I want share with you my opinion about Euro. Analyzing the chart, we can see that the price initially climbed from the support line, which lies within the buyer zone, and quickly advanced to the resistance level, aligning with the seller zone. Following this movement, the price pulled back from the 1.0440 level and corrected down to the support line. It hovered around this level for a while before breaking through and dropping into the buyer zone, creating a gap. After that, the Euro began moving upward within a broadening wedge, but soon it retraced back to the support level again. From there, it rebounded and climbed to the resistance level, eventually breaking through and rising toward the upper boundary of the broadening wedge. However, at that point, the price reversed direction and started declining, quickly falling to the support line of the wedge and breaking the resistance level once again. Recently, the Euro bounced off this line and broke above the 1.0440 level again. Currently, it is trading within the seller zone, and I anticipate a correction toward the support line of the broadening wedge before the price resumes its upward movement. Given this outlook, my TP is set at 1.0540 points. Please share this idea with your friends and click Boost 🚀

Euro can drop from seller zone to 1.0350 pointsHello traders, I want share with you my opinion about Euro. Looking at the chart, we can observe that the price was moving within a downward channel. After bouncing off the resistance line, it quickly dropped to the 1.0480 resistance level. It then broke below this level and continued to decline inside the channel until eventually breaking out and transitioning into a ranging phase. Within this range, the Euro dipped into the buyer zone, even slightly below it, before reversing and making a strong upward impulse toward the resistance level, briefly entering the seller zone. After that, the price dropped back into the range and soon made a sharp gap down, returning to the buyer zone. However, following this movement, the Euro started to rise again, climbing back to the 1.0480 resistance level in a short period and forming another gap in the process. The price even touched the seller zone before pulling back slightly and is now hovering near the 1.0480 level. Given this setup, I anticipate a rejection from the seller zone, leading to a decline. Based on this, my TP is set at 1.0350 within the range. Please share this idea with your friends and click Boost 🚀

Euro can drop to support level, exiting from pennantHello traders, I want share with you my opinion about Euro. When analyzing the chart, it’s clear that the price initially climbed to the resistance level, which overlapped with the seller zone, but immediately bounced back and dropped to the support level. Shortly after, the Euro broke through the support level, falling below the buyer zone. However, it quickly reversed and began rising within an upward channel. Within this channel, the Euro broke the 1.0265 support level and performed a retest, consolidating near that level for a while before continuing its upward momentum. Eventually, the Euro reached the resistance level, broke through it, and moved up to the resistance line of the channel, ultimately exiting the channel. Afterward, the price formed its first gap and started declining within a pennant pattern, where it soon broke the 1.0435 resistance level. Later, the price created a strong second gap, dropped below the support level, and hit the pennant's support line. From there, the Euro began rising again, breaking the support level once more and climbing back to the resistance level. However, not long ago, the price fell back to the pennant’s support line, creating a third gap. In my view, the Euro can attempt to rise to 1.0360 before dropping back to the support level and exiting the pennant pattern. For this reason, I’ve set my take-profit target at the 1.0265 support level. Please share this idea with your friends and click Boost 🚀

Euro could rise to 1.0560 points within the wedgeHello traders, I want share with you my opinion about Euro. By observing the chart, we can see that the price traded near the seller zone, which coincided with the resistance level and when it moved up, it at once turned around and dropped to the 1.0350 level, breaking the resistance level. Then price started to grow inside the pennant, where it rose higher than the resistance level again, making a gap and later even reaching the resistance line of the pennant pattern. After this movement, the Euro started to decline and quickly fell to the support line of the pennant, breaking the 1.0510 level and soon it exited from the pennant pattern and then fell to the support level, which coincided with the buyer zone. Then the price rose a little and dropped to 1.0220 points, breaking the support level too. But soon, the Euro turned around and made impulse up, breaking the support level again and even later started to trades inside the wedge. In this pattern price first made a correction to the support line and then in a short time rose back to the support level, broke it, and continued to move up. Later price reached a resistance level, but a not long time ago it rebounded and fell to the support line, which recently bounced and started to grow. So, in my opinion, the Euro can continue to move up in wedge to resistance line, breaking resistance level. For this reason, I set my TP near the resistance line, at 1.0560 points. Please share this idea with your friends and click Boost 🚀

Euro can enter to seller zone and then drop to support lineHello traders, I want share with you my opinion about Euro. Observing the chart, we can see how the price a few moments ago price entered to wedge and started to decline, but firstly it entered to seller zone and then bounced down. In a short time, the Euro declined to the support level, which coincided with the buyer zone, and soon broke this level and fell to the support line of the wedge. Then the price turned around and started to grow. Euro quickly rose to the support level, broke this level one more time, and made a retest, after which rose a little more. After this movement, the EUR some time traded near the support level until it reached the support line of the wedge and then bounced up from this line to the resistance level. When Euro reached this level, it corrected and then continued to move up to the seller zone. When the price entered to this area, the Euro some time traded inside and later reached the resistance line of a wedge, after which rebounded down. Price broke the 1.0420 level and continued to fall. At the moment, the price is traded below this level and I think that the price can fall to rise to the seller zone and then drop to the support line of the wedge. After this, the Euro can exit from this pattern, make a retest, and continue to decline to the support level. So, that's why I set 1st TP at 1.0350 points and 2nd at the 1.0260 level. Please share this idea with your friends and click Boost 🚀

EURCHF : BUY SETUP IN DAY CHARTBUY @ 0.9365
TARGET : 0.9440, 0.9500
STOPLOSS : 0.9315
EURCHF has touched bottom and starting a fresh uptrend.

EURUSD Start?Based on the data, it seems that the Euro will regain its strength and rise in the coming days. There is only one scenario, which is an upward movement. As for the upward move, it will either drop to the yearly low to draw liquidity and then rise, or it has already sufficed with the current level and will continue its ascent without needing additional liquidity.

EURUSD a perspective 25th novemeberhello guys!
I wanna bet on this perspective:)
I believe it would be a hunting in the daily time frame!
Also, this pair engulfed the decision point!
so we can consider a long position here! or wait until another confirmation happens!

EURUSD 25/11/24Starting the week a little later than usual with a markup on EUR/USD. Following weeks and months of bearish price action, we continue to anticipate further downside movement. This outlook aligns with our daily bias, which indicates a bearish trend.
The market opened with a significant gap to the upside across most brokers, increasing the likelihood of the gap being closed. Additionally, there is an untapped supply area above the current price level. Two liquidity highs are situated above this area, suggesting a potential pullback to liquidate these levels. If this occurs, we will look for continued sell-side movement.
However, pullbacks are not guaranteed during trending conditions. If the price continues to expand downward without retracing, our first target will be the gap left open at the market's opening. Beyond that, we will focus on the major low marked at the base of the current move.
Please be mindful of key fundamental events this week, as they may cause a midweek shift in our bias. For now, our outlook remains bearish, and we are focused on identifying sell opportunities. Refer to the points on our charts for guidance on potential downside movement.
If the supply area and liquidity highs are reached but fail to trigger a bearish shift, it may signal a deeper pullback on higher timeframes.
Stick to your plan, manage your risk, and trade safely. Wishing you an amazing trading week!

EUR/USD - Double Top Indicates Potential Reversalhello guys.
Formation of Double Top:
The EUR/USD has created a clear double top around the 1.1250 level, signaling potential exhaustion in the bullish trend.
Breakdown and Retest:
The price has broken below the key support zone near 1.1000, now acting as resistance, where sellers may enter the market.
A possible short-term retest of the entry zone (1.1000 - 1.1020) is expected before a continued decline.
Target Area:
The projected target for this downtrend lies in the 1.0780 - 1.0820 support zone, marked in purple, where buyers might re-emerge.
Channel Support:
The long-term ascending channel provides additional confluence near the target zone, acting as a potential support area for reversal or consolidation.

EURUSD: Detailed Support & Resistance Analysis 🇪🇺🇺🇸
Here is my latest structure analysis
and important support and resistance levels to trade on EURUSD
next week.
Consider these structures for pullback/breakout trading.
❤️Please, support my work with like, thank you!❤️
