EURO-USD

EUR USD LEVELS OF TENDENCYEUR/USD
-Typically tendency levels marked by black levels
-Red rectangle show measured move calls overbalance
-Possible direction when price will break the levels of tendency , marked by arrows
-Remember about money management and take care about investment.
----------------------------------------------------------------------------------------------
-What do you think ?
-How about your idea ?
-Let's Talk !
----------------------------------------------------------------------------------------------

EURO USD Posible PullbackWe Think Euro Can Possible Pullback to the Preview Suport 1.13600 We Draw ABCD Patern and Exatly our analysis Told Us is time for Pullback
Stop Lose 1.1260
Take Profit 1.1590

A Case Of Resistance Turned Into SupportHello Traders
Yet another tactical setup on my favorite pair.
This setup is what I consider the classic case of resistance turning into support.
The trendline was broken now looking to re-position my trades in a new upward momentum.
If that doesn't happen further capitulation could ensue and possible test of 1.12 level.
Trade safe, trade well.

euro-usd technical analysisin one hour the euro-us dollar will have a contente of discente down TP1 and TP2

EURUSD SHORT1. AB=CD Pattern completion
2. Looking to short with a good RR.PREFERABLY AROUND 0.786 LEVEL, which is also at structure level
3. Need to watch price action and wait for short entry
4. Price is at top of channel
* Rally in price means we will need to be much more conservative and wait for more short entry confirmation first.

The pair updates the lows
On the chart, we observe that the pair has updated the annual minima and reached the mark of 1.1205, after which the price was adjusted to the mark of 1.1310.
The price could not overcome this mark and again went down. The Stochastic is still pointing up. The MACD, despite having left the bar graph, is still in the negative zone.
Therefore, we advise you to look for points for entering short positions and set your Take Profits near the level of 1.1205

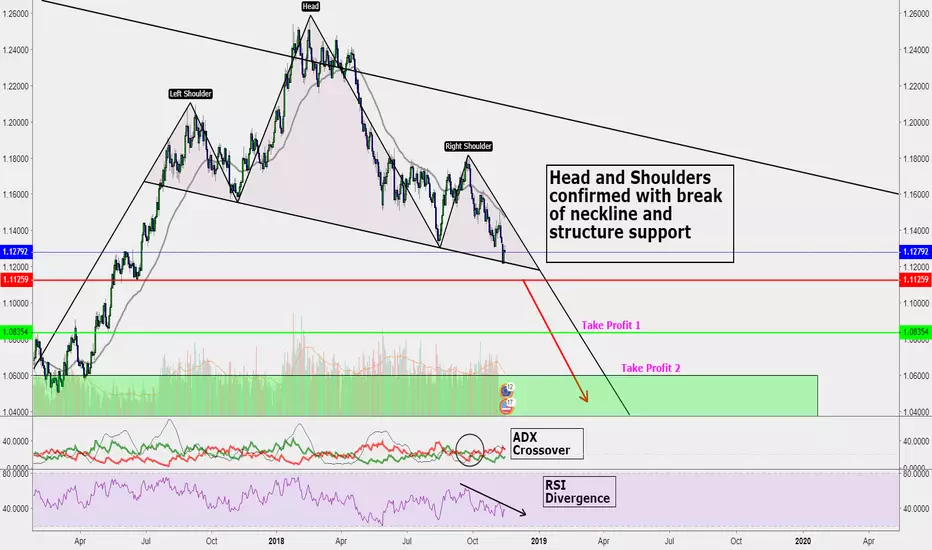
EURO DOLLAR Head and Shoulders Formation on DailyEURO/USD Has formed a Head and Shoulders Pattern on the Daily Timeframe
Bearish Signals:
-RSI Divergence
-ADX Crossover
-Following downward channel seen on weekly chart
-Broke 1.128 Structure Support
EUR/USD Bull Flag Identified in Downtrend Bull Flag formation in down trend.
Look for further retracement before bullish move.
Break out of resistance of bull flag is bullish sign

The pair is turned aroundOur pair rose to the mark 1.490, in which has found the resistance level and at the moment goes to the mark of 1.1310 which previously was the support level.
Our technical indicators point to sale and we believe the local minimums will be updated.
Therefore we advise to look for points to enter short positions, taking into account a possible turn from the above-stated level.
However, in case of its overcoming, the pair can direct to marks 1.1260 and 1.12

EURUSD SHORT1. Good RR at that level.
2. 0.618 fibs level. Rejection can be seen on 1 hr time frame.
3. AB = CD Pattern completion

Trend is changingAt the moment, we are seeing that the pair found support and strongly pushed off from the level of 1.1320 and easily overcomes the resistance levels.
The dollar index continues to decline, and therefore the trend is changing for the pair. We believe that now is a good moment to enter long positions.
Therefore, we advise you to look for points to enter the market for long positions. We assume that the next level will be at the mark of 1.1550.

The pair is consolidatingAt the moment, we observe that the price remains under the mark of 1.1390 and does not demonstrate activity. Technical indicators are multidirectional and the price is in the corridor. We believe that in case of overcoming the mark of 1.1390, the pair will go to the levels of 1.1440 and 1.1490. Otherwise, local minima around 1.1330 and 1.1305 will be updated again.


EUR/USD $1.05 - 1.03 in 2019analysis only based on technicals
massive head and shoulder gives projection to the $1.05 - 1.03 support area

EURUSD dissected... down we go soon. dollar strength increasing, anticipation building, should roll down soon. lmits in place.


EUR/USD - Trade of the weekNot taking this trade, more upside to GBP due to SMT USDX divergence
Next week will be an up-week
- Beautifully engineered liquidity
- Orderblock close to key level
- If 1.45 level holds indicates bullishness


EURUSD SHORTSERIES OF LOWER HIGHS AND LOWER LOWS STILL UNDER PLAY.
25 SMA STILL RESPECTED ON H4 AS OUR BULLS WERE REJECTED AGAIN
TARGETS FROM HERE
1.14333
1.13651
1.13084
ANALYSIS BECOME INVALID IF WE BREAK ABOVE 1.5567

