EURCHF - Important BreakoutHello Traders !
After a huge bullish move, The EURCHF broke the resistance level (0.95814 - 0.95644).
This key level becomes new support !
So, I expect a bullish move🚀
____________
TARGET: 0.96700🎯
Euro

EURUSD Faces Resistance zone – Will Bears Take Over?The EURUSD ( FX:EURUSD ) has reached the Resistance zone($1.0983-$1.0916) as I expected in my previous post . Can the EURUSD break the Resistance zone($1.0983-$1.0916) ?
EURUSD is moving near the Resistance zone($1.0983-$1.0916) , the Resistance line , and Yearly Resistance(1) .
According to the Elliott Wave theory , EURUSD seems to have completed 5 impulse waves and we can expect Corrective Waves .
Also, we can see the Regular Divergence(RD-) between Consecutive Peaks .
I expect the EURUSD to decline to at least the Support zone($1.0817-$1.0760) in the coming hours after breaking the lower line of the ascending channel . One of the EURUSD targets could be as wide as the ascending channel .
Note: If EURUSD breaks the Resistance zone($1.0983-$1.0916), we can expect more pumps.
Please respect each other's ideas and express them politely if you agree or disagree.
Euro/U.S. Dollar Analyze (EURUSD), 1-hour time frame.
Be sure to follow the updated ideas.
Do not forget to put a Stop loss for your positions (For every position you want to open).
Please follow your strategy and updates; this is just my Idea, and I will gladly see your ideas in this post.
Please do not forget the ✅' like '✅ button 🙏😊 & Share it with your friends; thanks, and Trade safe.

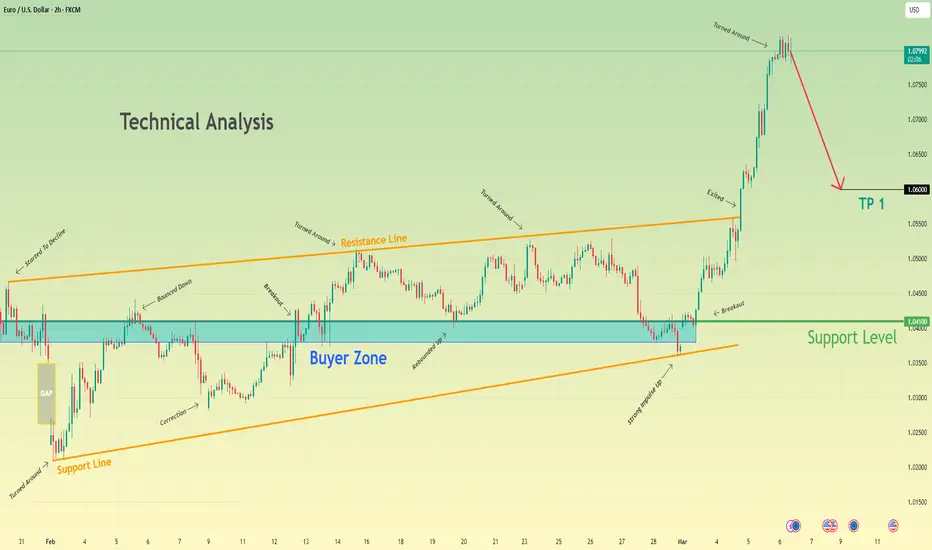
Euro can decline to support area, after which it will rebound upHello traders, I want share with you my opinion about Euro. By analyzing this chart, we can see that the price entered a range before dropping into the buyer zone, which aligned with the lower boundary of the range. After that, it reversed and started to rise, eventually reaching the upper boundary of the range, which coincided with the 1.0515 support level and support area. The price then immediately turned around and fell below but soon bounced back to the support area, consolidating there for a while before breaking lower. Following this, the Euro reversed direction and began to climb, soon reaching the upper boundary of the range and breaking out of this pattern, surpassing the 1.0515 level as well. After this move, it continued to rise within a wedge pattern, eventually reaching the 1.0775 support level, which aligned with another support area, and broke through it too. The price then touched the resistance line of the wedge and made a corrective move toward the support line of the pattern. In my view, the Euro could enter the support area before rebounding toward the resistance line of the wedge. Based on this, I set my TP at 1.1000, as it aligns with this resistance level. Please share this idea with your friends and click Boost 🚀

EUR-AUD Will Go UP! Buy!
Hello,Traders!
EUR-AUD is trading in an
Uptrend and we are now
Seeing a nice bullish reaction
From the horizontal support
Of 1.7153 which reinforces our
Bullish bias and we will be
Expecting the pair grow more
With the target of 1.7417
Buy!
Comment and subscribe to help us grow!
Check out other forecasts below too!
Disclosure: I am part of Trade Nation's Influencer program and receive a monthly fee for using their TradingView charts in my analysis.

Euro Weakens Against USD Ahead of Key Economic DataThe EUR/USD pair declined to around 1.0835 during Friday’s Asian session, as the Euro (EUR) weakened against the US Dollar (USD) amid rising trade tensions between the U.S. and the European Union. Later in the day, market focus will shift to key economic releases, including Germany’s February Harmonized Index of Consumer Prices (HICP) and the preliminary Michigan Consumer Sentiment Index for March.
Key resistance is at 1.0950, followed by 1.1000 and 1.1050. Support stands at 1.0800, with further levels at 1.0730 and 1.0650.

EUROUSD 4H LONG (ALL Targets DONE)This position worked perfectly.
Now it is important to wait for the correction structure, as it was indicated in the previous update post:
Considering the current formations on the 1D TF, the probability of price growth to the current maximum increases multiple times. Locally, I expect to see a price correction (a rollback next week) and preferably with a depiction of a bullish imbalance. After which, you can work long for a whole month until 1.12758

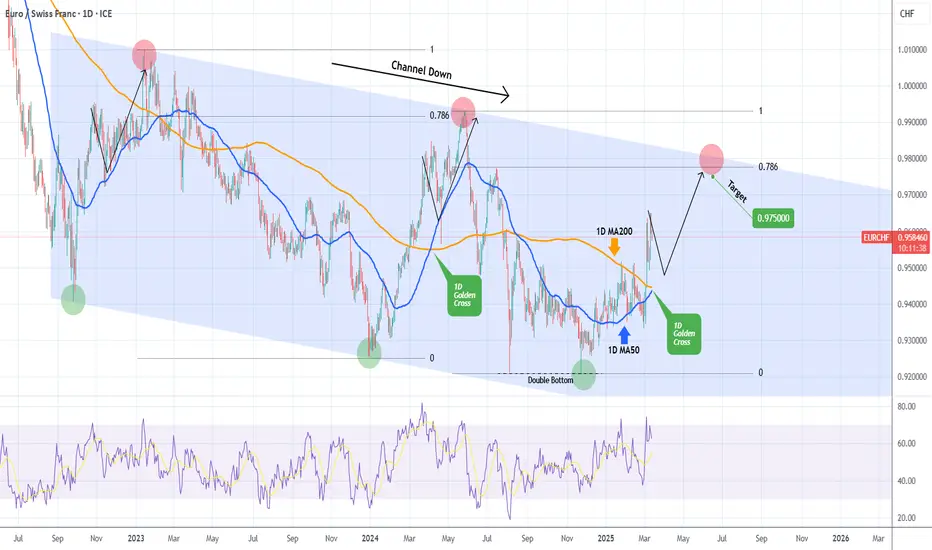
EURCHF 1D Golden Cross for one final push.The EURCHF pair has been trading within a 2.5-year Channel Down pattern and is currently on the latest Bullish Leg that is about to complete a 1D Golden Cross. The last Golden Cross was also during the previous Bullish Leg and caused an initial pull-back that was followed by the pricing of the Channel's Top on the 0.786 Fibonacci level.
As a result, be ready to buy on the next 1D MA50 (blue trend-line) contact and target 0.97500 (just below the 0.786 Fib).
-------------------------------------------------------------------------------
** Please LIKE 👍, FOLLOW ✅, SHARE 🙌 and COMMENT ✍ if you enjoy this idea! Also share your ideas and charts in the comments section below! This is best way to keep it relevant, support us, keep the content here free and allow the idea to reach as many people as possible. **
-------------------------------------------------------------------------------
💸💸💸💸💸💸
👇 👇 👇 👇 👇 👇
EUR/USD Drops, Awaits US PPIEUR/USD fell to around 1.0880 in Thursday’s Asian session, pressured by rising US-EU trade tensions. Market focus is on key US data, including February’s PPI and weekly jobless claims.
Trump warned of retaliation against the EU’s response to his 25% steel and aluminum tariffs. The European Commission announced €26 billion ($28.4 billion) in counter-tariffs on US goods, effective April 1, with more expected mid-April.
Despite trade risks, EUR/USD’s downside may be limited as concerns over Trump’s policies fueling a US recession weigh on the dollar. Inflation data came in lower than expected, easing market fears but keeping sentiment fragile.
Key resistance is at 1.0950, followed by 1.1000 and 1.1050. Support stands at 1.0800, with further levels at 1.0730 and 1.0650.
EURUSD: Trump’s trade war crosses the Atlantic You may be sick of hearing about tariffs, but they are currently the catalyst for a huge amount of volatility in the market and a huge amount of trading opportunities.
And now Trump’s trade war has crossed the Atlantic
Today, the European Union announced retaliatory tariffs on approximately €26 billion worth of U.S. goods in response to President Donald Trump's recent increase in tariffs on steel and aluminum imports. Targeted products include Harley-Davidsons, bourbon, and jeans—key American exports that have been caught in previous trade disputes.
The EU has said it remains open to negotiation but has not ruled out further action.
In response, Trump vowed to retaliate, stating, “Of course I’m going to respond.” The daily chart for the EUR/USD shows the pair could fall into a larger corrective decline, given overbought RSI conditions.

Eurozone Spending Plans Boost EuroThe euro surged past $1.09, its highest in four months, gaining 5% since early March. This rally was driven by Eurozone plans to expand deficit spending, stimulating growth prospects. Germany pushed for a €500 billion infrastructure fund, while France and Italy supported joint EU funding for economic and military initiatives.
The ECB signaled a shift toward a less restrictive policy after last week’s rate cut, suggesting the easing cycle may be nearing its end. Meanwhile, US economic concerns pressured the dollar, further lifting the euro.
Key resistance is at 1.0950, followed by 1.1000 and 1.1050. Support stands at 1.0800, with further levels at 1.0730 and 1.0650.

EUR/USD – Bullish, But Time to Breathe!🚀 EUR/USD – Bullish, But Time to Breathe! 🚀
“Momentum is strong, but even the best trends need to take a breath before the next leg up.”
🔥 Key Insights:
✅ Bullish Structure Intact – No reason to fight the trend.
✅ Overextended Move – Markets don’t go up in a straight line; pullbacks create better entries.
✅ Healthy Retracement = Stronger Continuation – Chasing here is risky, waiting for a dip is smart.
💡 The Plan:
Wait for a Pullback Before Longs – Let price reset, don’t rush in.
Watch Volume Profile & CDV for Buyer Confirmation – Smart money leaves clues.
Ideal Entry = Lower Support Levels Holding – We want a strong base for the next move up.
“Patience is key. Let the market give you the perfect entry—not every green candle is a buy!” 🚀💶
I keep my charts clean and simple because I believe clarity leads to better decisions.
My approach is built on years of experience and a solid track record. I don’t claim to know it all, but I’m confident in my ability to spot high-probability setups.
If you would like to learn how to use the heatmap, cumulative volume delta and volume footprint techniques that I use below to determine very accurate demand regions, you can send me a private message. I help anyone who wants it completely free of charge.
I have a long list of my proven technique below:
🎯 ZENUSDT.P: Patience & Profitability | %230 Reaction from the Sniper Entry
🐶 DOGEUSDT.P: Next Move
🎨 RENDERUSDT.P: Opportunity of the Month
💎 ETHUSDT.P: Where to Retrace
🟢 BNBUSDT.P: Potential Surge
📊 BTC Dominance: Reaction Zone
🌊 WAVESUSDT.P: Demand Zone Potential
🟣 UNIUSDT.P: Long-Term Trade
🔵 XRPUSDT.P: Entry Zones
🔗 LINKUSDT.P: Follow The River
📈 BTCUSDT.P: Two Key Demand Zones
🟩 POLUSDT: Bullish Momentum
🌟 PENDLEUSDT.P: Where Opportunity Meets Precision
🔥 BTCUSDT.P: Liquidation of Highly Leveraged Longs
🌊 SOLUSDT.P: SOL's Dip - Your Opportunity
🐸 1000PEPEUSDT.P: Prime Bounce Zone Unlocked
🚀 ETHUSDT.P: Set to Explode - Don't Miss This Game Changer
🤖 IQUSDT: Smart Plan
⚡️ PONDUSDT: A Trade Not Taken Is Better Than a Losing One
💼 STMXUSDT: 2 Buying Areas
🐢 TURBOUSDT: Buy Zones and Buyer Presence
🌍 ICPUSDT.P: Massive Upside Potential | Check the Trade Update For Seeing Results
🟠 IDEXUSDT: Spot Buy Area | %26 Profit if You Trade with MSB
📌 USUALUSDT: Buyers Are Active + %70 Profit in Total
🌟 FORTHUSDT: Sniper Entry +%26 Reaction
🐳 QKCUSDT: Sniper Entry +%57 Reaction
📊 BTC.D: Retest of Key Area Highly Likely
I stopped adding to the list because it's kinda tiring to add 5-10 charts in every move but you can check my profile and see that it goes on..

Eur/Usd (Mar/12) Weekly Analyzehello everyone.
a you can see price touched weekly cloud res ( same as monthly cloud ) so i expect price go down from here.
.......................................
( This is an idea and entry-tp-sl placed for my own trade , you can change entry-tp-sl depends on your risk management )

EURUSD’s Pullback in Play: Next Stop $1.0934?The EURUSD ( FX:EURUSD ) has managed to break through the Resistance zone($1.0817-$1.0760) and has been on a good upward trend with good momentum in the past week.
The EURUSD appears to be completing a pullback to the Resistance zone (broken) .
According to the Elliott Wave theory , the EURUSD appears to have completed wave 4 , which is a Double Three Correction(WXY) .
I expect EURUSD to rise to the Resistance zone($1.0983-$1.0916) after completing the pullbac k.
Note: If EURUSD goes below $1.0755, we can expect more dumps.
Please respect each other's ideas and express them politely if you agree or disagree.
Euro/U.S. Dollar Analyze (EURUSD), 1-hour time frame.
Be sure to follow the updated ideas.
Do not forget to put a Stop loss for your positions (For every position you want to open).
Please follow your strategy and updates; this is just my Idea, and I will gladly see your ideas in this post.
Please do not forget the ✅' like '✅ button 🙏😊 & Share it with your friends; thanks, and Trade safe.

EURUSD entering multiyear Sell Zone, but might go to 1.160 firstEURUSD hit this week its 1month MA50 for the first time since October 2024. This is the first long term Sell Zone for the pair.
The 1month MA50 - MA100 Zone has formed the last two major peaks of the market (September 2024 and July 2023), so it is highly likely to see a top getting formed here in March-April.
Since however the 10year pattern is a Channel Down and the major bullish wave in 2017 was +21.67%, there is a possibility to see an overextension of the trend a little higher than the 1month MA100.
A max +21.67% rise would take the price a little over 1.1600, which would approach the 1month MA200 (10year Resistance).
This scenario is also supported by the 1month RSI, which during this 10 year span has topped twice at 665.00 and as you see makes a very distinct (nearly) Double Top formation.
In both cases, long term traders/ investors may target below parity prices at around 0.9000.
Follow us, like the idea and leave a comment below!!

EurUsd ShortEUR/USD Short Idea
The EUR/USD pair is approaching the 1.09700--1.09940--1.10204 resistance level, which aligns with a significant supply zone and a potential area for bearish reversal.
Key Analysis:
Resistance Zone:
The 1.09700--1.09940--1.10204 levels marks a critical resistance where selling pressure has previously emerged.
Technical Indicators:
RSI is approaching overbought conditions, indicating limited upside potential.
Bearish divergence may form if momentum weakens near this level.
Fundamental Context:
A stronger USD due to hawkish Fed sentiment or economic data could pressure EUR/USD downward.
Eurozone economic uncertainties may add to bearish bias.
Entry: Short positions around 1.09700--1.09940--1.10204
This setup offers a favorable risk-reward opportunity in a high-probability reversal zone.

EURUSD - BULLISH SCENARIOHello Traders !
On Friday 7 March, The EURUSD reached the resistance level (1.09374 - 1.08834).
Let's expect the BULLISH SCENARIO:
If the market breaks above the resistance level and closes above that,
We will see a bullish move📈
TARGET: 1.11580🎯

SHORT ON EUR/CHFEUR/CHF is currently at a major resistance level and his recently mitigated a FVG sitting in the same zone.
Price has been rising in what seems like forever on this pair, we finally have gotten our change of character (choc) to the downside with sweeps of liquidity and fvg's now balanced out.
I expect price to fall to the next demand level where plenty of liquidity sits.
I am selling EUR/CHF now looking to make over 200 pips to the downside.

Euro H1 | Falling toward a swing-low supportThe Euro (EUR/USD) is falling towards a swing-low support and could potentially bounce off this level to climb higher.
Buy entry is at 1.0809 which is a swing-low support.
Stop loss is at 1.0755 which is a level that lies underneath a swing-low support and the 23.6% Fibonacci retracement.
Take profit is at 1.0929 which is a swing-high resistance.
High Risk Investment Warning
Trading Forex/CFDs on margin carries a high level of risk and may not be suitable for all investors. Leverage can work against you.
Stratos Markets Limited (www.fxcm.com):
CFDs are complex instruments and come with a high risk of losing money rapidly due to leverage. 63% of retail investor accounts lose money when trading CFDs with this provider. You should consider whether you understand how CFDs work and whether you can afford to take the high risk of losing your money.
Stratos Europe Ltd (www.fxcm.com):
CFDs are complex instruments and come with a high risk of losing money rapidly due to leverage. 63% of retail investor accounts lose money when trading CFDs with this provider. You should consider whether you understand how CFDs work and whether you can afford to take the high risk of losing your money.
Stratos Trading Pty. Limited (www.fxcm.com):
Trading FX/CFDs carries significant risks. FXCM AU (AFSL 309763), please read the Financial Services Guide, Product Disclosure Statement, Target Market Determination and Terms of Business at www.fxcm.com
Stratos Global LLC (www.fxcm.com):
Losses can exceed deposits.
Please be advised that the information presented on TradingView is provided to FXCM (‘Company’, ‘we’) by a third-party provider (‘TFA Global Pte Ltd’). Please be reminded that you are solely responsible for the trading decisions on your account. There is a very high degree of risk involved in trading. Any information and/or content is intended entirely for research, educational and informational purposes only and does not constitute investment or consultation advice or investment strategy. The information is not tailored to the investment needs of any specific person and therefore does not involve a consideration of any of the investment objectives, financial situation or needs of any viewer that may receive it. Kindly also note that past performance is not a reliable indicator of future results. Actual results may differ materially from those anticipated in forward-looking or past performance statements. We assume no liability as to the accuracy or completeness of any of the information and/or content provided herein and the Company cannot be held responsible for any omission, mistake nor for any loss or damage including without limitation to any loss of profit which may arise from reliance on any information supplied by TFA Global Pte Ltd.
The speaker(s) is neither an employee, agent nor representative of FXCM and is therefore acting independently. The opinions given are their own, constitute general market commentary, and do not constitute the opinion or advice of FXCM or any form of personal or investment advice. FXCM neither endorses nor guarantees offerings of third-party speakers, nor is FXCM responsible for the content, veracity or opinions of third-party speakers, presenters or participants.

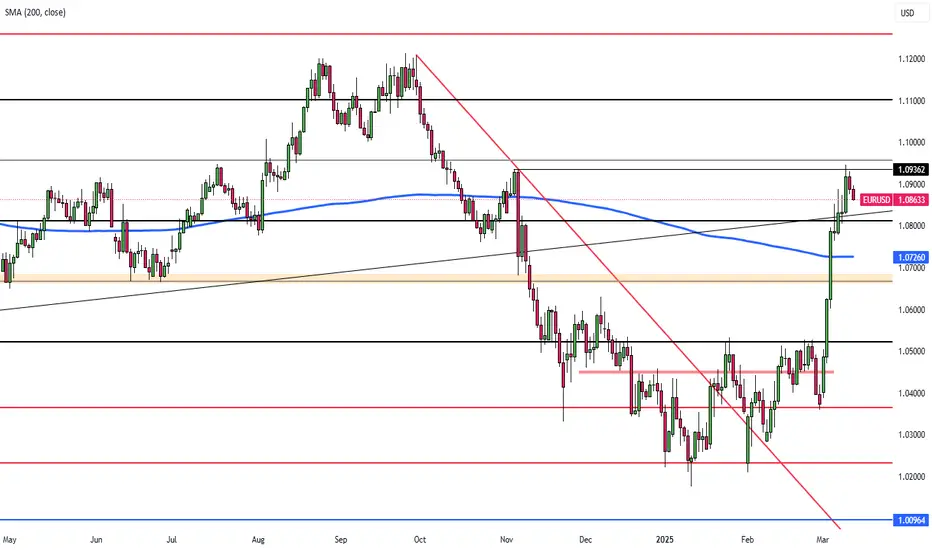
EURUSD on its 1W MA200 after 5 months.The EURUSD pair hit on Friday its 1W MA200 (orange trend-line) for the first time in 5 months (since October 03 2024). This is a major Resistance level which initiated a strong -4.00% decline on December 28 2023.
In fact -4.00% declines have been quite common for EURUSD in the past 2 years. However, the pair's strongest Resistance level has been the 1M MA100 (red trend-line) which has formed both market tops on October 01 2024 and July 18 2023.
As a result, the most optimal sell entry would be when the 1W RSI hits its Resistance Zone, with the price probably close to the 1M MA100 within the Lower Highs Zone. On the long-term, the R/R has shifted dramatically in favor of selling right now. If the rejection does happen on the 1W MA200 eventually and won't close any 1W candle above it, we have a short-term Target at 1.04600 (-4.00% decline) and if the rejection takes place higher, we will be expecting a bottom near parity with a technical Target at 1.00500 (Lower Lows Zone).
-------------------------------------------------------------------------------
** Please LIKE 👍, FOLLOW ✅, SHARE 🙌 and COMMENT ✍ if you enjoy this idea! Also share your ideas and charts in the comments section below! This is best way to keep it relevant, support us, keep the content here free and allow the idea to reach as many people as possible. **
-------------------------------------------------------------------------------
Disclosure: I am part of Trade Nation's Influencer program and receive a monthly fee for using their TradingView charts in my analysis.
💸💸💸💸💸💸
👇 👇 👇 👇 👇 👇

Euro can rebound up from support line to 1.1000 pointsHello traders, I want share with you my opinion about Euro. Looking at this chart, we can see that a few days ago, the price entered a range, where it immediately broke through the 1.0425 support level, which aligned with the buyer zone, and then moved to the upper part of the range. After trading near this area for some time, the price dropped back to the buyer zone, reaching the support line before starting to rise again. Soon, the Euro broke the 1.0425 level once more and later exited the range, continuing its upward movement. Not long after, the price climbed to the 1.0805 support level, which coincided with a support area. It traded around this level for a while before breaking through it as well. Following that, the Euro reached the resistance line, reversed, and corrected back to the support area, where it found support again. Recently, it rebounded and started moving upward. Given this, I expect a further rebound from the support line and a breakout above the resistance line. Based on this scenario, my TP is set at 1.1000 points Please share this idea with your friends and click Boost 🚀

EURUSD Weekly FOREX Forecast: March 10 - 14thIn this video, we will analyze EURUSD and EUR Futures. We'll determine the bias for the upcoming week, and look for the best potential setups.
While the USD is bearish, the EUR is finding strength to the upside. This is noted in the very strong Friday candle. Meh NFP numbers, tariffs and trade wars are pulling the USD down, allowing the EUR and the other majors to move higher.
Look for a retracement to the +FVG in the beginning of the week. This could potentially set up the higher probability buy setup that potentially forms there.
Enjoy!
May profits be upon you.
Leave any questions or comments in the comment section.
I appreciate any feedback from my viewers!
Like and/or subscribe if you want more accurate analysis.
Thank you so much!
Disclaimer:
I do not provide personal investment advice and I am not a qualified licensed investment advisor.
All information found here, including any ideas, opinions, views, predictions, forecasts, commentaries, suggestions, expressed or implied herein, are for informational, entertainment or educational purposes only and should not be construed as personal investment advice. While the information provided is believed to be accurate, it may include errors or inaccuracies.
I will not and cannot be held liable for any actions you take as a result of anything you read here.
Conduct your own due diligence, or consult a licensed financial advisor or broker before making any and all investment decisions. Any investments, trades, speculations, or decisions made on the basis of any information found on this channel, expressed or implied herein, are committed at your own risk, financial or otherwise.

After strong impulse up, Euro makes correction to 1.0600 pointsHello traders, I want share with you my opinion about Euro. Looking at the chart, we can see that the price entered a wedge formation and immediately started to decline. The Euro broke through the 1.0410 level, creating a strong gap before reaching the wedge's support line and beginning to rise. In a short time, it climbed back to the support level and attempted to break it but failed, pulling back slightly. After that, the Euro returned to the 1.0410 support level and finally managed to break through. Following this move, it reached the resistance line of the wedge and made a correction down to the support level. Then, the Euro pushed back up to the resistance line, consolidating near it for a while before dropping to the buyer zone, where it later touched the wedge’s support line again. From there, it made a strong upward impulse, breaking the 1.0410 level once more, exiting the wedge, and surging to 1.0820. However, more recently, the price reversed and started to decline. I believe the Euro may enter a corrective phase after such a strong upward move. Based on this, my TP is set at 1.0600 points. Please share this idea with your friends and click Boost 🚀
EUR/UDS D1 | Heading into swing-high resistanceThe Euro (EUR/USD) is rising towards a swing-high resistance and could potentially reverse off this level to drop lower.
Sell entry is at 1.0929 which is a swing-high resistance.
Stop loss is at 1.1031 which is a level that sits above the 78.6% Fibonacci retracement and a pullback resistance.
Take profit is at 1.0728 which is a pullback support.
High Risk Investment Warning
Trading Forex/CFDs on margin carries a high level of risk and may not be suitable for all investors. Leverage can work against you.
Stratos Markets Limited (www.fxcm.com):
CFDs are complex instruments and come with a high risk of losing money rapidly due to leverage. 63% of retail investor accounts lose money when trading CFDs with this provider. You should consider whether you understand how CFDs work and whether you can afford to take the high risk of losing your money.
Stratos Europe Ltd (www.fxcm.com):
CFDs are complex instruments and come with a high risk of losing money rapidly due to leverage. 63% of retail investor accounts lose money when trading CFDs with this provider. You should consider whether you understand how CFDs work and whether you can afford to take the high risk of losing your money.
Stratos Trading Pty. Limited (www.fxcm.com):
Trading FX/CFDs carries significant risks. FXCM AU (AFSL 309763), please read the Financial Services Guide, Product Disclosure Statement, Target Market Determination and Terms of Business at www.fxcm.com
Stratos Global LLC (www.fxcm.com):
Losses can exceed deposits.
Please be advised that the information presented on TradingView is provided to FXCM (‘Company’, ‘we’) by a third-party provider (‘TFA Global Pte Ltd’). Please be reminded that you are solely responsible for the trading decisions on your account. There is a very high degree of risk involved in trading. Any information and/or content is intended entirely for research, educational and informational purposes only and does not constitute investment or consultation advice or investment strategy. The information is not tailored to the investment needs of any specific person and therefore does not involve a consideration of any of the investment objectives, financial situation or needs of any viewer that may receive it. Kindly also note that past performance is not a reliable indicator of future results. Actual results may differ materially from those anticipated in forward-looking or past performance statements. We assume no liability as to the accuracy or completeness of any of the information and/or content provided herein and the Company cannot be held responsible for any omission, mistake nor for any loss or damage including without limitation to any loss of profit which may arise from reliance on any information supplied by TFA Global Pte Ltd.
The speaker(s) is neither an employee, agent nor representative of FXCM and is therefore acting independently. The opinions given are their own, constitute general market commentary, and do not constitute the opinion or advice of FXCM or any form of personal or investment advice. FXCM neither endorses nor guarantees offerings of third party speakers, nor is FXCM responsible for the content, veracity or opinions of third-party speakers, presenters or participants.
