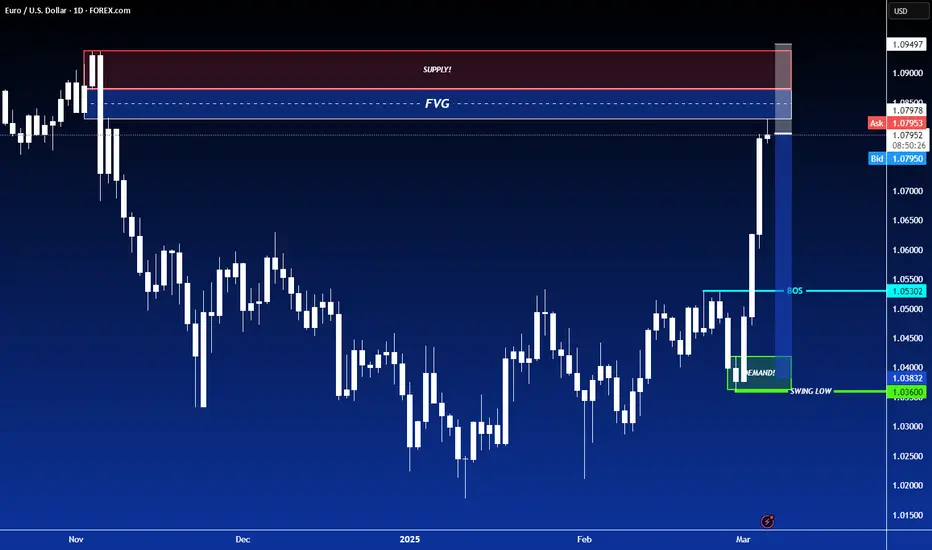
SHORT ON EUR/USDEUR/USD has Reached a Major Resistance Area/Zone and is highly over brought.
The Dollar (DXY) is inverted with the Eur/usd negatively. The dollar is highly oversold and should rise from its major Demand zone.
This should cause the Euro to Fall from its resistance zone.
Dollar has news at 8:30 for Unemployment claims. If the news is somehow good for the dollar and causes it to rise, the Euro will have the potential of reaching about 400 pips over the next few days.
I will be selling EUR/USD to the demand level shown.
Euro
Euro/Usd (Mar/06) for rest of the weekHello eveyone.
as you can see price at golden pocket (high to low).alos near cpr Monthly R3 .
I know it's scary to sell at thi moment but this is what i see in chart.
......................................
( This is an idea and entry-tp-sl placed for my own trade , you can change entry-tp-sl depends on your risk management )

EUROUSD 4H LONG (3 Targets DONE)Re-opening in the specified block after confirmation of the level of $1.03744 brings 3 targets for the position.
Considering the current formations on the 1D TF, the probability of price growth to the current maximum increases multiple times. Locally, I expect to see a price correction (a rollback next week) and preferably with a depiction of a bullish imbalance. After which, you can work long for a whole month until 1.12758

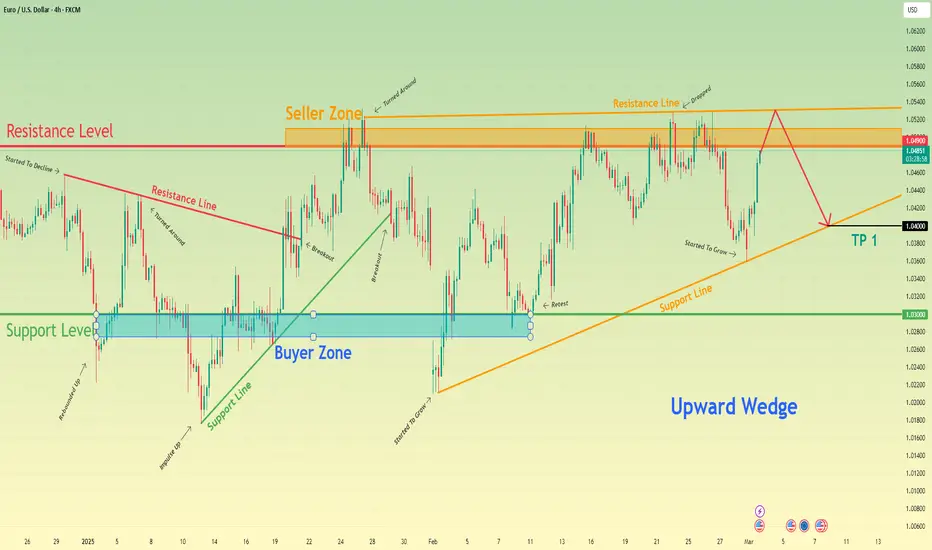
Euro can reach resistance line of wedge and then drop to $1.0400Hello traders, I want share with you my opinion about Euro. Observing the chart, we can see that the price reached the resistance line before beginning to decline. Shortly after, the Euro dropped to the support level, aligning with the buyer zone, then rebounded back to the resistance line before falling again and breaking below the 1.0300 level. Following that, the Euro made a strong upward move, pushing past the resistance level and briefly entering the seller zone. However, the price quickly reversed and started declining within a wedge pattern, eventually breaking through the support line as well. It then fell to the lower boundary of the wedge, forming a gap before beginning to climb again. Not long after, the Euro broke above the 1.0300 level, retested it, and surged toward the resistance level, where it immediately re-entered the seller zone. After some consolidation in this area, the price dropped back to the wedge’s support line, breaking below 1.0490 once again. Recently, however, it rebounded and is now trading near the 1.0490 resistance level. From my perspective, the Euro has the potential to rise toward the wedge’s resistance line, breaking above the resistance level before reversing downward. If that happens, I expect the price to break below 1.0490 again and continue falling toward the wedge’s support line. That’s why I’ve set my TP at 1.0400, as it aligns with this key level. Please share this idea with your friends and click Boost 🚀
EURUSD Channel Up testing 1D MA200 after 4 months!The EURUSD pair has been trading within a Channel Up since the January 13 Low and after the 1D MA50 (blue trend-line) bounce, the current Bullish Leg is testing the 1D MA200 (orange trend-line).
This is the first 1D MA200 test since November 06 2024 and happens to be at the top of the Channel Up with the 1D RSI almost overbought (70.00). These conditions create a low risk opportunity for a short-term Sell. Our Target is the bottom of the Channel Up and the 1D MA50 at 1.04500.
-------------------------------------------------------------------------------
** Please LIKE 👍, FOLLOW ✅, SHARE 🙌 and COMMENT ✍ if you enjoy this idea! Also share your ideas and charts in the comments section below! This is best way to keep it relevant, support us, keep the content here free and allow the idea to reach as many people as possible. **
-------------------------------------------------------------------------------
Disclosure: I am part of Trade Nation's Influencer program and receive a monthly fee for using their TradingView charts in my analysis.
💸💸💸💸💸💸
👇 👇 👇 👇 👇 👇

Eur/Usd Mar/05 Daily biasHello eveyone.
i closed all my longs.last 2 days was great ( check my posts )
price is up almost 3% this week.price above cpr weekly 3rd res . so in this situation i think we will see a pullback.
i'm using tight stop loss.( today ADP...be carefull )
..............................
( This is an idea and entry-tp-sl placed for my own trade , you can change entry-tp-sl depends on your risk management )

Eur/Usd (Mar/04) Weekly biasHello everyone...
as you can see 1.05 to 1.054 is major resistance and if you go to monthly-weekly chart you can see that + weekly 21 ema + D 100 ema-ma
.............
but i think price can go above that area...
Monthly Open above Monthly pivot also right now price is above weekly pivot and euro attacked this area so many times...
( but if price can't close above 1.054 is bad for euro )
.......................................................
( This is an idea and entry-tp-sl placed for my own trade , you can change entry-tp-sl depends on your risk management )

EUR/USD: Double Top Formation with Potential Downside TargetTechnical Analysis:
The EUR/USD chart shows the formation of a double top pattern around the 1.0480 level, which is commonly interpreted as a bearish reversal signal. The price action highlights that the previous resistance level has been tested twice, with an inability to break above this level, suggesting that selling pressure is building. Additionally, a broken trendline (indicated in the chart) supports the likelihood of a downward move.
The price has already broken below the ascending trendline, confirming the weakening bullish momentum. The target for this pattern is located at around 1.0325, which aligns with previous support levels and the projected completion of the pattern.
________________________________________
Fundamental Analysis:
Fundamentally, several factors could contribute to a potential downside for EUR/USD:
Economic Data Releases:
The Eurozone has been facing challenges with economic growth, particularly due to inflationary pressures and the ongoing impact of global supply chain disruptions.
On the other hand, the US economy has shown resilience, with strong labor market reports and consumer spending data that may indicate continued strength. If these trends persist, the USD could gain strength relative to the EUR.
Monetary Policy Divergence:
The European Central Bank (ECB) has been cautious in raising interest rates, with a focus on stimulating growth in the region. This contrasts with the US Federal Reserve, which has been tightening its monetary policy more aggressively to combat inflation.
The divergence in monetary policy could continue to support the USD, adding downward pressure on the EUR/USD pair.
Geopolitical Events:
Ongoing geopolitical uncertainties, including the impact of global trade tensions and regional conflicts, could further affect the Eurozone's economic outlook, while the USD might benefit as a safe haven in times of uncertainty.
________________________________________
Conclusion: With both technical and fundamental factors pointing to a potential bearish scenario for EUR/USD, traders should be cautious of further downside movement. The key support around 1.0325 is critical, and a break below this level could open up further downside towards the next support levels.

Eur/Usd buy Idea Friday Feb/28going to buy euro at golden pocket...TP1 RR:2- TP2 RR:3
( check my last trades )
..............................................
( This is an idea and entry-tp-sl placed for my own trade , you can change entry-tp-sl depends on your risk management )

EUR: watch for a single word that could change everything The European Central Bank (ECB) is set to cut interest rates by 25 basis points at its March 6 meeting, lowering the deposit rate to 2.5%. All 82 economists surveyed by Reuters expect the cut.
So, with this in the bag, the focus shifts to what comes next. Markets see a 60% chance of another cut in April, but hawkish policymakers like Isabel Schnabel are pushing back.
According to ING, a key signal will be whether the ECB drops the term “restrictive” from its stance. If it does, a pause could follow; if not, further cuts may be likely.
Overall, though, the ECB is unlikely to provide detailed forward guidance. Factors like U.S. tariffs and developments in Ukraine could significantly impact the eurozone economy, making it difficult to set a long-term policy path.

Yellow Boy Shorting EurosEUR
With Trump's statements, the wick I was waiting for in the euro came and now I will wait for it to fall below the trend, then I think a nice short awaits us. The 0207 03 region looks good as the first support. I expect DXY to rise to the 108.5 area.

Fundamental Market Analysis for February 28, 2025 EURUSDEUR/USD remains under selling pressure near 1.0390 during Asian trading on Friday. The euro (EUR) is weakening against the US dollar (USD) amid risk-off sentiment. The US Personal Consumption Expenditure (PCE) price index will take centre stage later on Friday.
Late Thursday, US President Donald Trump said that 25 per cent duties on imports from Canada and Mexico will take effect on March 4, rather than April 2 as he had anticipated the day before. Trump also said goods from China would be subject to an additional 10 per cent duties. He also promised this week to impose 25 per cent tariffs on shipments from the European Union. Tariff uncertainty from Trump is likely to weigh on the common currency in the near term.
Cleveland Fed President Beth Hammack said on Thursday she expects the US central bank's interest rate policy to be put on hold for now amid a search for evidence that inflationary pressures are easing and returning to the 2 per cent target. Meanwhile, Atlanta FRB President Raphael Bostic said late Wednesday that the Fed should keep interest rates on hold, which continues to put downward pressure on inflation. The Fed's cautious stance could boost the US Dollar and serve as a headwind for EUR/USD.
Trade recommendation: SELL 1.0380, SL 1.0430, TP 1.0300

Eur/Usd selling Idea for rest of the weekimo feb/24 is the monthly top...with monday candle i think we will see more downside for euro rest of the week.
( This is an idea and entry-tp-sl placed for my own trade , you can change entry-tp-sl depends on your risk management )

EURO is readying for a correction against USD?#EUR chart seems have been weakening , a correction may be on the table.

EURUSD Correcting – Another Fall Ahead?Today I want to analyze EURUSD ( FX:EURUSD ) for a 15-minute time frame and whether EURUSD is ready to fall or not.
EURUSD is moving in a Heavy Resistance zone($1.0537-$1.04500) . It also moves in the descending channel in the 15-minute time frame.
According to the theory of Elliott waves , it seems that EURUSD has completed its 5 downward waves , and we should wait for corrective waves . I expect corrective waves to end either in a descending channel or eventually at a Resistance zone($1.0493-$1.0480) .
I expect EURUSD to attack the Support lines in the coming hours, and if the Support lines break , we should expect a decline to at least 100_SMA(4-hour) .
Note: If EURUSD breaks the Resistance line, we can expect more pumps.
Please respect each other's ideas and express them politely if you agree or disagree.
Euro/U.S.Dollar Analyze (EURUSD), 15-minute time frame.
Be sure to follow the updated ideas.
Do not forget to put Stop loss for your positions (For every position you want to open).
Please follow your strategy and updates; this is just my Idea, and I will gladly see your ideas in this post.
Please do not forget the ✅' like '✅ button 🙏😊 & Share it with your friends; thanks, and Trade safe.

Euro can reach resistance level, break it and continue to growHello traders, I want share with you my opinion about Euro. A few days ago, the price entered a wedge pattern, where it immediately rebounded from the support line into the seller's zone. It then started to decline, quickly dropping to the 1.0355 support level, which aligned with the buyer's zone. Following this, the Euro experienced a sharp gap down, breaking out of the wedge and falling below the support level. However, it soon reversed direction and began to rise, reaching the support level again and breaking through it. After that, the Euro continued moving upward within the range formed by the resistance and support lines. It first corrected to the support line before making a strong push toward the support-turned-resistance level. After breaking it and completing a retest, the price climbed further to the resistance line. From there, it briefly pulled back before making another upward move, reaching the seller's zone, which coincided with a key resistance level. The price consolidated near this level for some time before dropping to the support line. However, not long ago, it rebounded and started to rise again. In this scenario, I expect the price to continue its upward movement toward the resistance level. If it manages to break through, a retest could follow before further growth. Based on this, I have set my TP at 1.0580. Please share this idea with your friends and click Boost 🚀

Euro H4 | Potential bullish bounceThe Euro (EUR/USD) is falling towards a multi-swing-low support and could potentially bounce off this level to climb higher.
Buy entry is at 1.0456 which is a multi-swing-low support that aligns with a confluence of Fibonacci levels i.e. the 23.6% and 50.0% retracements.
Stop loss is at 1.0420 which is a level that lies underneath a pullback support.
Take profit is at 1.0521 which is a multi-swing-high resistance.
High Risk Investment Warning
Trading Forex/CFDs on margin carries a high level of risk and may not be suitable for all investors. Leverage can work against you.
Stratos Markets Limited (www.fxcm.com):
CFDs are complex instruments and come with a high risk of losing money rapidly due to leverage. 63% of retail investor accounts lose money when trading CFDs with this provider. You should consider whether you understand how CFDs work and whether you can afford to take the high risk of losing your money.
Stratos Europe Ltd (www.fxcm.com):
CFDs are complex instruments and come with a high risk of losing money rapidly due to leverage. 63% of retail investor accounts lose money when trading CFDs with this provider. You should consider whether you understand how CFDs work and whether you can afford to take the high risk of losing your money.
Stratos Trading Pty. Limited (www.fxcm.com):
Trading FX/CFDs carries significant risks. FXCM AU (AFSL 309763), please read the Financial Services Guide, Product Disclosure Statement, Target Market Determination and Terms of Business at www.fxcm.com
Stratos Global LLC (www.fxcm.com):
Losses can exceed deposits.
Please be advised that the information presented on TradingView is provided to FXCM (‘Company’, ‘we’) by a third-party provider (‘TFA Global Pte Ltd’). Please be reminded that you are solely responsible for the trading decisions on your account. There is a very high degree of risk involved in trading. Any information and/or content is intended entirely for research, educational and informational purposes only and does not constitute investment or consultation advice or investment strategy. The information is not tailored to the investment needs of any specific person and therefore does not involve a consideration of any of the investment objectives, financial situation or needs of any viewer that may receive it. Kindly also note that past performance is not a reliable indicator of future results. Actual results may differ materially from those anticipated in forward-looking or past performance statements. We assume no liability as to the accuracy or completeness of any of the information and/or content provided herein and the Company cannot be held responsible for any omission, mistake nor for any loss or damage including without limitation to any loss of profit which may arise from reliance on any information supplied by TFA Global Pte Ltd.
The speaker(s) is neither an employee, agent nor representative of FXCM and is therefore acting independently. The opinions given are their own, constitute general market commentary, and do not constitute the opinion or advice of FXCM or any form of personal or investment advice. FXCM neither endorses nor guarantees offerings of third-party speakers, nor is FXCM responsible for the content, veracity or opinions of third-party speakers, presenters or participants.

EURUSD: Sell trigger on the 4H MA50EURUSD is neutral on its 1D technical outlook (RSI = 55.966, MACD = 0.003, ADX = 17.727) as the price turned sideways in the past 2 weeks. The 4H MA50 is acting as the support of this Channel Up pattern. Even though the price hasn't yet made a technical HH, the 4H RSI is on a LH bearish divergence like the Jan 27th high. The signal to sell then came when the price closed a candle under the 4H MA50. If it happens again, the top will most likely be in, so go short and target the 0.786 Fibonacci retracement (TP = 1.02800).
See how our prior idea has worked out:
## If you like our free content follow our profile to get more daily ideas. ##
## Comments and likes are greatly appreciated. ##

EURCAD INTRADAY Uptrend breakout supported at 1.5030The EURCAD price action sentiment appears bullish, supported by the longer-term prevailing uptrend. The recent intraday price action appears to be a sideways consolidation towards the rising support trendline zone.
The key trading level is at 1.0530 level, the consolidation price range zone. A corrective pullback from the current levels and a bullish bounce back from the 1.0530 level could target the upside resistance at 1.5080 followed by the 1.5093 and 1.5122 levels over the longer timeframe.
Alternatively, a confirmed loss of the 1.5030 support and a daily close below that level would negate the bullish outlook opening the way for a further retracement and a retest of 1.5013 support level followed by 1.4974.
This communication is for informational purposes only and should not be viewed as any form of recommendation as to a particular course of action or as investment advice. It is not intended as an offer or solicitation for the purchase or sale of any financial instrument or as an official confirmation of any transaction. Opinions, estimates and assumptions expressed herein are made as of the date of this communication and are subject to change without notice. This communication has been prepared based upon information, including market prices, data and other information, believed to be reliable; however, Trade Nation does not warrant its completeness or accuracy. All market prices and market data contained in or attached to this communication are indicative and subject to change without notice.

Euro can bounce from support line of channel and continue growHello traders, I want share with you my opinion about Euro. A few days ago, the price entered a downward channel, breaking through the 1.0520 level, which aligned with the seller’s zone, and continued its decline. Shortly after, it dropped even lower but quickly rebounded, almost reaching the resistance line of the channel before falling back to the support line, breaking the 1.0285 level. Following this move, the price once again climbed to the resistance line but then swiftly dropped back before making a strong upward push, breaking the 1.0285 level and exiting the channel. After that, the Euro rallied toward the resistance level but soon pulled back into the buyer’s zone, forming a strong gap. From there, the price began moving inside an upward channel, rising to the resistance level, making a brief correction, and then climbing back to resistance. However, after this move, the Euro reversed and started to decline. Given this setup, I expect the price to reach the support line of the channel before continuing its upward movement within the channel, potentially breaking the resistance level. If this scenario plays out, I have set my TP at 1.0600 points. Please share this idea with your friends and click Boost 🚀

EUROUSD 4H LONG (Results)Due to inattentive study of the rules of the tradingviews platform, the trading idea was blocked (sorry)
I apologize to those who used this idea in their trading system due to the blocking, I will be more careful in the future.
Result: EUROUSD 4H LONG reaches the first key zone for taking profits.
I move my stop into profit and wait for new variables from the market.

EURJPY Strong oversold buy opportunity.The EURJPY pair broke again below the 0.786 Fibonacci retracement level of its Rectangle pattern and is consolidating. Every time this break-out occurred, the price was a buy opportunity.
This time, the 1D RSI is on Higher Lows, i.e. a Bullish Divergence, which makes the opportunity even stronger. We are expecting a 1D MA200 (orange trend-line) test below the Lower Highs trend-line at 162.250.
-------------------------------------------------------------------------------
** Please LIKE 👍, FOLLOW ✅, SHARE 🙌 and COMMENT ✍ if you enjoy this idea! Also share your ideas and charts in the comments section below! This is best way to keep it relevant, support us, keep the content here free and allow the idea to reach as many people as possible. **
-------------------------------------------------------------------------------
💸💸💸💸💸💸
👇 👇 👇 👇 👇 👇

EURUSD Channel Up aiming at 1.06300.EURUSD is trading inside a Channel Up on the 1hour time frame.
The two previous bullish waves both topped on a +2.27% rise.
Having made a new low on February 19th, we are now on the 3rd bullish wave.
We expect a symmetric +2.27%, based also on the identical 1hour RSI it shares with the previous 2 bullish waves.
Buy and target 1.06300 (top of Channel Up at +2.27%).
Previous chart:
Follow us, like the idea and leave a comment below!!
