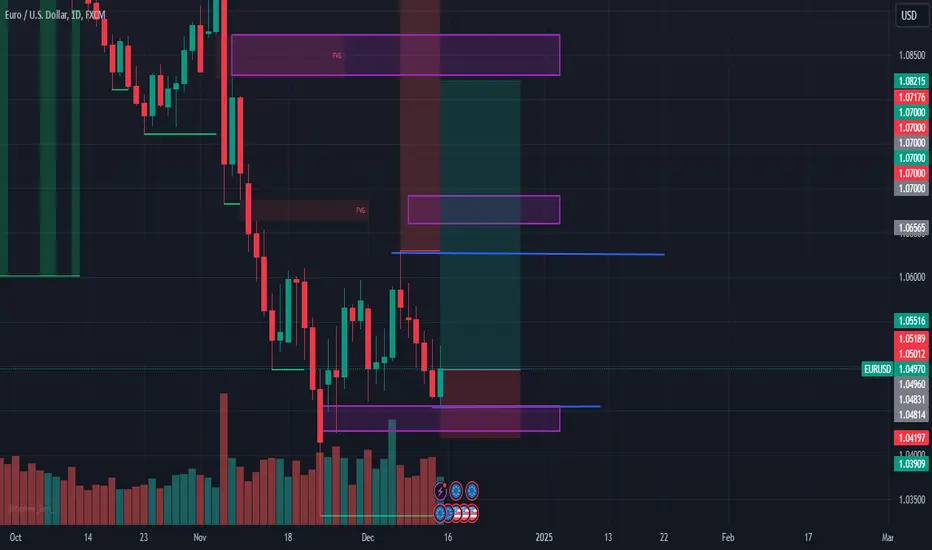
EURUSD: Best opportunity to buy for the long term.EURUSD is bearish on its 1D technical outlook (RSI = 40.973, MACD = -0.005, ADX = 14.482) but almost still oversold on 1W (RSI = 35.674). This is because after the November 18th 1W candle bottom on the LL trendline of the 2 year Channel Down, it has completed 2 red weeks in a row. Still, having rebounded on oversold 1W RSI territory, those low levels present an excellent buy opportunity for those who missed the bottom. Every bounce on the Channel Down bottom has made at least a +5.42% rally, and that is what we're aiming for (TP = 1.0900). This may coincide with a 1W MA200 test.
## If you like our free content follow our profile to get more daily ideas. ##
## Comments and likes are greatly appreciated. ##
Euro

EURUSD: Short-term trade Before Retail SalesHello Traders,
Due to longer term Bearish Trend in the pair I'm more with the Red Path, However, we have to follow the market!
Any Breaks below the channel and 1.0500, may head the price to 1.0468.
Any Breaks over the zone, could make us see the 1.0577.
We should close our trader before Retail Sales release on Tuesday.

SELL EUROEUR/USD remains in a downtrend channel on the weekly timeframe and is currently in a correction/ rejection phase before the next big down movement to the lower channel below parity levels after a weekly close confirmation below a major support area at 1.05.

EURUSD Bottom formation in progress. Strong Buy.The EURUSD pair has been trading within a nearly 2-year Channel Down. Being below the 1D MA50 (blue trend-line) since October 02 2024, this is technically still the pattern's Bearish Leg.
However, having bottomed on November 22 and transitioned into a (dotted) Channel Up, this is the technical bottom formation of the long-term Channel Down and the rise following a 1D MACD Bullish Cross from such a low level (the lowest in 2 years), confirms that.
The similarities with both previous bottom formations (September - October 2023 and February - March 2023) are obvious, all of them triple bottomed before rebounding above the 0.786 Fibonacci retracement level.
As a result, buying now and targeting 1.08765 (Fib 0.618) is an excellent long-term trade in terms of R/R.
-------------------------------------------------------------------------------
** Please LIKE 👍, FOLLOW ✅, SHARE 🙌 and COMMENT ✍ if you enjoy this idea! Also share your ideas and charts in the comments section below! This is best way to keep it relevant, support us, keep the content here free and allow the idea to reach as many people as possible. **
-------------------------------------------------------------------------------
💸💸💸💸💸💸
👇 👇 👇 👇 👇 👇

eurusd short/long +180/+180 swing trade setup🔸Hello traders, let's review the 1hour chart for EURUSD today.
We are currently stuck in 180 pips high/low range, so it's best
to focus on selling high and buying low in current market conditions.
🔸Key levels for eurusd traders: 0420 s/r bulls, 0600s/r bears,
0600 mirror s/r bears level will get re-tested by the bulls for liquidity.
🔸Recommended strategy for eurusd traders: the sequence
is short / long so you want to short high off the s/r bears at 0600 SL 40
TP 0420 pips, this is the the reversal play / re-test of the mirror s/r bulls
at 0420 then flip long at/near 0420+-20 pips SL 40 pips TP1 +90
TP2 +180 pips final exit bulls at mirror s/r at 0600. this is a swing
trade setup, patience required. good luck traders!
🎁Please hit the like button and
🎁Leave a comment to support our team!
RISK DISCLAIMER:
Trading Futures , Forex, CFDs and Stocks involves a risk of loss.
Please consider carefully if such trading is appropriate for you.
Past performance is not indicative of future results.
Always limit your leverage and use tight stop loss.

Euro H4 | Overlap resistance at 50% Fiboancci retracementThe Euro (EUR/USD) is rising towards an overlap resistance and could potentially reverse off this level to drop lower.
Sell entry is at 1.0537 which is an overlap resistance that aligns with the 50.0% Fibonacci retracement level.
Stop loss is at 1.0604 which is a level that sits above the 78.6% Fibonacci retracement level and a pullback resistance.
Take profit is at 1.0401 which is a swing-low support.
High Risk Investment Warning
Trading Forex/CFDs on margin carries a high level of risk and may not be suitable for all investors. Leverage can work against you.
Stratos Markets Limited (www.fxcm.com):
CFDs are complex instruments and come with a high risk of losing money rapidly due to leverage. 64% of retail investor accounts lose money when trading CFDs with this provider. You should consider whether you understand how CFDs work and whether you can afford to take the high risk of losing your money.
Stratos Europe Ltd (www.fxcm.com):
CFDs are complex instruments and come with a high risk of losing money rapidly due to leverage. 66% of retail investor accounts lose money when trading CFDs with this provider. You should consider whether you understand how CFDs work and whether you can afford to take the high risk of losing your money.
Stratos Trading Pty. Limited (www.fxcm.com):
Trading FX/CFDs carries significant risks. FXCM AU (AFSL 309763), please read the Financial Services Guide, Product Disclosure Statement, Target Market Determination and Terms of Business at www.fxcm.com
Stratos Global LLC (www.fxcm.com):
Losses can exceed deposits.
Please be advised that the information presented on TradingView is provided to FXCM (‘Company’, ‘we’) by a third-party provider (‘TFA Global Pte Ltd’). Please be reminded that you are solely responsible for the trading decisions on your account. There is a very high degree of risk involved in trading. Any information and/or content is intended entirely for research, educational and informational purposes only and does not constitute investment or consultation advice or investment strategy. The information is not tailored to the investment needs of any specific person and therefore does not involve a consideration of any of the investment objectives, financial situation or needs of any viewer that may receive it. Kindly also note that past performance is not a reliable indicator of future results. Actual results may differ materially from those anticipated in forward-looking or past performance statements. We assume no liability as to the accuracy or completeness of any of the information and/or content provided herein and the Company cannot be held responsible for any omission, mistake nor for any loss or damage including without limitation to any loss of profit which may arise from reliance on any information supplied by TFA Global Pte Ltd.
The speaker(s) is neither an employee, agent nor representative of FXCM and is therefore acting independently. The opinions given are their own, constitute general market commentary, and do not constitute the opinion or advice of FXCM or any form of personal or investment advice. FXCM neither endorses nor guarantees offerings of third-party speakers, nor is FXCM responsible for the content, veracity or opinions of third-party speakers, presenters or participants.

Weekly Forex Forecast: EURUSD Is Bearish. Wait For SELLS!This forecast is for the week of Dec. 16 - 20th.
EURUSD has formed a bearish breakout of the consolidation. Clearly the momentum is to the downside. WIll we see this continue into next week? Yessir!
Check the comments section below for updates regarding this analysis throughout the week.
Enjoy!
May profits be upon you.
Leave any questions or comments in the comment section.
I appreciate any feedback from my viewers!
Like and/or subscribe if you want more accurate analysis.
Thank you so much!
Disclaimer:
I do not provide personal investment advice and I am not a qualified licensed investment advisor.
All information found here, including any ideas, opinions, views, predictions, forecasts, commentaries, suggestions, expressed or implied herein, are for informational, entertainment or educational purposes only and should not be construed as personal investment advice. While the information provided is believed to be accurate, it may include errors or inaccuracies.
I will not and cannot be held liable for any actions you take as a result of anything you read here.
Conduct your own due diligence, or consult a licensed financial advisor or broker before making any and all investment decisions. Any investments, trades, speculations, or decisions made on the basis of any information found on this channel, expressed or implied herein, are committed at your own risk, financial or otherwise.

Euro can start to fall, thereby exiting from pennant patternHello traders, I want share with you my opinion about Euro. Observing the chart, we can see how the price declined inside the downward channel, where it fell to the seller zone, which coincided with the resistance level. Then price fell to this level and then rebounded and in a short time rose to 1.0935 points, exiting from the channel and making a first gap. Then Euro turned around and started to decline inside a downward pennant, where it soon broke the 1.0760 level and then tried to back up, but failed and continued to decline. In a short time, the Euro dropped to the 1.0485 level, which coincided with the buyer zone, broke it, and fell to the support line of the pennant. Then it turned around and quickly rose to the resistance line of the pennant pattern, making a second gap and breaking the 1.0485 level one more time. After this, the price turned around and fell from the resistance line to the support level, where it continues to trade very close to this day. In my mind, the Euro can rise to the resistance line of the pennant and then rebound down, thereby exiting from this pattern and breaking the support level. After this movement, I think that the price will continue to decline, so, I set my TP at 1.0350 points. Please share this idea with your friends and click Boost 🚀

EUR - LONG - Swing Trading*This is a risky trade since if it breaks support it can take us to very low levels, which is why an appropriate stop loss must be used.
We are in a support between 1.042 and 1.045 that is holding up very well until now. Now that time has passed, it seems we are close to breaking 1.05 and will remain there in the following days. It is necessary to give the trade time of around 6 to 14 days to reach the targets.
Targets:
T1: 1.059 - 1.060 (protect or take partial)
T2: 1.065 (close - 6 days)
T3: 1.080 (close - 14 days)
SELL HAS ENGAGED on EUROXThe DXY is breaking BULLISH causing EURO to SELL as I stated earlier. Stop Hunts happen. Always stay with the play!

EURCAD: Bullish Move After Breakout 🇪🇺🇨🇦
EURCAD broke and closed above a key daily/intraday horizontal resistance.
After a breakout, the price retested the broken structure
and formed a narrow horizontal range on that.
The violation of its upper boundary with a bullish imbalance
is a strong bullish signal.
Chances are high that the pair will go up and reach at least 1.4928 level soon.
❤️Please, support my work with like, thank you!❤️

EUR - Long - Re-entry2 setups.
T1: 1.0595 (4 hour) > 2.5:1
T2: 1.082 (close - daily chart). > 3.5:1
Stop at 1.047 or 1.042
EUR - Long - Re-entryNew opportunity to go long. It's a risky trade, and we need to break 1.062.
T1: 1.06 (protect trade).
T2: 1.08 (partial or close).
T3: 1.09 (close - daily chart).
EUR/USD: Market Anticipation Ahead of Key Economic ReportsAs the London trading session unfolds on Monday, the EUR/USD currency pair is hovering around the 1.0580 mark. Investors are gearing up for significant economic events this week, including the highly anticipated US Consumer Price Index (CPI) report for November, set to be released on Wednesday. In addition, the European Central Bank (ECB) will announce its interest rate decision on Thursday, making this week crucial for market participants seeking insights into future monetary policy shifts.
From a technical standpoint, the EUR/USD has shown a lack of substantial movement over the past week, remaining firmly below the 1.0600 resistance level. Traders are closely watching how the currency pair interacts with this barrier, as it could dictate the next direction for the market.
With speculation surrounding a potential interest rate cut from the Federal Reserve later this month, Wednesday's inflation figures may be the crucial factor influencing the Fed's decision. Analysts predict that the annual consumer price inflation will slightly increase to 2.7% year-over-year in November, up from 2.6% in October. Moreover, the core inflation rate, which excludes the often-volatile categories of food and energy, is anticipated to hold steady at 3.3% year-over-year.
Given the current landscape, our strategy is to remain on the sidelines as we await the CPI data on Wednesday and the Unemployment Claims report on Thursday. While our overall bias leans bearish, we believe it is prudent to refrain from taking any positions until the price potentially approaches a significant demand zone. This approach allows for a more informed entry that aligns with market developments.
In summary, the EUR/USD is at a critical juncture as investors anticipate key economic reports that could have lasting effects on the currency pair's trajectory. With the market sentiment leaning toward caution, all eyes will be on the data releases this week.
✅ Please share your thoughts about EUR/USD in the comments section below and HIT LIKE if you appreciate my analysis. Don't forget to FOLLOW ME; you will help us a lot with this small contribution.

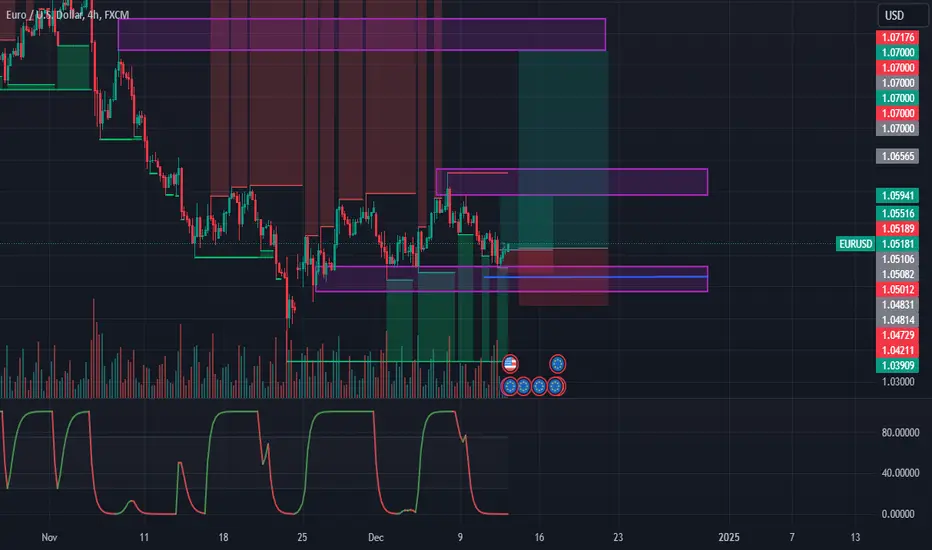
EURUSD: Standard Channel Up targeting above the 4H MA200.EURUSD may have turned bearish today on its 1D technical outlook (RSI = 41.238, MACD = -0.005, ADX = 33.591) but 4H remains neutral as the pullback is the technical bearish wave of the Channel Up you see on the chart. The two bullish waves we've had so far have been exactly the same at +1.65% with the 4H RSI S1 Zone providing the most accurate buy entries. Consequently, this is now the best level to go long and target a crossing over the 4H MA200 on another +1.65% bullish wave (TP = 1.06675).
See how our prior idea has worked out:
## If you like our free content follow our profile to get more daily ideas. ##
## Comments and likes are greatly appreciated. ##

Euro can rebound up to 1.0700 level, exiting from pennantHello traders, I want share with you my opinion about Euro. Looking at the chart, we can see how the price some days ago started to decline inside the downward pennant, where it at once rebounded from the resistance line and fell to the 1.0700 level, which coincided with the seller zone. Then EUR tried to grow, but failed and in a short time declined below the 1.0700 level, breaking it. Next, the price continued to decline and later almost reached the support level, after which turned around and some time traded a little higher at this level, but didn't fall to it. Later, the rice dropped below the 1.0485 level, which coincided with the buyer zone, breaking it and reaching the support line of the downward pennant, after which started to grow and made a gap. After this movement, the Euro broke the 1.0485 support level one more time and made a retest. Next, it little grew, after which made a correction to the support level and then rose to the resistance line of the pennant. But a not long time ago, the price fell to the support line and now it trying to grow. For this case, I think that the price can correct to the support line and then rebound up to 1.0700 resistance level, thereby exiting from the pennant pattern. Please share this idea with your friends and click Boost 🚀

+180/+360 pips GBPCAD Swing trade setup🔸Hello traders, let's review the H4 chart for GBPCAD today. Trading
near premium prices of the multiweek range, closing in on heavy S/R
Currently risk/reward is shifting in bears favor, so it's recommended
to look for sell side setups in this market.
🔸Bearish OB / fresh liquidity set at 8095/8125. Price structure
indicates potential incoming reversal once we trigger the OB.
🔸Recommended strategy for GBPCAD traders: focus on short selling any rips/rallies near OB 8095/8125 price is currently trading near premium levels and is maxed out already, limited upside. TP1 bears +180 TP2 bears +360 pips final exit 7750 keep in mind this is a swing trade setup so naturally will take more time to complete / hit both targets. good luck traders!
🎁Please hit the like button and
🎁Leave a comment to support our team!
RISK DISCLAIMER:
Trading Futures , Forex, CFDs and Stocks involves a risk of loss.
Please consider carefully if such trading is appropriate for you.
Past performance is not indicative of future results.
Always limit your leverage and use tight stop loss.

+140 pips The Best Level to BUY/HOLD EURUSD swing trade🔸Hello traders, let's review the 1hour chart for EURUSD today.
Overall, strong price chart with sequence of higher lows in progress.
🔸Clearly defined set of overhead resistances and supports below
market price with liquidity distributed equally among buy side
and sell side order blocks.
🔸Primary pattern / structure is 3 drives in progress, expecting
a final pullback to trigger OB liquidity at/near 0510/0520 before
bullish reaction and final push (3rd drive).
🔸Recommended strategy for EURUSD traders:no trade recommended
at current price, however bulls should enter BUY/HOLD at/near 0510/0520 SL 30 pips TP1 +70 TP2 +140 final exit at 0640. Bears should
wait for further updates and get ready to short from sell side order
blocks near 0640/0660 S/R zone. good luck traders!
🎁Please hit the like button and
🎁Leave a comment to support our team!
RISK DISCLAIMER:
Trading Futures , Forex, CFDs and Stocks involves a risk of loss.
Please consider carefully if such trading is appropriate for you.
Past performance is not indicative of future results.
Always limit your leverage and use tight stop loss.

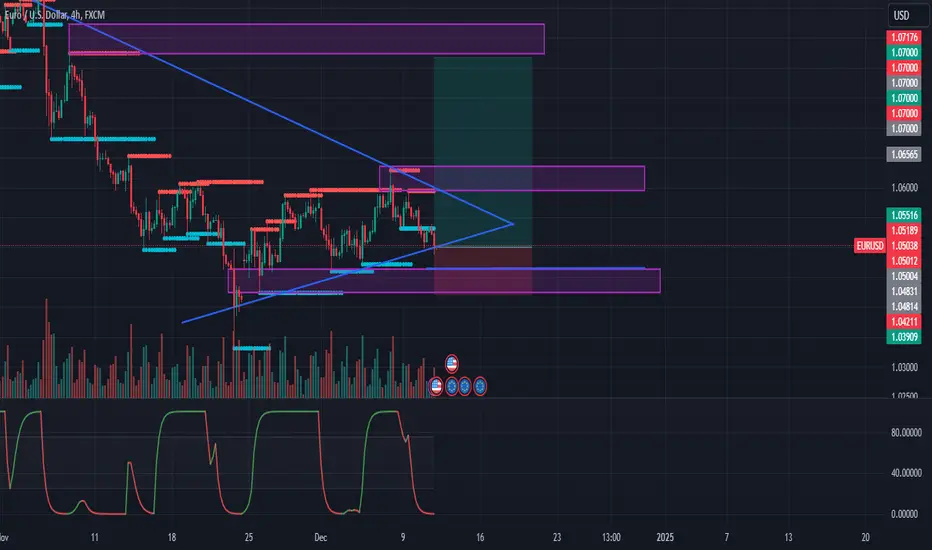
EURUSD Crucial test on the 4H MA200. Bullish if broken.The EURUSD pair has been trading within a Bearish Megaphone since the September 30 High, which is technically the Bearish Leg of the long-term Channel Down pattern, which we saw on our previous analysis.
Having found support on the 4H MA50 (blue trend-line), the pair appears to be attempting another test on the 4H MA200 (orange trend-line), which rejected the last Lower High (November 05) and has been intact since October 01, making it practically the basic long-term Resistance.
As a result, if the 4H MA200 breaks, the top (Lower Highs trend-line) of the Bearish Megaphone should follow too, which will cause a technical medium-term break-out. Our Target is the 0.618 Fibonacci retracement level at 1.08765.
You may use the Higher Lows trend-line as an additional tool to determine if the break-out will be successful as last time (November 05) the failed to hold and caused the new Bearish Low of the Megaphone. Similar analogy with the 4H RSI Higher Lows trend-line.
-------------------------------------------------------------------------------
** Please LIKE 👍, FOLLOW ✅, SHARE 🙌 and COMMENT ✍ if you enjoy this idea! Also share your ideas and charts in the comments section below! This is best way to keep it relevant, support us, keep the content here free and allow the idea to reach as many people as possible. **
-------------------------------------------------------------------------------
💸💸💸💸💸💸
👇 👇 👇 👇 👇 👇

EURUSD Start?Based on the data, it seems that the Euro will regain its strength and rise in the coming days. There is only one scenario, which is an upward movement. As for the upward move, it will either drop to the yearly low to draw liquidity and then rise, or it has already sufficed with the current level and will continue its ascent without needing additional liquidity.

EUR/USD Remains Cautious: Traders Await US Payrolls DataThe EUR/USD currency pair remains cautious as it trades below the 1.0600 level during the European session on Friday, just shy of a previous resistance zone. The US Dollar is maintaining its stability, supported by profit-taking and a subdued risk appetite among investors. Market participants are hesitant to commit to new positions ahead of the pivotal US Nonfarm Payrolls report, which includes key indicators such as Average Hourly Earnings, Non-Farm Employment Change, and the Unemployment Rate. The day's events are significant and will likely influence the direction of the DXY index as we approach the new week.
From a technical perspective, the price remains under the 1.0600 resistance level. The latest Commitment of Traders (COT) report indicates a shift in retailer positioning towards a bullish sentiment, while non-commercial traders continue to display a bearish outlook.
Currently, we are refraining from taking any positions. However, we maintain a bearish bias and anticipate a potential decline that could retest the 1.0400 zone or even extend lower.
✅ Please share your thoughts about EUR/USD in the comments section below and HIT LIKE if you appreciate my analysis. Don't forget to FOLLOW ME; you will help us a lot with this small contribution.

Fundamental Market Analysis for December 06, 2024 EURUSDEUR/USD is declining to 1.0575 at the start of the European session on Friday. Concerns over US tariffs on European goods and rising bets on interest rate cuts by the European Central Bank (ECB) are weighing on the Euro against the US Dollar. This Friday, the US Non-Farm Payrolls (NFP) data will take center stage.
The single currency remains on the defensive as traders are concerned about potential tariff policies on all goods imported into the US, which could undermine the Eurozone economy. In addition, the ECB is widely expected to cut the interest rate at its last monetary policy meeting of the year. All but two of the 75 economists surveyed believe the ECB will cut the deposit rate by 25 basis points (bps) on Dec. 12.
On Thursday, French President Emmanuel Macron said he would appoint a new prime minister in the coming days, with the top priority being parliament's passage of the 2025 budget. Any signs of political uncertainty in France could contribute to the euro's decline.
Abroad, the expectation that the Federal Reserve (Fed) will reduce borrowing costs at its December meeting could put pressure on the dollar and limit EUR/USD's decline. Markets now estimate the probability that the central bank will cut rates by a quarter point at its December 17-18 meeting at 70.1%.
Trade recommendation: Watch the level of 1.0570, when fixing below consider Sell positions, when rebounding consider Buy positions.

Euro can make retest of support line and then continue move upHello traders, I want share with you my opinion about Euro. Observing the chart, we can see how the price some days ago started to decline inside the range, where it in a short time fell to the resistance level, which coincided with the seller zone with the bottom part of the range. Next, the price turned around and quickly rose to the top part of the range, making a first gap, after which turned around and made impulse down, thereby exiting from the range and breaking the 1.0760 level. Then the price tried to back up, but it made a fake breakout of 1.0760 level and then continued to fall inside the downward pennant. Later, the Euro fell to the support level, which coincided with the buyer zone and broke it too, after which declined to support line of the pennant. Then the price made an upward impulse, thereby making a second gap, after which broke the 1.0480 level one more time and continued to move up. Some time later Euro reached the resistance line of the pennant, after which made a correction to the support level, but a not long time ago it rebounded up, thereby exiting from the pennant pattern. Now I think that the Euro can make a retest, after exiting from the pennant and then continue to move up. For this reason, I set my TP at 1.0680 points. Please share this idea with your friends and click Boost 🚀
