Euro D1 | Pullback resistance at 23.6% Fibonacci retracementThe Euro (EUR/USD) is rising towards a pullback resistance and could potentially reverse off this level to drop lower.
Sell entry is at 1.0618 which is a pullback resistance that aligns close to the 23.6% Fibonacci retracement level.
Stop loss is at 1.0680 which is a level that sits above the 38.2% Fibonacci retracement level and a pullback resistance.
Take profit is at 1.0466 which is a swing-low support.
High Risk Investment Warning
Trading Forex/CFDs on margin carries a high level of risk and may not be suitable for all investors. Leverage can work against you.
Stratos Markets Limited (www.fxcm.com):
CFDs are complex instruments and come with a high risk of losing money rapidly due to leverage. 64% of retail investor accounts lose money when trading CFDs with this provider. You should consider whether you understand how CFDs work and whether you can afford to take the high risk of losing your money.
Stratos Europe Ltd (www.fxcm.com):
CFDs are complex instruments and come with a high risk of losing money rapidly due to leverage. 66% of retail investor accounts lose money when trading CFDs with this provider. You should consider whether you understand how CFDs work and whether you can afford to take the high risk of losing your money.
Stratos Trading Pty. Limited (www.fxcm.com):
Trading FX/CFDs carries significant risks. FXCM AU (AFSL 309763), please read the Financial Services Guide, Product Disclosure Statement, Target Market Determination and Terms of Business at www.fxcm.com
Stratos Global LLC (www.fxcm.com):
Losses can exceed deposits.
Please be advised that the information presented on TradingView is provided to FXCM (‘Company’, ‘we’) by a third-party provider (‘TFA Global Pte Ltd’). Please be reminded that you are solely responsible for the trading decisions on your account. There is a very high degree of risk involved in trading. Any information and/or content is intended entirely for research, educational and informational purposes only and does not constitute investment or consultation advice or investment strategy. The information is not tailored to the investment needs of any specific person and therefore does not involve a consideration of any of the investment objectives, financial situation or needs of any viewer that may receive it. Kindly also note that past performance is not a reliable indicator of future results. Actual results may differ materially from those anticipated in forward-looking or past performance statements. We assume no liability as to the accuracy or completeness of any of the information and/or content provided herein and the Company cannot be held responsible for any omission, mistake nor for any loss or damage including without limitation to any loss of profit which may arise from reliance on any information supplied by TFA Global Pte Ltd.
The speaker(s) is neither an employee, agent nor representative of FXCM and is therefore acting independently. The opinions given are their own, constitute general market commentary, and do not constitute the opinion or advice of FXCM or any form of personal or investment advice. FXCM neither endorses nor guarantees offerings of third-party speakers, nor is FXCM responsible for the content, veracity or opinions of third-party speakers, presenters or participants.
Euro

EURUCAD TODAYEURUCAD TODAY for me is bearish.
Structure is for sell
I expect 1:1 target
More on telegram

EURJPY ShortThis currency had a bearish momentum when it touched 156 only to retract to the 0.5 fib level at 164.
If the price fails to break out of the 165 zone & a daily candle turns bearish by the end of this week, then it might continue / retract with the bearish momentum retesting the 156 level.
An analysis using a shorter time length will follow to indicate the best entry position.

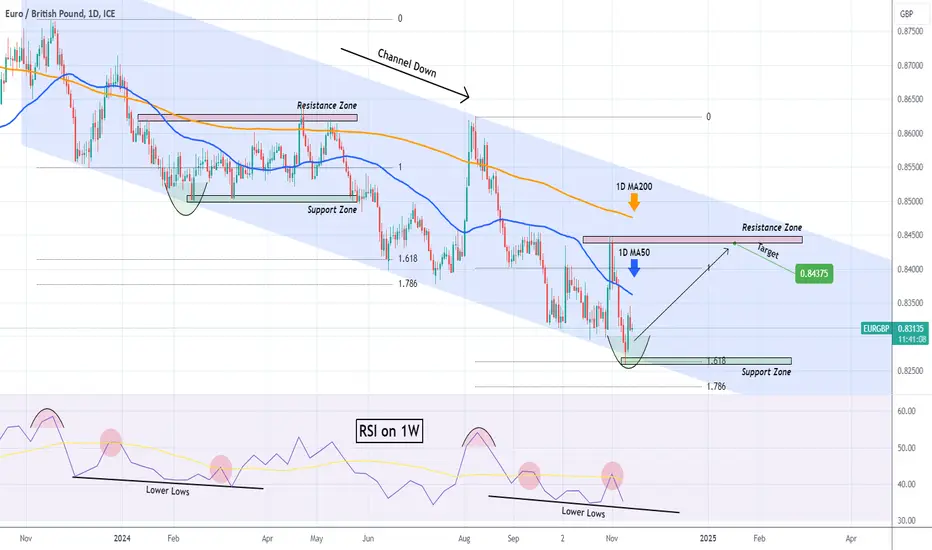
EURGBP Channel Down but short-term rebound expected.The EURGBP pair is trading within a 1-year Channel Down pattern since the November 16 2023 High. Three days ago the price made a Lower Low at the bottom of the pattern and rebounded. This was also on the 1.618 Fibonacci extension level, which based on the previous Bearish Leg, has high probabilities of sustaining a Bullish Leg.
Assuming the symmetry with January - April 2024 holds, we turn bullish now on this pair, targeting the 1D MA200 (orange trend-line) at 0.84375.
-------------------------------------------------------------------------------
** Please LIKE 👍, FOLLOW ✅, SHARE 🙌 and COMMENT ✍ if you enjoy this idea! Also share your ideas and charts in the comments section below! This is best way to keep it relevant, support us, keep the content here free and allow the idea to reach as many people as possible. **
-------------------------------------------------------------------------------
💸💸💸💸💸💸
👇 👇 👇 👇 👇 👇
EUR/USD Remains Bearish Amid Trump's Economic PoliciesThe EUR/USD currency pair has experienced a sustained bearish trend for the past five days, largely influenced by the implications of the ongoing "Trump trade." Since the elections, this trade has significantly contributed to the rally of the US Dollar (USD). The USD Index (DXY), which measures the Greenback's strength against a group of foreign currencies, has surged to its highest point since November 2023, driven by anticipations that the economic policies of President-elect Donald Trump will act as a catalyst for growth.
Additionally, Trump's proposals to increase tariffs on imports are raising concerns that inflation may rise, potentially prompting the Federal Reserve (Fed) to halt its cycle of monetary easing. Recent data from the US Consumer Price Index (CPI), released Wednesday, suggests that the nation is making sluggish progress in curtailing inflation, implying that there may be fewer interest rate cuts on the horizon for the next year. This situation supports the persistence of high US Treasury bond yields and further elevates the USD's value broadly.
According to the latest report from the US Bureau of Labor Statistics, the headline CPI recorded a rise of 0.2% in October, with a year-on-year increase of 2.6%. Notably, the core CPI, which omits the more volatile prices of food and energy, climbed 0.3% last month and saw a 3.3% increase compared to the previous year. These figures reinforce speculation that the Fed could implement a third rate cut in December, amid signs of a cooling labor market.
From a technical analysis perspective, the price has approached our identified Demand zone, where we are on the lookout for a potential rebound. However, as of now, there are no indicators suggesting an imminent price increase. Therefore, exercising patience and waiting for confirmation is essential at this stage.
✅ Please share your thoughts about EUR/USD in the comments section below and HIT LIKE if you appreciate my analysis. Don't forget to FOLLOW ME; you will help us a lot with this small contribution.

EURCAD - Support Becomes ResistanceHello Traders !
On the daily time frame, The EURCAD broke the support level.
This key level becomes a new resistance level !
So, I expect a bearish move📉
_____________
TARGET: 1.47480🎯

EUR/USD Outlook: Positive Start Amid Market Anticipation of CPI As I write this article, the EUR/USD pair is kicking off the London session on a positive note, currently trading at 1.0623. However, caution prevails as traders await the release of the US Consumer Price Index (CPI) data for October, scheduled for publication at 13:30 GMT.
The forthcoming CPI report is anticipated to reveal an uptick in annual headline inflation, expected to rise to 2.6% from September’s 2.4%. Meanwhile, the core CPI, which excludes the more volatile prices of food and energy, is projected to experience a steady increase of 3.3%.
This inflation data is set to sway market expectations regarding the Federal Reserve's (Fed) potential monetary policy actions in December. The market currently expects a 25 basis point cut in interest rates, bringing the target range down to 4.25%-4.50%, as indicated by the CME FedWatch tool. Nevertheless, the probability of this cut has decreased slightly, falling from 70% to 62% over the past week. Investors appear to be recalibrating their expectations, anticipating a more positive economic outlook for the US and heightened price pressures under the upcoming administration of President-elect Donald Trump.
From a technical perspective, the market has entered a weekly demand zone (link provided below), which might facilitate a price rebound. The Commitment of Traders (COT) report indicates that while retail investors remain bearish, institutional investors—referred to as 'smart money'—are adopting a bullish stance, albeit with a degree of caution. Our forecasts suggest a possible bullish trend extending into mid-January.
For now, we will await today’s news before considering any long positions.
✅ Please share your thoughts about EUR/USD in the comments section below and HIT LIKE if you appreciate my analysis. Don't forget to FOLLOW ME; you will help us a lot with this small contribution.

EURUSD: Showing no signs of stopping before 1.04000.EURUSD is almost oversold on its 1D technical outlook (RSI = 32.891, MACD = -0.007, ADX = 29.222), which is a sign of a potential slowdown on the October sell-off but not of stopping. We believe that as the price is approaching the bottom LL of the Channel Down, it will slow down in an attempt to form sideways a bottom as during the weeks of September 25th - October 16th 2023. The ideal entry will be with the 1W RSI as close to being oversold (30.000) as possible and symmetric 1W MACD shows it can happen by December 9th. That means that we can continue shorting the pair, targeting the 1.1 Fibonacci extension (TP = 1.04000), which is where the bottom was priced on October 2nd 2023.
## If you like our free content follow our profile to get more daily ideas. ##
## Comments and likes are greatly appreciated. ##

An idea for EUR/USDIt seems that the break of the long-term trend line of the euro was done the other day after the election of Trump as the president of the United States. In this range up to 1.06, we can expect to continue the fall. A position with R:R equal to slightly more than 1. It is not very attractive to enter, but you can think about it!

gold 5 waves complete now abc correction in progress🔸Hello guys, today let's review 6hour price chart for gold. The 5 wave
bullish impulse is complete now we are entering ABC correction.
🔸Wave1 was 2335/2472, Wave2 2472/2372, Wave3 2371/2653,
Wave4 2653/2605, Wave5 2605/2770, now ABC correction, currently
A in progress 2770/2525.
🔸Recommended strategy for gold traders: higher risk bounce play
once A completes and transitions into B bounce, BUY/HOLD 2525
exit at 2678. Lower risk sell side setup: B completes near 2678
short sell into bounce exit at 2383 once C completes into liquidity
order block zone. good luck traders!
🎁Please hit the like button and
🎁Leave a comment to support our team!
RISK DISCLAIMER:
Trading Futures , Forex, CFDs and Stocks involves a risk of loss.
Please consider carefully if such trading is appropriate for you.
Past performance is not indicative of future results.
Always limit your leverage and use tight stop loss.

EURCAD: Strong Bearish Pressure 🇪🇺🇨🇦
While USDCAD looks strongly bullish,
bears keep pushing EURCAD lower.
The price broke and closed below both a key daily horizontal support and a falling trend line - a vertical support.
It opens a potential for a bearish continuation lower at least to 1.479
❤️Please, support my work with like, thank you!❤️

EURJPY - BEARISH MOVEHello Traders !
The EURJPY price failed to create a new higher high !
At the moment, The support line is broken🔥
So, I predict a bearish move📉
________________
TARGET: 162.635🎯

EURAUD: Failed to recover the 1D MA50. Sell signal.EURAUD is bearish on its 1D technical outlook (RSI = 42.768, MACD = -0.001, ADX = 33.915) as it reversed just before reclaiming the 1D MA50. The 1D MACD is on a Bearish Cross since last Thursday and since August 5th every such formation completed a -3.63% decline. This time such a decline would reach the S2 level exactly, which is what we're aiming for (TP = 1.60115).
See how our prior idea has worked out:
## If you like our free content follow our profile to get more daily ideas. ##
## Comments and likes are greatly appreciated. ##

Euro can little grow more and then continue to decline nextHello traders, I want share with you my opinion about Euro. Looking at the chart, we can see how the price some time ago started to trades inside the wedge, where it at once broke the 1.0790 level, which coincided with the seller zone but soon backed up to this area. Then the price continued to move up and later rose to 1.0840 points, but then EUR made a correction to support line of wedge. Then price turned around and started to grow to a resistance line of a wedge pattern and even made a gap, after which it exited from the wedge and turned around. Then prices made a downward impulse inside the triangle to the resistance area, breaking the 1.0790 level. After this movement, the EUR turned around and in a short time rose to the seller zone, after which turned around and dropped back. Also recently, the price broke the 1.0680 level and now it trades very close to the support line of the triangle pattern. In my opinion, the price can make move up to the resistance area and then continue to decline, even exiting from the triangle pattern. Therefore I set my TP at 1.0600 points. Please share this idea with your friends and click Boost 🚀

EURUSD The sell-off isn't over yet.The EURUSD pair is extending the sharp sell-off after the most recent bearish signal upon the 1D MA100 (green trend-line) rejection. This is practically the same sideways Zones we talked about almost a month ago (October 14, see chart below):
The price broke below the 1-year Higher Lows trend-line that was the last 'hope' for a bullish reversal and should now extend the bearish trend even lower. The 1D MA100 rejection was also a rejection on the 0.5 Fibonacci retracement level and as you can see this is identical to the August 31 2023 rejection. That was half-way through a Channel Down (also starting from the Resistance Zone) that eventually targeted the 1.236 Fibonacci extension.
As a result, we remain bearish on this pair, targeting 1.05300 (Fib 1.236 extension), unless the 1D RSI hits 25.00 (oversold), in which case take profit regardless, as this RSI reading preceded the October 03 2023 bottom.
-------------------------------------------------------------------------------
** Please LIKE 👍, FOLLOW ✅, SHARE 🙌 and COMMENT ✍ if you enjoy this idea! Also share your ideas and charts in the comments section below! This is best way to keep it relevant, support us, keep the content here free and allow the idea to reach as many people as possible. **
-------------------------------------------------------------------------------
💸💸💸💸💸💸
👇 👇 👇 👇 👇 👇

EUR/NZD H4 | Potential bullish bounceEUR/NZD is falling towards a pullback support and could potentially bounce off this level to climb higher.
Buy entry is at 1.7858 which is a pullback support.
Stop loss is at 1.7758 which is a level that lies underneath an overlap support.
Take profit is at 1.8063 which is an overlap resistance.
High Risk Investment Warning
Trading Forex/CFDs on margin carries a high level of risk and may not be suitable for all investors. Leverage can work against you.
Stratos Markets Limited (www.fxcm.com):
CFDs are complex instruments and come with a high risk of losing money rapidly due to leverage. 64% of retail investor accounts lose money when trading CFDs with this provider. You should consider whether you understand how CFDs work and whether you can afford to take the high risk of losing your money.
Stratos Europe Ltd (www.fxcm.com):
CFDs are complex instruments and come with a high risk of losing money rapidly due to leverage. 66% of retail investor accounts lose money when trading CFDs with this provider. You should consider whether you understand how CFDs work and whether you can afford to take the high risk of losing your money.
Stratos Trading Pty. Limited (www.fxcm.com):
Trading FX/CFDs carries significant risks. FXCM AU (AFSL 309763), please read the Financial Services Guide, Product Disclosure Statement, Target Market Determination and Terms of Business at www.fxcm.com
Stratos Global LLC (www.fxcm.com):
Losses can exceed deposits.
Please be advised that the information presented on TradingView is provided to FXCM (‘Company’, ‘we’) by a third-party provider (‘TFA Global Pte Ltd’). Please be reminded that you are solely responsible for the trading decisions on your account. There is a very high degree of risk involved in trading. Any information and/or content is intended entirely for research, educational and informational purposes only and does not constitute investment or consultation advice or investment strategy. The information is not tailored to the investment needs of any specific person and therefore does not involve a consideration of any of the investment objectives, financial situation or needs of any viewer that may receive it. Kindly also note that past performance is not a reliable indicator of future results. Actual results may differ materially from those anticipated in forward-looking or past performance statements. We assume no liability as to the accuracy or completeness of any of the information and/or content provided herein and the Company cannot be held responsible for any omission, mistake nor for any loss or damage including without limitation to any loss of profit which may arise from reliance on any information supplied by TFA Global Pte Ltd.
The speaker(s) is neither an employee, agent nor representative of FXCM and is therefore acting independently. The opinions given are their own, constitute general market commentary, and do not constitute the opinion or advice of FXCM or any form of personal or investment advice. FXCM neither endorses nor guarantees offerings of third-party speakers, nor is FXCM responsible for the content, veracity or opinions of third-party speakers, presenters or participants.

EURUSD - An In-depth Analysis (ICT Concepts)In this video I provide a more in-depth analysis for EURUSD, and how I go about analyzing the chart and coming to a conclusion if any.
The concepts I used are based on ICT's Concepts along with some of my own discoveries along the way.
I hope you find it insightful.
Happy trading.
- R2F

EURUSD 10/11/24Last week’s shift in the EU bias changed our view from short to long. However, as we always say, high-impact fundamentals can move the market, sometimes in line with our bias and sometimes against it. In the case of the U.S. election, the result pushed prices lower. This happened because the USD gained significant strength when the new president was elected.
Now, we're back to our more favorable sell bias. With the recent shift lower, the higher timeframe aligns with this bias again, allowing us to target last week’s lows. We have several points to watch for a bearish shift: the supply area in the middle of our current range and the two highs at the top of the range from Friday’s 4:00 AM move. If these highs are taken, we expect price to sell off and continue down to our target lows.
There's a possibility of price moving up to the major high we’ve marked, but this is unlikely given our bearish bias. If this happens, we’ll still aim for the target low. A pullback would give us an even better position to sell into that low. As it stands, we have a relatively large fundamental range, so price may fluctuate within this range for some time.
Follow your plan and stick to your risk!

Practical Application of Order Blocks in Trading🔸In trading, especially in the context of institutional and supply-demand-based strategies, order blocks, imbalances, breakers, and entry points are all critical elements for spotting potential high-probability trade setups. Here’s a breakdown of each:
1. Order Blocks
🔸Definition: Order blocks are areas where large institutional orders (by banks, funds, etc.) are believed to have been placed, often leading to sharp price movements. These typically form after a period of consolidation, when a large entity enters the market to create momentum in a particular direction.
Types:
▪️Bullish Order Block: An area where institutions have placed buy orders, resulting in an upward price move. It’s generally identified by a down candle (in a bullish trend) before a strong upward move.
▪️Bearish Order Block: An area with concentrated sell orders, leading to a strong price decline. It’s marked by an up candle (in a bearish trend) before a sharp downward move.
▪️Use in Trading: Traders look for price to return to these areas as potential entry points, expecting the area to act as support (for bullish order blocks) or resistance (for bearish order blocks).
2. Imbalances
🔸Definition: Imbalances (also called Fair Value Gaps or FVG) occur when there is a strong price movement in one direction, leaving a "gap" in liquidity. ▪️IThis happens when there’s more demand or supply than what the current orders can fulfill, leading to a price spike.
▪️Identification: Look for consecutive candles moving in the same direction without much overlap in their wicks. This often leaves a gap between the high of one candle and the low of the next.
▪️Use in Trading: Since price often "rebalances" itself, traders may expect price to return to this area before continuing its trend, using it as a potential point for entries in the direction of the larger trend.
3. Breakers
🔸Definition: A breaker is a failed attempt at reversing a trend, usually involving a break of structure that indicates a reversal but then fails, with price moving back in the original trend's direction.
Types:
▪️Bullish Breaker: When a downtrend is invalidated, but instead of continuing downwards, price reverses back up. The previous support level that price broke and closed below may now act as a support zone.
▪️Bearish Breaker: When an uptrend is invalidated, but price moves back down, often causing previous resistance to act as resistance again.
▪️Use in Trading: Breakers are often used to identify failed reversals where traders might enter in the direction of the initial trend, as these zones tend to have strong support or resistance.
4. Bullish and Bearish Breakers in Trading
Bullish Breaker:
▪️A level created after a failed bearish structure, turning into support as the price breaks upward.
Look for confirmation of price moving above this level, with entry points often at or just above the zone.
Bearish Breaker:
▪️A level created after a failed bullish attempt, creating a resistance zone as price breaks lower.
Traders enter trades when price retests this breaker level and shows signs of rejection.
5. When to Enter Trades
▪️Order Block Entry: Look for price to return to an order block zone (after creating it), confirming it as a valid area of support or resistance. Confirmation methods include candlestick patterns or lower timeframe support/resistance creation.
▪️Imbalance Entry: Price may "fill" imbalances, and traders can look to enter as price retraces to this level with signs of rejection or confirmation. Watch for candles rejecting at the edge of the imbalance zone.
▪️Breaker Entry: Wait for price to test the breaker zone and show signs of rejection, typically with a smaller time-frame entry trigger (like a lower high or low in structure).
▪️Risk Management: When entering trades based on these points, place stops beyond the zone or recent high/low, and target areas of the next significant support/resistance or opposite liquidity pools.
6. Tips for Effective Use
🔸Multi-Timeframe Analysis: Check higher timeframe levels for stronger order blocks or breakers and use lower timeframes to refine entry.
🔸Wait for Confirmation: Often, a test of these areas with a reversal candlestick pattern (like a pin bar or engulfing candle) on a lower timeframe will provide better entries than immediately entering.
🔸Volume Confirmation: Higher volume in these areas can suggest more institutional interest and improve the chance of a successful trade.
🔸Mastering these concepts involves observing how price interacts with these levels across different market conditions, which enhances accuracy over time.

Euro can decline to support level and then continue to move upHello traders, I want share with you my opinion about Euro. By observing the chart, we can see that the price some time ago rebounded from the resistance line of the wedge and fell to the support line, which coincided with the resistance level and started to grow. In a short time, EUR rose to the resistance line and then started to decline, thereby exiting from the wedge. Price continued to decline inside the downward channel, where it broke the 1.1000 level, which coincided with the seller zone and reached the support line, but at once rebounded and made a retest. Then it continued to fall and later reached the 1.0760 support level, which coincided with the buyer zone, after which turned around and bounced to the resistance line. Euro exited from the channel and continued to grow near the resistance line. When the price reached 1.0825 points, it made a downward impulse, thereby breaking the 1.0760 level, but a not long time ago it turned around and rose back. At the moment, the Euro trades near the support level, and in my mind, the price can correct to the support level and then continue to move up. Therefore I set my TP at 1.0900 points. Please share this idea with your friends and click Boost 🚀

EURUSD strategic outlook: BEARS will target 1.0500🔸Hello guys, today let's review H8 price chart for eurusd. Previously
recommended buying low near 1.0650, TP hit +400 pips, congrats
if you followed. you can review original setup via link below.
🔸Range lows defined at 0650 , range highs set at 1050/1100.
This is the active trading range for EURUSD since early 2023 it's
well-defined and it's very unlikely that price will exit this range
any time soon (not until 2026).
🔸Currently we got a strong rejection near range highs at 1100
and this resistance is too strong for the bulls to break atm,
price was already rejected multiple times from this level.
there are no bullish catalysts in euro zone to break 1.10/1.11 S/R.
🔸Recommended strategy position traders: bears focus on short selling rips/rallies, targeting range lows at 0500/0550. Bears will take over from
here, so there is no valid setup for bulls on buy side. Keep in mind
that this is a swing trade setup and provided low volatiliy in EURUSD
it may take a while to hit the targets (multiple weeks).
🎁Please hit the like button and
🎁Leave a comment to support our team!
RISK DISCLAIMER:
Trading Futures , Forex, CFDs and Stocks involves a risk of loss.
Please consider carefully if such trading is appropriate for you.
Past performance is not indicative of future results.
Always limit your leverage and use tight stop loss.

Smart Money Market Structure Order Block Trading🔸The principles of "smart money" trading focus on understanding the behavior of institutional investors, often referred to as "smart money," to make informed trading decisions. By analyzing market structure, order blocks, supply and demand zones, and market cycles, traders aim to predict price movements and make profitable trades. Here’s a breakdown of these key concepts and how they interact:
1. Market Structure
Market structure is the fundamental flow of price movement, typically defined by highs and lows that indicate trends. The market can be seen in three primary states:
▪️Uptrend: Characterized by higher highs (HH) and higher lows (HL).
▪️Downtrend: Defined by lower highs (LH) and lower lows (LL).
▪️Consolidation (Range-bound): Prices oscillate between a support (demand) and resistance (supply) level.
▪️Understanding market structure helps traders identify when a market is trending or ranging, which is essential for timing entries and exits.
2. Order Blocks
Order blocks are areas on a price chart where large institutional traders, like banks and hedge funds, execute significant orders. These blocks often indicate strong levels of support or resistance due to the substantial buying or selling activity.
▪️Bullish Order Block: Typically found before a strong upward move. It's the last bearish (down) candle before the price rallies, signaling a demand zone.
▪️Bearish Order Block: Typically found before a strong downward move. It's the last bullish (up) candle before the price drops, indicating a supply zone.
▪️Order blocks provide clues to where "smart money" has entered the market, suggesting areas where price may return for liquidity and where retail traders may find good entry points.
3. Supply and Demand Zones
Supply and demand zones are similar to support and resistance levels but with a focus on identifying imbalances. They represent areas where supply (sellers) and demand (buyers) are significantly unbalanced:
▪️Demand Zone: A price range where buyers are strong enough to prevent further price drops. This often corresponds to an area of support.
▪️Supply Zone: A price range where sellers have historically stepped in to prevent further price increases, serving as resistance.
▪️Prices often revert to these zones due to liquidity needs, creating entry points for trend continuations or reversals.
4. Lower Highs (LH) and Higher Lows (HL)
These are essential markers in identifying trend changes:
▪️Lower Highs (LH): In a downtrend, the price fails to reach a previous high, indicating seller dominance and potential continuation of the downtrend.
▪️Higher Lows (HL): In an uptrend, the price creates higher lows, suggesting that buyers are gradually gaining strength, signaling a continuation of the uptrend.
These structural points help traders understand potential trend reversals or continuations.
5. Accumulation and Distribution Phases
These phases are critical to the Wyckoff Market Cycle:
▪️Accumulation: This phase represents a period where "smart money" accumulates positions at low prices. It typically occurs after a downtrend and is characterized by a consolidation or sideways price movement. This phase often signals a future uptrend.
▪️Distribution: This is the phase where institutional players offload positions after a significant price increase. Like accumulation, distribution appears as consolidation, often preceding a downtrend.
▪️Accumulation and distribution are often analyzed using volume patterns and price action to gauge when a trend may begin or end.
6. Market Cycles (The Wyckoff Theory)
Market cycles are a sequence of phases that price undergoes over time. According to Wyckoff’s methodology, there are four phases:
▪️Accumulation: Institutions build positions, often at a market bottom.
▪️Markup: After accumulation, the price starts to increase as demand outstrips supply.
▪️Distribution: Institutions sell off their positions, often at the top of the cycle.
▪️Markdown: Price declines as supply overwhelms demand, leading to a downtrend.
▪️Understanding these phases allows traders to anticipate potential turning points, which is critical in smart money trading.
Applying These Principles in Trading
The smart money trading approach uses these principles collectively:
🔸Identify Market Structure: Determine whether the market is trending or ranging, then identify order blocks, supply and demand zones, and significant highs and lows.
🔸Recognize Key Levels: Watch for accumulation and distribution phases at these levels, helping to anticipate likely future movements.
🔸Confirm with Volume: Use volume analysis to confirm accumulation or distribution activity.
🔸Set Entries and Exits at Smart Money Zones: Utilize identified order blocks and supply/demand zones to enter trades with the trend (markup or markdown) or exit before a reversal.
🔸By combining these elements, traders seek to align with the strategies of institutional investors, capturing trends early and minimizing exposure during less favorable periods.

EURUSD giving a buy signal on amazing symmetry.EURUSD is under heavy selling pressure since the elections result.
Still, today's 1day candle is the 3rd in a row that doesn't cross Support A.
As you can see the pair displays an uncanny symmetry, having respected all symmetrical Resistance and Support levels since the Double Top of September 25th.
This is a buy signal that is aiming at 1.09000 (June 4th High).
Previous chart:
Follow us, like the idea and leave a comment below!!
