Euro can rebound up from buyer zone to 1.1190 pointsHello traders, I want share with you my opinion about Looking at the chart, we can see how the price hit the support level, broke through it, but then quickly turned around and dropped to the lower part of the range. After that, the EUR reversed and bounced back up to the 1.0960 level, broke it again, exiting the range, and then climbed to the resistance line. The price then reversed and made a correction move to the support line, after which it started to rise near this line to the current support level. When the Euro reached this level, it broke through and kept rising until it hit the resistance line, but not long ago it turned around and made a correction move to the buyer zone. Right now, the price is trading near this zone, and I think the EUR might drop to the buyer zone before rebounding up. So, that's why I set my TP at 1.1190 points. Please share this idea with your friends and click Boost 🚀
Euro

Could demand for the dollar pick up once more today?The dollar saw strong bids overnight as robust macroeconomic data (unemployment claims and Composite PMI) functioned as bullish catalysts.
With Federal Reserve Chairman Jerome Powell kicking things off at the Jackson Hole Symposium later today, could we see another round of higher demand for the greenback and thus a further a decline in EUR/USD?
High Risk Investment Warning
Trading Forex/CFDs on margin carries a high level of risk and may not be suitable for all investors. Leverage can work against you.
Stratos Markets Limited (www.fxcm.com):
CFDs are complex instruments and come with a high risk of losing money rapidly due to leverage. 68% of retail investor accounts lose money when trading CFDs with this provider. You should consider whether you understand how CFDs work and whether you can afford to take the high risk of losing your money.
Stratos Europe Ltd, previously FXCM EU Ltd (www.fxcm.com):
CFDs are complex instruments and come with a high risk of losing money rapidly due to leverage. 73% of retail investor accounts lose money when trading CFDs with this provider. You should consider whether you understand how CFDs work and whether you can afford to take the high risk of losing your money.
Stratos Trading Pty. Limited (www.fxcm.com):
Trading FX/CFDs carries significant risks. FXCM AU (AFSL 309763), please read the Financial Services Guide, Product Disclosure Statement, Target Market Determination and Terms of Business at www.fxcm.com
Stratos Global LLC (www.fxcm.com):
Losses can exceed deposits.
Please be advised that the information presented on TradingView is provided to FXCM (‘Company’, ‘we’) by a third-party provider (‘TFA Global Pte Ltd’). Please be reminded that you are solely responsible for the trading decisions on your account. There is a very high degree of risk involved in trading. Any information and/or content is intended entirely for research, educational and informational purposes only and does not constitute investment or consultation advice or investment strategy. The information is not tailored to the investment needs of any specific person and therefore does not involve a consideration of any of the investment objectives, financial situation or needs of any viewer that may receive it. Kindly also note that past performance is not a reliable indicator of future results. Actual results may differ materially from those anticipated in forward-looking or past performance statements. We assume no liability as to the accuracy or completeness of any of the information and/or content provided herein and the Company cannot be held responsible for any omission, mistake nor for any loss or damage including without limitation to any loss of profit which may arise from reliance on any information supplied by TFA Global Pte Ltd.
The speaker(s) is neither an employee, agent nor representative of FXCM and is therefore acting independently. The opinions given are their own, constitute general market commentary, and do not constitute the opinion or advice of FXCM or any form of personal or investment advice. FXCM neither endorses nor guarantees offerings of third-party speakers, nor is FXCM responsible for the content, veracity or opinions of third-party speakers, presenters or participants.

EUR/USD Soars to 2024 Highs as Fed Rate Cut Speculation GrowsThe EUR/USD pair extended its rally for the fourth consecutive day, reaching new 2024 highs around 1.1170. This surge has been fueled by continued weakness in the US Dollar (USD), which has been under pressure as market sentiment shifts.
The US Dollar Index (DXY), a measure of the USD’s strength against a basket of major currencies, fell below the critical 101.00 level for the first time since December 2023. This decline was exacerbated by the release of the Federal Open Market Committee (FOMC) Minutes, which hinted at the possibility of an interest rate cut by the Federal Reserve (Fed) in September.
From a technical perspective, the EUR/USD pair bypassed its first supply area without a significant rebound and is now approaching the second supply zone, a key area where a potential sell reversal is being closely monitored. The latest Commitment of Traders (COT) report reveals an interesting divergence: retail traders remain bullish on the pair, while commercial traders and large funds appear to be positioning themselves for a move in the opposite direction.
The likelihood of a rate cut has been a focal point for traders. The CME Group’s FedWatch Tool currently shows nearly a 60% chance of a 25 basis point reduction at the Fed's September 18 meeting, a slight decrease from around 70% the previous day. Despite the FOMC Minutes supporting the possibility of lower rates as early as next month, Fed Governor Michelle Bowman urged caution, suggesting that rate reductions should be gradual if inflation aligns with the Fed’s 2% target. Her comments indicate a desire to avoid an overly restrictive monetary policy that could stifle economic growth.
Should the Fed opt for more substantial rate cuts, the policy gap between the Fed and the European Central Bank (ECB) could narrow in the medium to long term. This convergence may further support the EUR/USD pair, particularly as market participants expect the ECB to implement two additional rate cuts this year. Such a scenario could provide additional upward momentum for the EUR/USD, pushing it even higher in the coming months.

EUR/USDEUR/USD is bearish on a longterm and is in a downtrend channel on the weekly timeframe. It is heading back to the upper channel at 1.15 before the next down movement.

EURUSD - NEW BREAKOUT Hello Traders !
On the daily time frame, The EURUSD broke the resistance level (1.10173 - 1.09813).
This key level becomes a new support level !
So, I expect a bullish move 📈
______________
TARGET: 1.11035🎯

EURUSD Excellent long-term reward if you sell here.The EURUSD pair has broken above its 1W MA200 (orange trend-line) for the first time in more than 1 year (since the week of July 17 2023). With this move it entered the (red) Resistance Zone of the practically Rectangle pattern that it has been trading in for more than 1.5 years.
Technically, the above conditions offer a great opportunity to sell for the long-term as during this time, the pair has been rejected here two times and once on the absolute Resistance 2 level (1.12750).
As a result we will use two short positions on EURUSD, aiming to close them on profit at the end of the year. All prior rejections hit at least the 0.786 Fibonacci retracement level, so our Target will be slightly above it at 1.06650. From all angles, this opportunity offers solid Risk/ Reward conditions.
-------------------------------------------------------------------------------
** Please LIKE 👍, FOLLOW ✅, SHARE 🙌 and COMMENT ✍ if you enjoy this idea! Also share your ideas and charts in the comments section below! This is best way to keep it relevant, support us, keep the content here free and allow the idea to reach as many people as possible. **
-------------------------------------------------------------------------------
💸💸💸💸💸💸
👇 👇 👇 👇 👇 👇

EUR/USD: Key Supply Zones to Watch for Potential ReversalsThe EUR/USD pair has extended its upward momentum, reaching new highs for 2024, currently hovering around 1.1077 as I write this. This surge is largely attributed to the persistent weakness in the US Dollar (USD), which has been on the back foot in recent sessions.
Expectations around the upcoming Consumer Price Index (CPI) release have shifted market sentiment. While there was initial speculation of a half-point rate cut by the Federal Reserve next month, the chances of such a significant cut have diminished. Instead, a more modest rate reduction now seems more likely, especially in light of better-than-anticipated outcomes from other critical US economic indicators.
Looking forward, the release of the Federal Open Market Committee (FOMC) Minutes is anticipated to be the key event this week. However, market participants will also keep a close eye on Fed Chair Jerome Powell’s speech at the Jackson Hole Symposium and the testimony of Bank of Japan (BoJ) Governor Kazuo Ueda before Parliament. These events could offer further insights into the future direction of monetary policies, influencing the USD and, by extension, the EUR/USD pair.
From a technical perspective, the EUR/USD has approached a critical Supply area, where we observe a significant concentration of retail traders maintaining long positions, while commercial players have reduced their exposure. Given the current sideways market conditions, this Supply zone could be pivotal. A reversal may occur here, leading to a potential decline in the pair. However, if the price does not reverse at this level, the next key Supply area to watch would be around 1.1175. This level could become the next focal point for traders looking to identify potential turning points in the market.
✅ Please share your thoughts about EURUSD in the comments section below and HIT LIKE if you appreciate my analysis. Don't forget to FOLLOW ME; you will help us a lot with this small contribution.

EUR/CHF H1 | Bullish bounce off overlap support?EUR/CHF is falling towards an overlap support and could potentially bounce off this level to climb higher.
Buy entry is at 0.9518 which is an overlap support.
Stop loss is at 0.9477 which is a level that lies underneath an overlap support and the 23.6% Fibonacci retracement level.
Take profit is at 0.9581 which is a pullback resistance.
High Risk Investment Warning
Trading Forex/CFDs on margin carries a high level of risk and may not be suitable for all investors. Leverage can work against you.
Stratos Markets Limited (www.fxcm.com):
CFDs are complex instruments and come with a high risk of losing money rapidly due to leverage. 68% of retail investor accounts lose money when trading CFDs with this provider. You should consider whether you understand how CFDs work and whether you can afford to take the high risk of losing your money.
Stratos Europe Ltd, previously FXCM EU Ltd (www.fxcm.com):
CFDs are complex instruments and come with a high risk of losing money rapidly due to leverage. 73% of retail investor accounts lose money when trading CFDs with this provider. You should consider whether you understand how CFDs work and whether you can afford to take the high risk of losing your money.
Stratos Trading Pty. Limited (www.fxcm.com):
Trading FX/CFDs carries significant risks. FXCM AU (AFSL 309763), please read the Financial Services Guide, Product Disclosure Statement, Target Market Determination and Terms of Business at www.fxcm.com
Stratos Global LLC (www.fxcm.com):
Losses can exceed deposits.
Please be advised that the information presented on TradingView is provided to FXCM (‘Company’, ‘we’) by a third-party provider (‘TFA Global Pte Ltd’). Please be reminded that you are solely responsible for the trading decisions on your account. There is a very high degree of risk involved in trading. Any information and/or content is intended entirely for research, educational and informational purposes only and does not constitute investment or consultation advice or investment strategy. The information is not tailored to the investment needs of any specific person and therefore does not involve a consideration of any of the investment objectives, financial situation or needs of any viewer that may receive it. Kindly also note that past performance is not a reliable indicator of future results. Actual results may differ materially from those anticipated in forward-looking or past performance statements. We assume no liability as to the accuracy or completeness of any of the information and/or content provided herein and the Company cannot be held responsible for any omission, mistake nor for any loss or damage including without limitation to any loss of profit which may arise from reliance on any information supplied by TFA Global Pte Ltd.
The speaker(s) is neither an employee, agent nor representative of FXCM and is therefore acting independently. The opinions given are their own, constitute general market commentary, and do not constitute the opinion or advice of FXCM or any form of personal or investment advice. FXCM neither endorses nor guarantees offerings of third-party speakers, nor is FXCM responsible for the content, veracity or opinions of third-party speakers, presenters or participants.

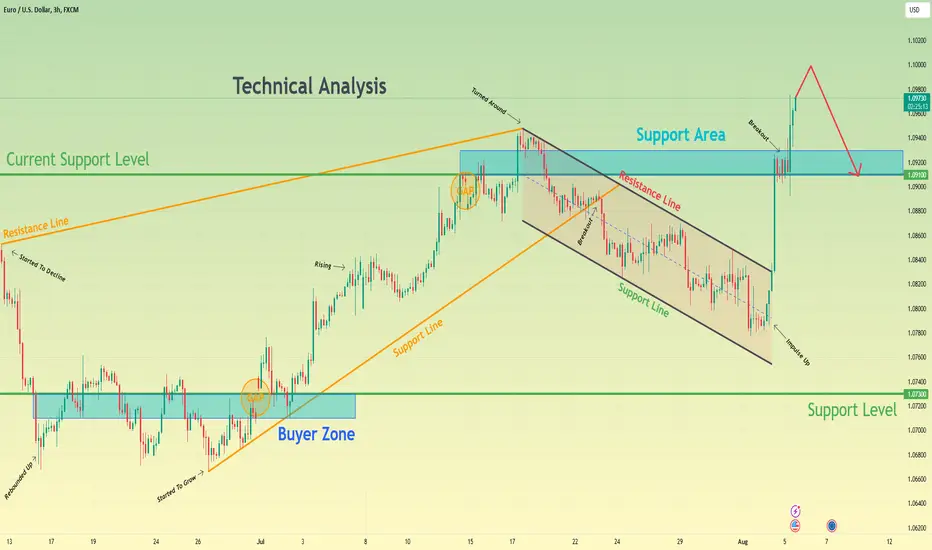
Euro will break support level and continue to declineHello traders, I want share with you my opinion about Euro. Looking at the chart, we can see how the price a not long time ago declined a little and then made a strong impulse up, thereby breaking the support level, which coincided with the support zone. Also, the price started to grow inside the upward channel, where it later reached the resistance line and then made a correction movement to the support line, and at once rebounded up, making a fake breakout of 1.0910 level. Later Euro rose to the current support level, which coincided with the seller zone, and even entered to this area, but soon turned around and fell below, making a fake breakout of 1.1020 level. But soon, the price started to grow and in a short time rose back to the seller zone, breaking this level one more time. Also recently, the price rose higher than the seller zone, but I think that it can rise to the resistance line of the channel and then start to decline. When the price reaches the support level, it can break it and continue to decline inside the downward channel, so, that's why I set my TP at 1.0960 points. Please share this idea with your friends and click Boost 🚀

Euro can break resistance level and continue to move upHello traders, I want share with you my opinion about Euro. Observing the chart, we can see that the price some days ago bounced from the support level, which coincided with the support area and support line to the resistance line, forming a gap also. After this, EUR turned around and started to decline to the support line, and some time later it reached this line, breaking the 1.0865 support level. Next, EUR fell lower the support line and entered to upward pennant, where it at once made a strong impulse up to the resistance level, breaking the resistance line and 1.0865 level one more time. After this movement, the Euro turned around from the 1.1000 level and made the correction, after which it started to grow and later reached the support line of the pennant. Then price bounced up to the resistance line, thereby rising higher than the resistance level with the seller zone, but a not long time ago it dropped back to the support line, making a fake breakout of 1.1000 level. But recently price rebounded and started to grow, so, in my mind, the Euro can fall to the support line and then rebound up to the resistance line of the pennant, breaking the resistance level. For this reason, I set my TP at 1.1055 points, which coincided with the resistance line. Please share this idea with your friends and click Boost 🚀

EUR/USD Approaches Key Supply Area Amid U.S. CPI DataThe EUR/USD is nearing a significant supply area around 1.10500, with the pair currently showing signs of being overbought. The latest Commitments of Traders (COT) report highlights that retail traders are largely bullish on the pair, adding to the potential for a correction. The focus now shifts to the upcoming release of the Consumer Price Index (CPI) data for July by the U.S. Bureau of Labor Statistics, which is likely to play a crucial role in determining the pair's next move.
Market expectations suggest that on a yearly basis, the CPI will rise by 2.9%, slightly down from the 3% recorded in June. The core CPI, which excludes the most volatile items, is anticipated to increase by 3.2% annually. On a monthly basis, both the headline CPI and core CPI are expected to rise by 0.2%.
Should the monthly core CPI, a key indicator that removes base effects and volatile prices, exceed expectations, it could trigger an immediate recovery in the U.S. Dollar (USD). This would likely weigh on the EUR/USD, leading to a potential downward movement from the supply zone around 1.10500. Conversely, if the core CPI underperforms, failing to meet market estimates, the pair might push higher, potentially breaching the initial supply area.
If EUR/USD manages to surpass the 1.10500 level, the next significant resistance lies around 1.12000. This area could act as another barrier for the Euro, where a rebound might occur. However, the current analysis suggests that a reversal at the first supply area is more probable, especially if the USD regains strength following the CPI data release.
In conclusion, the upcoming CPI figures will be pivotal in shaping the EUR/USD's trajectory. Traders should closely monitor the data, as it could either reinforce the overbought conditions and lead to a correction, or propel the pair higher if the USD weakens further.
✅ Please share your thoughts about EUR/USD in the comments section below and HIT LIKE if you appreciate my analysis. Don't forget to FOLLOW ME; you will help us a lot with this small contribution.

EUR/AUD H4 | Potential bullish bounceEUR/AUD is falling towards a pullback support and could potentially bounce off this level to climb higher.
Buy entry is at 1.6535 which is a pullback support.
Stop loss is at 1.6454 which is a level that lies underneath an overlap support and the 61.8% Fibonacci retracement level.
Take profit is at 1.6709 which is a pullback resistance.
High Risk Investment Warning
Trading Forex/CFDs on margin carries a high level of risk and may not be suitable for all investors. Leverage can work against you.
Stratos Markets Limited (www.fxcm.com):
CFDs are complex instruments and come with a high risk of losing money rapidly due to leverage. 68% of retail investor accounts lose money when trading CFDs with this provider. You should consider whether you understand how CFDs work and whether you can afford to take the high risk of losing your money.
Stratos Europe Ltd, previously FXCM EU Ltd (www.fxcm.com):
CFDs are complex instruments and come with a high risk of losing money rapidly due to leverage. 73% of retail investor accounts lose money when trading CFDs with this provider. You should consider whether you understand how CFDs work and whether you can afford to take the high risk of losing your money.
Stratos Trading Pty. Limited (www.fxcm.com):
Trading FX/CFDs carries significant risks. FXCM AU (AFSL 309763), please read the Financial Services Guide, Product Disclosure Statement, Target Market Determination and Terms of Business at www.fxcm.com
Stratos Global LLC (www.fxcm.com):
Losses can exceed deposits.
Please be advised that the information presented on TradingView is provided to FXCM (‘Company’, ‘we’) by a third-party provider (‘TFA Global Pte Ltd’). Please be reminded that you are solely responsible for the trading decisions on your account. There is a very high degree of risk involved in trading. Any information and/or content is intended entirely for research, educational and informational purposes only and does not constitute investment or consultation advice or investment strategy. The information is not tailored to the investment needs of any specific person and therefore does not involve a consideration of any of the investment objectives, financial situation or needs of any viewer that may receive it. Kindly also note that past performance is not a reliable indicator of future results. Actual results may differ materially from those anticipated in forward-looking or past performance statements. We assume no liability as to the accuracy or completeness of any of the information and/or content provided herein and the Company cannot be held responsible for any omission, mistake nor for any loss or damage including without limitation to any loss of profit which may arise from reliance on any information supplied by TFA Global Pte Ltd.
The speaker(s) is neither an employee, agent nor representative of FXCM and is therefore acting independently. The opinions given are their own, constitute general market commentary, and do not constitute the opinion or advice of FXCM or any form of personal or investment advice. FXCM neither endorses nor guarantees offerings of third-party speakers, nor is FXCM responsible for the content, veracity or opinions of third-party speakers, presenters or participants.

EURAUD - Bullish Triple Bottom Hello Traders !
The EURAUD formed a triple top pattern pattern.
Currently, The neckline is broken !
The resistance line was also broken !
So, I expect a bullish move🚀
____________
TARGET: 1.68490🎯

EURUSD Analysis==>>Signs of a FallEURUSD is moving near the Resistance zone($1.0955-$1.0933) .
According to Elliott's wave theory , EURUSD seems to be completing the Double Three Correction(WXY) .
Also, the Ascending Broadening Wedge Pattern can be a sign of EURUSD reversal.
I expect EURUSD to continue to decline, at least in the Support zone($1.0884-$1.0864) .
This week, the US economic calendar will be very busy releasing inflation Indices that will likely influence the Federal Reserve's monetary policy . We must wait for the prices to react when the indices are published.
Euro/U.S.Dollar Analyze ( EURUSD), 1-hour Time frame ⏰.
Do not forget to put Stop loss for your positions (For every position you want to open).
Please follow your strategy; this is just my idea, and I will gladly see your ideas in this post.
Please do not forget the ✅' like '✅ button 🙏😊 & Share it with your friends; thanks, and Trade safe.

EURUSD Aggressive selling about to start.Just last week (August 05, see chart below), we stressed on the importance of the 1W candle closing following the break above the 13-month Lower Highs trend-line (top) of the Triangle pattern:
The week eventually closed in losses (red 1W candle) and below the Lower Highs, which gave a bearish signal upon a technical rejection. This is a Double Higher High rejection similar to June 04, which initiated the previous Bearish Leg towards the Channel's bottom (Higher Lows).
As a result, we believe that it is still early to make a sell entry and target 1.07500.
-------------------------------------------------------------------------------
** Please LIKE 👍, FOLLOW ✅, SHARE 🙌 and COMMENT ✍ if you enjoy this idea! Also share your ideas and charts in the comments section below! This is best way to keep it relevant, support us, keep the content here free and allow the idea to reach as many people as possible. **
-------------------------------------------------------------------------------
💸💸💸💸💸💸
👇 👇 👇 👇 👇 👇

EUR/AUD H4 | Potential bearish breakoutEUR/AUD is falling towards a potential breakout level and could drop through this level to fall lower.
Sell entry is at 1.6543 which is a potential breakout level.
Stop loss is at 1.6638 which is a level that sits above an overlap resistance.
Take profit is at 1.6393 which is a pullback support.
High Risk Investment Warning
Trading Forex/CFDs on margin carries a high level of risk and may not be suitable for all investors. Leverage can work against you.
Stratos Markets Limited (www.fxcm.com):
CFDs are complex instruments and come with a high risk of losing money rapidly due to leverage. 68% of retail investor accounts lose money when trading CFDs with this provider. You should consider whether you understand how CFDs work and whether you can afford to take the high risk of losing your money.
Stratos Europe Ltd, previously FXCM EU Ltd (www.fxcm.com):
CFDs are complex instruments and come with a high risk of losing money rapidly due to leverage. 73% of retail investor accounts lose money when trading CFDs with this provider. You should consider whether you understand how CFDs work and whether you can afford to take the high risk of losing your money.
Stratos Trading Pty. Limited (www.fxcm.com):
Trading FX/CFDs carries significant risks. FXCM AU (AFSL 309763), please read the Financial Services Guide, Product Disclosure Statement, Target Market Determination and Terms of Business at www.fxcm.com
Stratos Global LLC (www.fxcm.com):
Losses can exceed deposits.
Please be advised that the information presented on TradingView is provided to FXCM (‘Company’, ‘we’) by a third-party provider (‘TFA Global Pte Ltd’). Please be reminded that you are solely responsible for the trading decisions on your account. There is a very high degree of risk involved in trading. Any information and/or content is intended entirely for research, educational and informational purposes only and does not constitute investment or consultation advice or investment strategy. The information is not tailored to the investment needs of any specific person and therefore does not involve a consideration of any of the investment objectives, financial situation or needs of any viewer that may receive it. Kindly also note that past performance is not a reliable indicator of future results. Actual results may differ materially from those anticipated in forward-looking or past performance statements. We assume no liability as to the accuracy or completeness of any of the information and/or content provided herein and the Company cannot be held responsible for any omission, mistake nor for any loss or damage including without limitation to any loss of profit which may arise from reliance on any information supplied by TFA Global Pte Ltd.
The speaker(s) is neither an employee, agent nor representative of FXCM and is therefore acting independently. The opinions given are their own, constitute general market commentary, and do not constitute the opinion or advice of FXCM or any form of personal or investment advice. FXCM neither endorses nor guarantees offerings of third-party speakers, nor is FXCM responsible for the content, veracity or opinions of third-party speakers, presenters or participants.

Euro can start to decline and exit from wedge patternHello traders, I want share with you my opinion about Euro. Observing the chart, we can see that the price a few moments ago entered to upward channel, where it at once reached the resistance line and then rebounded down to the support line of the channel. Then price rebounded up and in a short time rose to the support level, which coincided with the support area, making the first gap and soon breaking this level. Next, the price quickly rose to the resistance line of the channel, forming a second gap, after which reached the resistance level, which coincided with the seller zone and turned around. Euro exited from the upward channel and started to trades inside the wedge, where it at once declined to support line of this pattern. After this movement, the EUR turned around and made an upward impulse to the resistance line, breaking the 1.0935 resistance level, which coincided with the seller zone. But a not long time ago it turned around and fell back to the support line, where continues to trades near. In my mind, EUR can make small movement up, higher than the resistance level, and then drop, breaking this level and exiting from the wedge. For this case, I set my TP at 1.0840 points. Please share this idea with your friends and click Boost 🚀

Euro can leave pennant and continue to decline nextHello traders, I want share with you my opinion about Euro. Looking at the chart, we can see how the price some time ago started to trades inside range and at once reached the top part, after which started to decline. The price quickly fell to the 1.0815 support level, which coincided with the buyer zone, and some time traded between this level. After this, the Euro dropped lower 1.0815 level, breaking it, and also exited from the range, after which the price entered to upward pennant. In this pattern, EUR at once made a strong upward impulse from the support line to the resistance level, breaking the 1.0815 support level one more time. Next, the price broke the 1.0930 level, which coincided with the seller zone, and rose until to resistance line of the pennant, after which turned around and in a short time declined lower than the 1.0930 level, breaking it again. After this, the EUR tried to rise back, but when it entered to seller zone, it made a correction movement to support line of the pennant pattern. But a few moments ago it rebounded from this line and at the moment EUR trades near the resistance line. So, I think that the price can fall to the support line, after which bounces up to the resistance line and then continues to decline, exiting from the upward pennant as well. Therefore I set my TP at 1.0850 points. Please share this idea with your friends and click Boost 🚀

Euro H4 | Potential bearish reversalThe Euro (EUR/USD) is rising towards a pullback resistance and could potentially reverse off this level to drop lower.
Sell entry is at 1.0990 which is a pullback resistance.
Stop loss is at 1.1024 which is a level that sits above a pullback resistance.
Take profit is at 1.0905 which is a pullback support that aligns close to the 50.0% Fibonacci retracement level.
High Risk Investment Warning
Trading Forex/CFDs on margin carries a high level of risk and may not be suitable for all investors. Leverage can work against you.
Stratos Markets Limited (www.fxcm.com):
CFDs are complex instruments and come with a high risk of losing money rapidly due to leverage. 68% of retail investor accounts lose money when trading CFDs with this provider. You should consider whether you understand how CFDs work and whether you can afford to take the high risk of losing your money.
Stratos Europe Ltd, previously FXCM EU Ltd (www.fxcm.com):
CFDs are complex instruments and come with a high risk of losing money rapidly due to leverage. 73% of retail investor accounts lose money when trading CFDs with this provider. You should consider whether you understand how CFDs work and whether you can afford to take the high risk of losing your money.
Stratos Trading Pty. Limited (www.fxcm.com):
Trading FX/CFDs carries significant risks. FXCM AU (AFSL 309763), please read the Financial Services Guide, Product Disclosure Statement, Target Market Determination and Terms of Business at www.fxcm.com
Stratos Global LLC (www.fxcm.com):
Losses can exceed deposits.
Please be advised that the information presented on TradingView is provided to FXCM (‘Company’, ‘we’) by a third-party provider (‘TFA Global Pte Ltd’). Please be reminded that you are solely responsible for the trading decisions on your account. There is a very high degree of risk involved in trading. Any information and/or content is intended entirely for research, educational and informational purposes only and does not constitute investment or consultation advice or investment strategy. The information is not tailored to the investment needs of any specific person and therefore does not involve a consideration of any of the investment objectives, financial situation or needs of any viewer that may receive it. Kindly also note that past performance is not a reliable indicator of future results. Actual results may differ materially from those anticipated in forward-looking or past performance statements. We assume no liability as to the accuracy or completeness of any of the information and/or content provided herein and the Company cannot be held responsible for any omission, mistake nor for any loss or damage including without limitation to any loss of profit which may arise from reliance on any information supplied by TFA Global Pte Ltd.
The speaker(s) is neither an employee, agent nor representative of FXCM and is therefore acting independently. The opinions given are their own, constitute general market commentary, and do not constitute the opinion or advice of FXCM or any form of personal or investment advice. FXCM neither endorses nor guarantees offerings of third-party speakers, nor is FXCM responsible for the content, veracity or opinions of third-party speakers, presenters or participants.

EURO at an interesting levelThe euro is deciding its next big move, while some upside could be likely if it breaks above the 1.0925 price level, it would be interesting if the EURUSD breaks below the 1.0890 price level
This would complete the head and shoulder pattern, breaking the neckline which coincides with the 50% Fibonacci retracement level

After strong impulse up, Euro can make correction to 1.0910Hello traders, I want share with you my opinion about Euro. Observing the chart, we can see that the price rebounded down from the resistance line from the wedge and dropped a lower 1.0730 support level, which coincided with the buyer zone. Then price some time traded between the support level and later reached the support line of the wedge and started to grow. Next, the price broke the 1.0730 level and made the first gap, and then continued to rise to the 1.0910 level, which coincided with the support area. When it reached this level, it formed a second gap and even broke the 1.0910 level, after which reached the resistance line of the wedge. But then turned around and started to decline inside from a downward channel. In the channel, the price broke the 1.0910 level again and exited from the wedge also, after which it declined to 1.0780. After this EUR made a strong upward impulse, thereby exiting from the channel and also breaking the 1.0910 level. As well recently, the price bounced from the support area, and at the moment, I think that the EURO can make a movement up and then make a correction to the support level. That's why my TP is a 1.0910 level. Please share this idea with your friends and click Boost 🚀
EURUSD Will the bearish or the bullish pattern prevail?The EURUSD pair broke today above the top (Lower Highs trend-line) of the Triangle pattern that started on the July 17 2023 high. The more shorter term pattern has been a Channel Up (blue) since the April 15 2024 Low and today's break-out, has tested its top.
Those are two conflicting trends, so the key here is to observe the 1W candle closing and then take action. A closing above the Lower Highs of the Triangle, confirms that there is a new pattern in play, a (dotted) Channel Up similar to the uptrend of October - December 2023. In that case, we will buy on the weekly close and target 1.11400 (Resistance 2).
If on the other hand the 1W candle closes back below the Lower Highs (thus still inside the blue Channel Up), we will remain bearish, aiming for a new Bearish Leg that will test again (3rd time) the 1W MA100 (green trend-line). In that case our Target will be modified to 1.075000.
-------------------------------------------------------------------------------
** Please LIKE 👍, FOLLOW ✅, SHARE 🙌 and COMMENT ✍ if you enjoy this idea! Also share your ideas and charts in the comments section below! This is best way to keep it relevant, support us, keep the content here free and allow the idea to reach as many people as possible. **
-------------------------------------------------------------------------------
💸💸💸💸💸💸
👇 👇 👇 👇 👇 👇

EUR/USD Surges to New Highs Amid US Dollar WeaknessThe EUR/USD pair extended its rally early Monday, reaching its highest level since March at approximately 1.0970. Disappointing labor market data from the US caused a significant selloff of the US Dollar (USD) during the American session on Friday. Nonfarm Payrolls in the US increased by 114,000 in July, falling well short of the market expectation of 175,000, and the Unemployment Rate rose to 4.3% from 4.1% in June. In response to the July jobs report, the CME FedWatch Tool indicates that markets are nearly fully pricing in a 50 basis point Federal Reserve (Fed) rate cut in September. The technical outlook for EUR/USD shows overbought conditions, suggesting that the pair may continue to rise toward the next supply area around 1.1033, where a price reversal is possible. It will be crucial to monitor the COT report in that area. We are planning to place a pending order in anticipation of this movement.
✅ Please share your thoughts about EUR/USD in the comments section below and HIT LIKE if you appreciate my analysis. Don't forget to FOLLOW ME; you will help us a lot with this small contribution.
